The US BizAv (Business Aviation) market has been booming since March 2021. This series of articles track the traffic trend of this market. We define the BizAv market as part-135 on-demand for-hire private flying by business jets or certain turboprop planes. The numbers in the following charts exclude part-91 private flights. If you are interested in all flights by business jets, or detailed flights by route and operator, please get in touch with us.
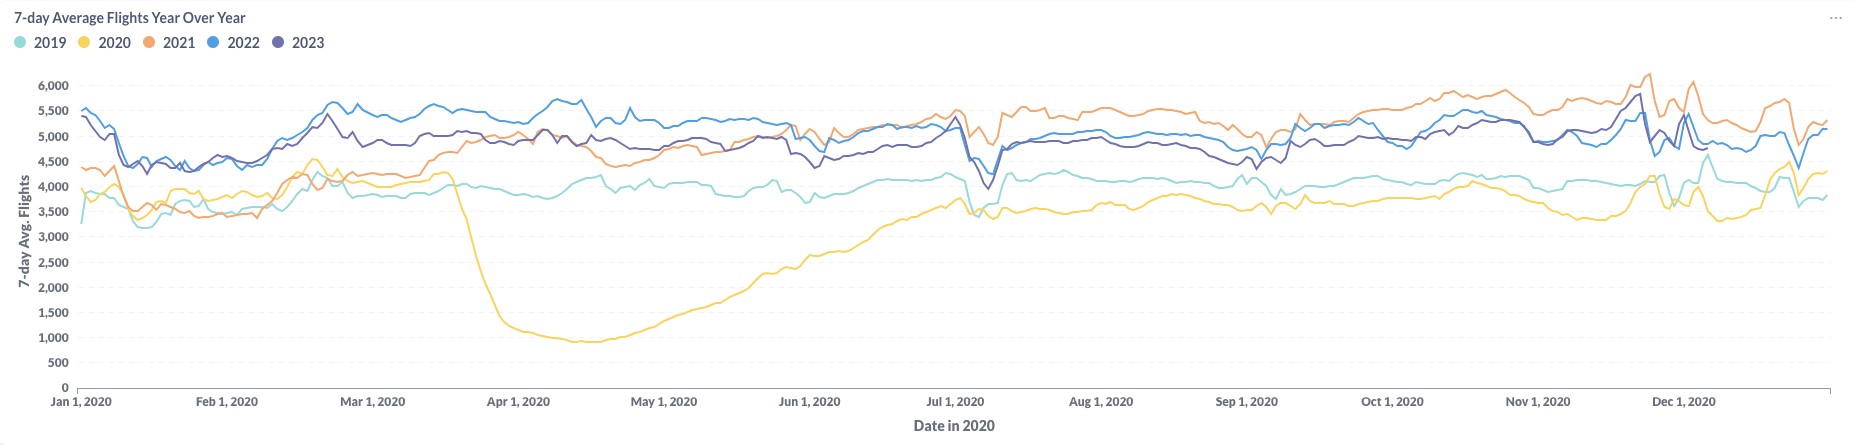
Figure 1: Year over Year Trend of the U.S. BizAv Market
Figure 1 offers a visual depiction of the trajectory of U.S. Business Aviation (BizAv) traffic, encompassing the period from January 2019 to November 2023. Notably, the graph highlights a significant increase in traffic leading up to Thanksgiving 2023. While post-Thanksgiving fluctuations are typical, it’s worth noting that the overall decline in traffic is more pronounced compared to the previous year. As of the end of November 2023, the 7-day average flight count has fallen below the levels observed in 2022.
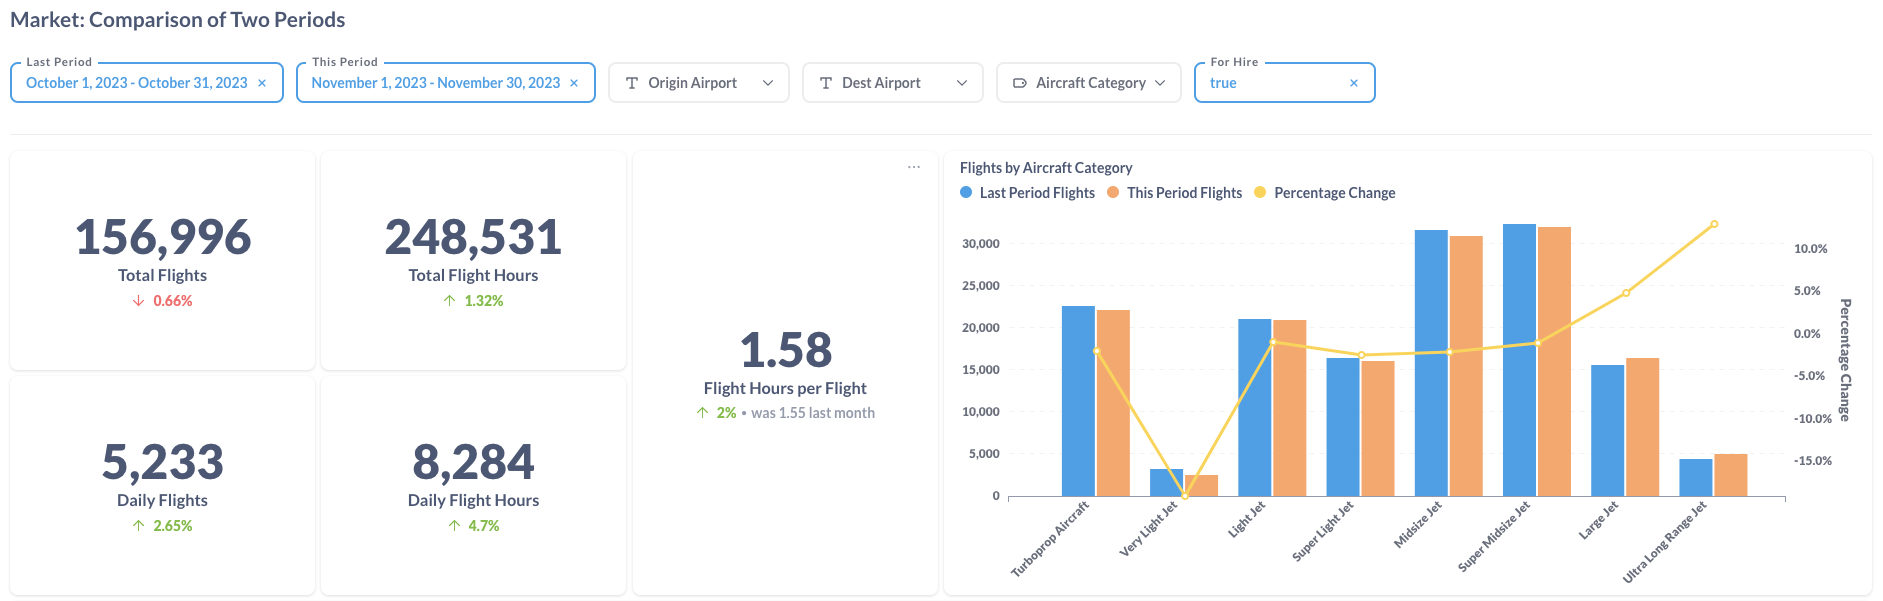
Figure 2: Comparison of the U.S. BizAv Flights This Month vs. Last Month
Figure 2 offers a side-by-side analysis of flight data for October 2023 and November 2023. During this specific period, there was a notable 2.65% increase in daily flights when compared to the preceding month, with daily flight hours showing a substantial gain of 4.7%. It’s crucial to take into account that the overall monthly figures for both flights and flight hours may appear less impressive due to the extra day in October. Across all aircraft types, there was a month-to-month growth in activity within all categories, except for Very Light Jets, which experienced a significant decrease.
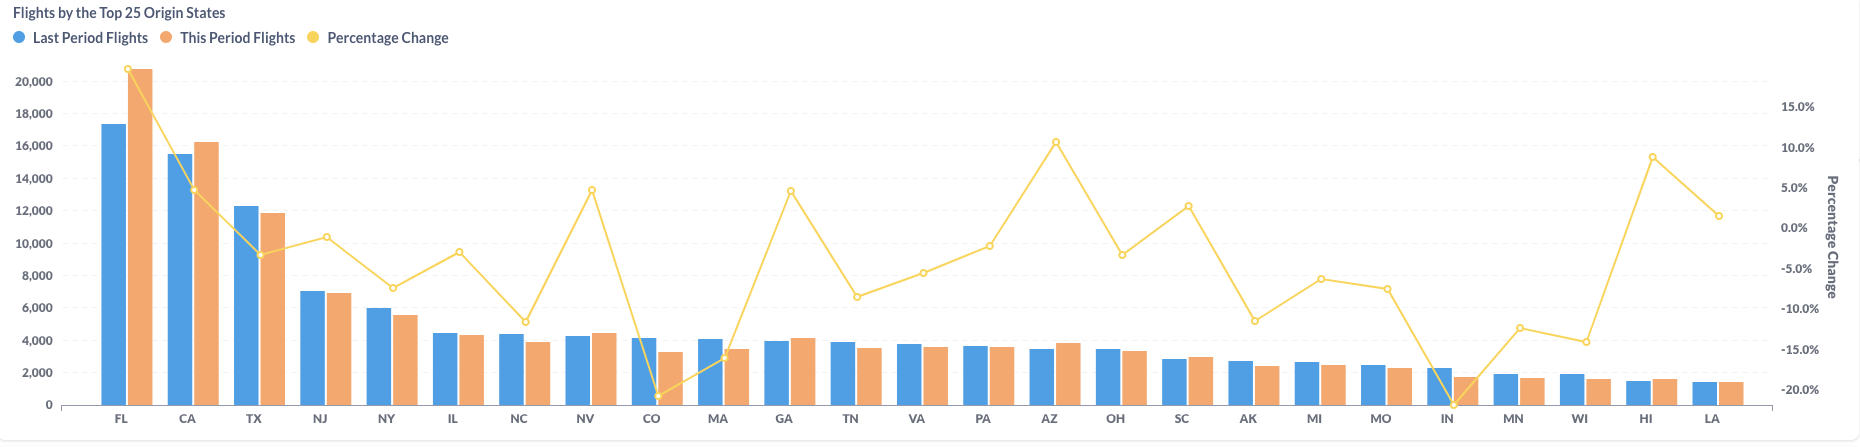
Figure 3: Comparison of the U.S. BizAv Flights by the Top 25 Origin States (This Month vs. Last Month)
In the shift from October to November 2023, a larger number of U.S. states witnessed an increase in their aviation activity compared to those that observed a decrease. Notably, Florida (FL) stood out as the most notable beneficiary, closely followed by California (CA). However, the total number of flights from Texas (TX) decreased in November compared to October.

Figure 4: Comparison of the U.S. BizAv Flights This Year vs. Last Year
In contrast to November 2022, November 2023 witnessed a significant 3.75% increase in the overall number of business flights. This uptick in flight frequency was accompanied by an even more substantial 3.99% increase in total flight hours, primarily attributed to a rise in the average hours per flight.
Among the various aircraft categories, Very Light Jets experienced a notable decline of 25.2%, while Turboprop aircraft decreased by 6.8%. Conversely, all other larger aircraft categories recorded gains ranging from 2.6% to 17.9%. In general, customers exhibited a preference for larger aircraft over the previous year.
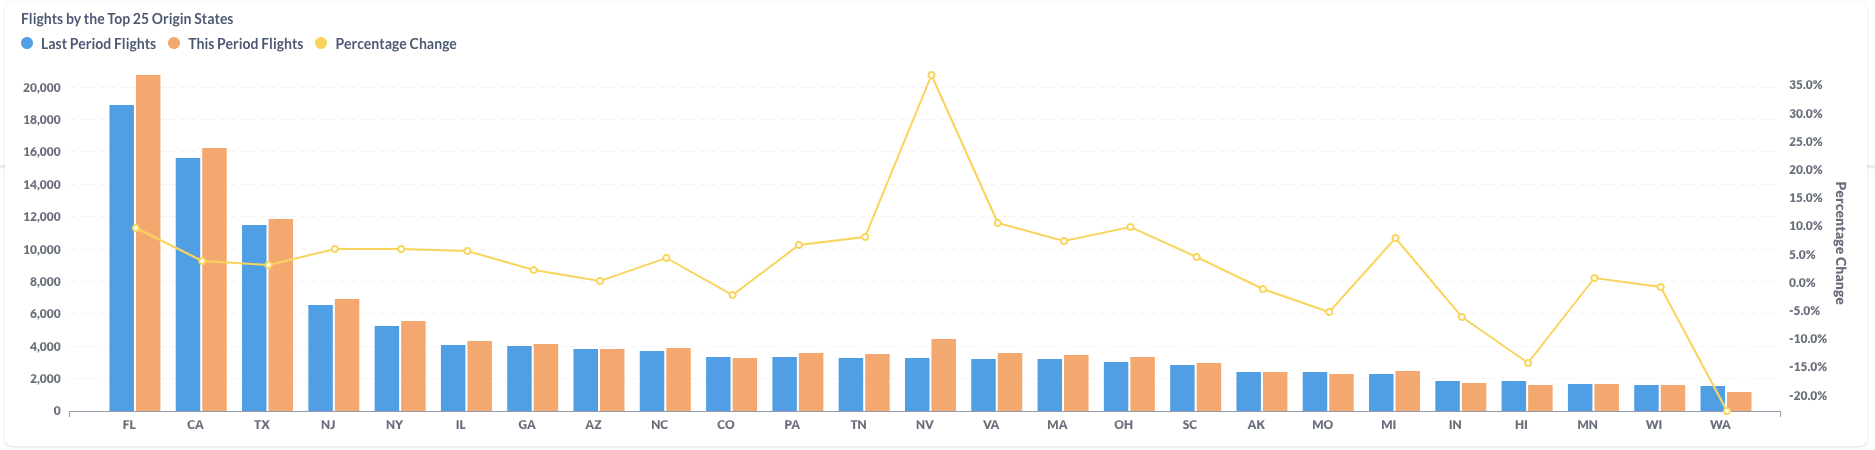
Figure 5: Comparison of the U.S. BizAv Flights by the Top 25 Origin States (This Year vs. Last Year)
When analyzing flight data for November 2022 and November 2023, it becomes apparent that the majority of large states experienced an upswing in their flight numbers. For example, Florida (FL) recorded a substantial increase of 9.7% in its flight activity, while Nevada (NV) witnessed a remarkable surge of 36.9%. Clearly, business jet users frequented Las Vegas and Naples, FL more often during this November.