Traffic and fare data by airline and route can provide valuable insights into market trends, demand, and competition. By analyzing this data, airlines can optimize their pricing strategies, plan their capacity, and make informed decisions about their route network. The data can also be used for market and competitive analysis, helping airlines identify profitable routes and gain a competitive advantage.
Based on initial true O&D level data from FlightBI released this week, both domestic and international air traffic in the United States witnessed a decline from October to November. Concurrently, there was a modest increase in average airfares during the same period.
Volume Trend
In November 2023, the number of passengers traveling domestically in the US was 51.7 million, marking a 4.8% reduction from October’s 54.3 million, primarily attributable to seasonal factors. Significantly, this number surpasses the pre-pandemic count by 9.3%, as it stands well above the 47.3 million passengers recorded in November 2019. In the international sector, US air travel exhibited a minor decrease, dipping from 18.8 million passengers to 18.2 million.
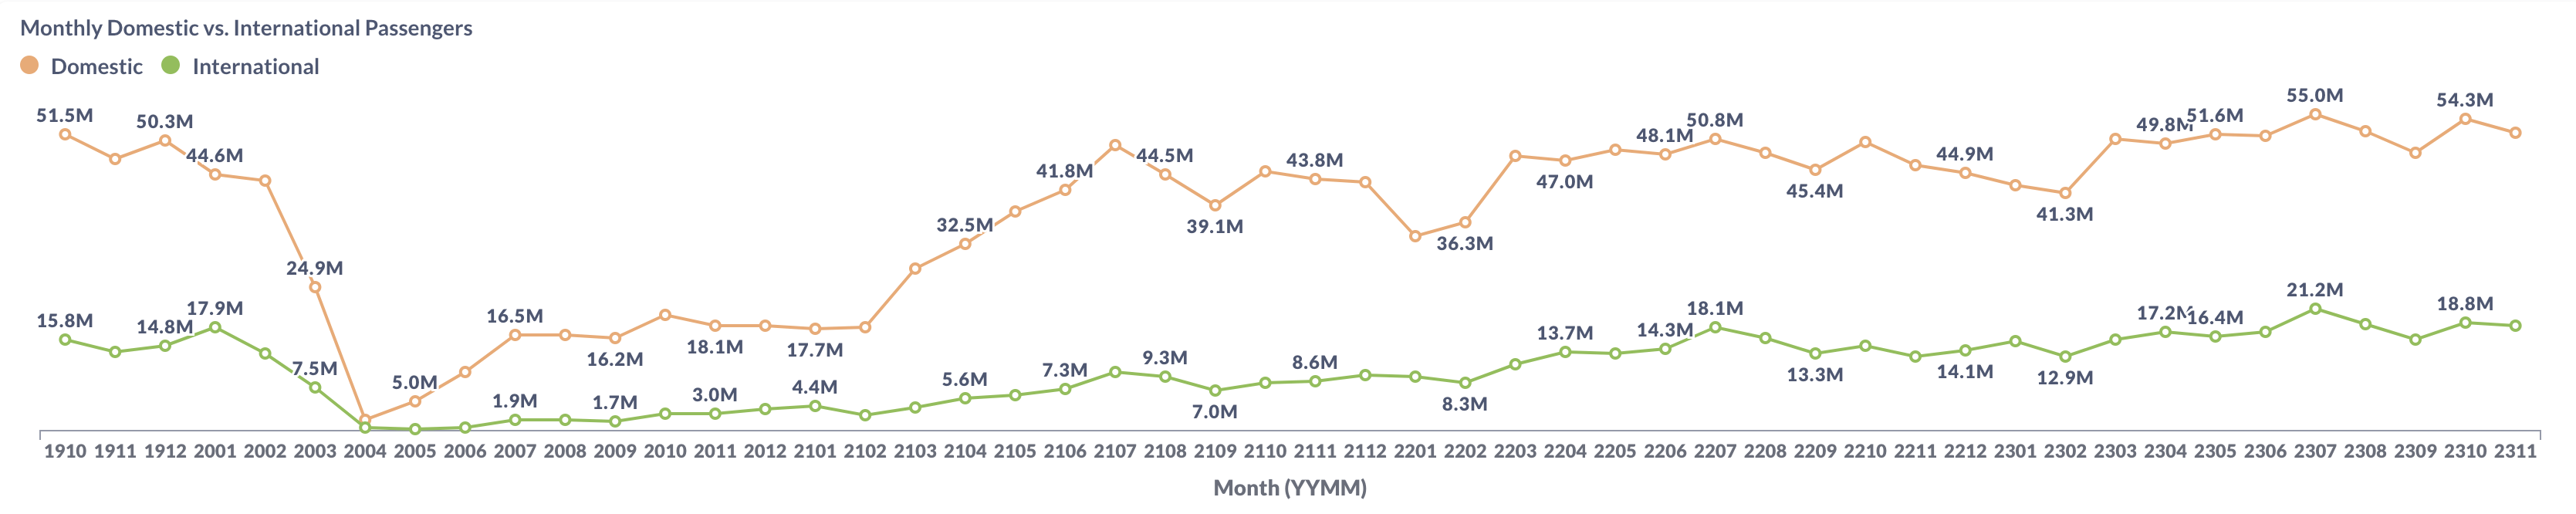
Figure 1: US Domestic and International Air Traffic by Month
Airfare Trend
The recent data reveals subtle shifts in airfare trends. The average gross fare for air travel saw a marginal increase, climbing from $214 in October to $215 in November. Concurrently, the average net fare also experienced a slight uptick, moving from $182 in October to $183 in November.
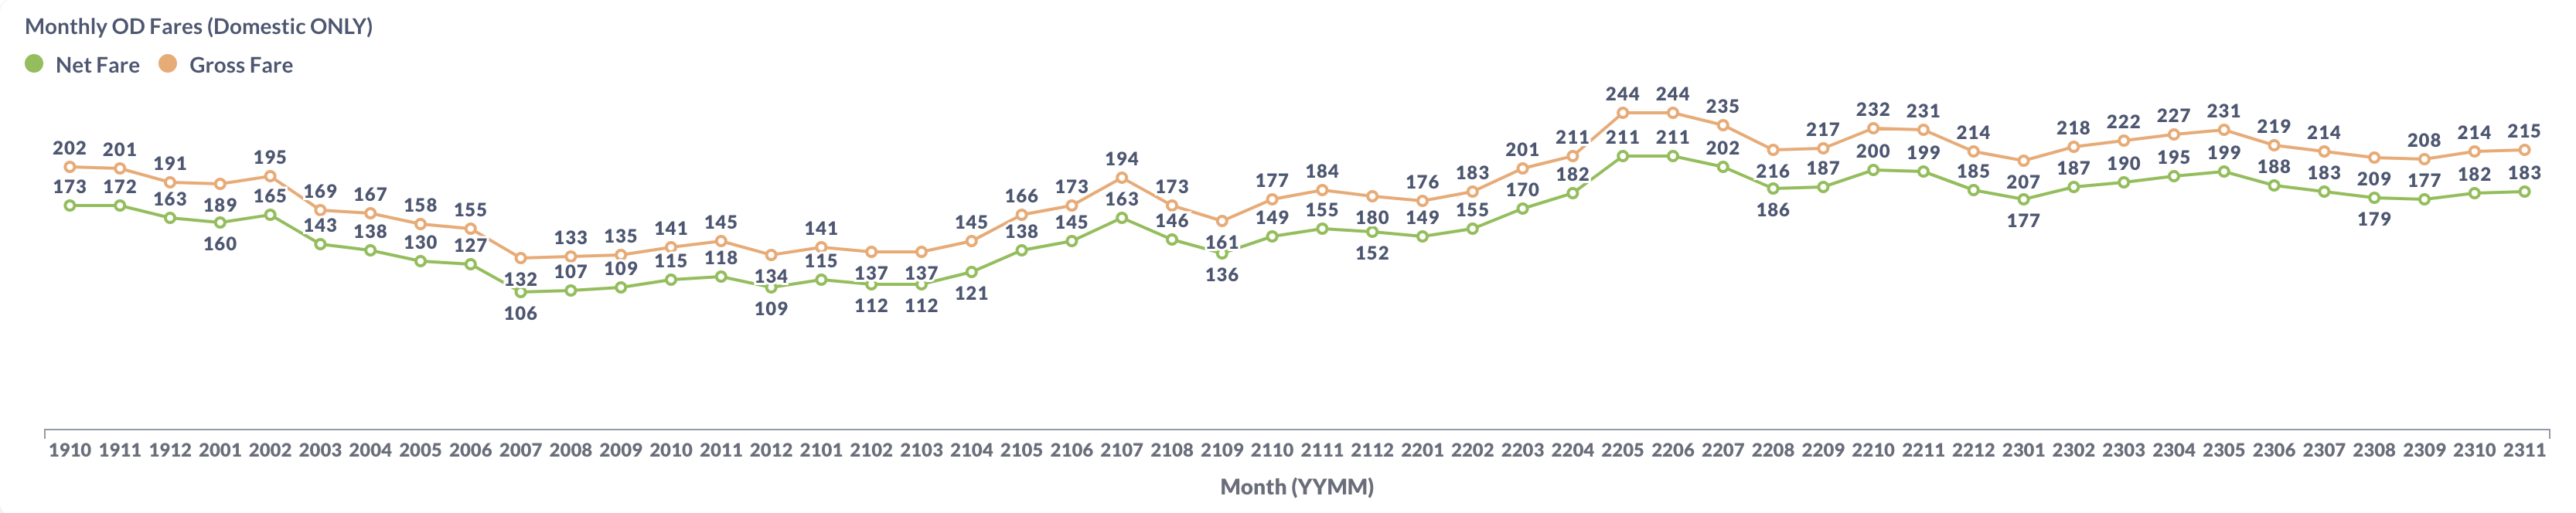
Figure 2: US Domestic Average Airfare by Month
Load Factor Trend
In November, a modest decline in the average load factor was observed among major US airlines, dipping to 79.8% from October’s 81.5%, as highlighted in Figure 4. Notably, Delta (DL) registered a decrease in its load factor compared to the previous month, whereas United (UA) showed an improvement. Despite these variations, the average load factor is very close to the pre-COVID level (e.g., 80.2% in November 2019).
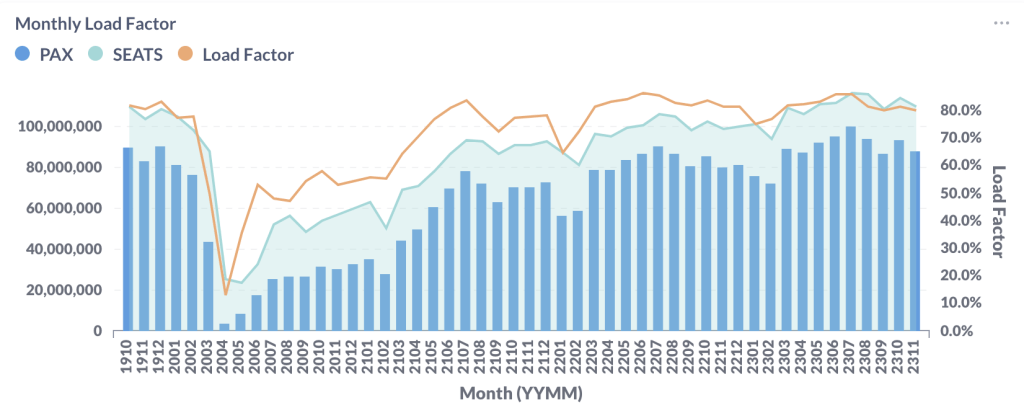
Figure 3: US Airlines’ Average Load Factor by Month
Month Over Month Comparison
Between October and November 2023, the four leading US airlines witnessed a traffic decline, consistent with expected seasonal patterns. In contrast, smaller airlines such as Spirit (NK) and JetBlue (B6) saw an uptick in traffic. Specifically, Spirit (NK) registered a notable 5.6% increase, while Delta (DL) experienced a 5.3% decrease.
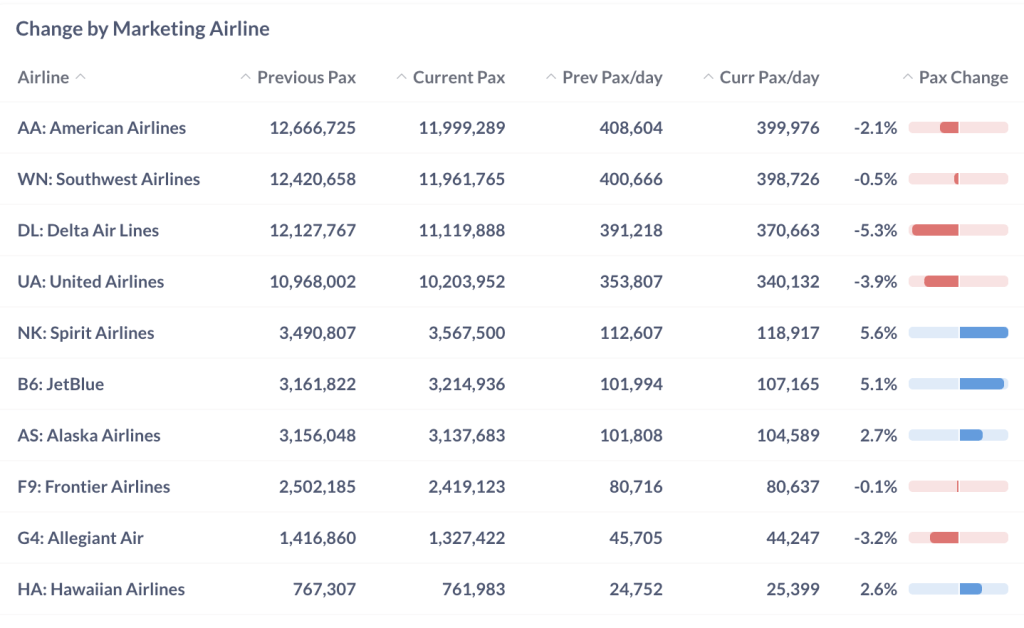
Figure 4: Air Traffic by Dominant Marketing Airlines in October 2023 (Previous) vs. November 2023 (Current)
In the same timeframe, notable airports such as Miami (MIA) and Phoenix (PHX) experienced a rise in daily passenger volumes compared to the preceding month. Conversely, Boston (BOS) witnessed a 12.9% reduction in its daily passenger traffic.
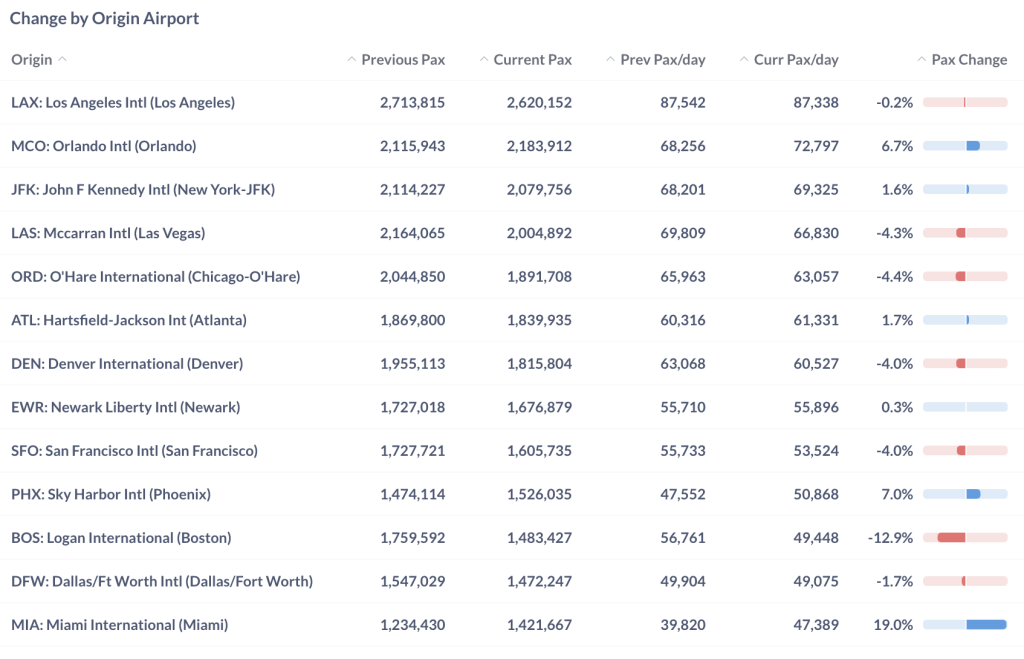
Figure 5: Air Traffic by Top Origin Airports in October 2023 (Previous) vs. November 2023 (Current)
Year Over Year Comparison
The year-over-year comparison between November 2023 and November 2022 reveals a positive growth trajectory for all major US airlines. Frontier (F9), Spirit (NK), and United (UA) stood out with substantial growth figures, registering increases of 30.7%, 24.1%, and 18.8%, respectively, leading the upward trend.
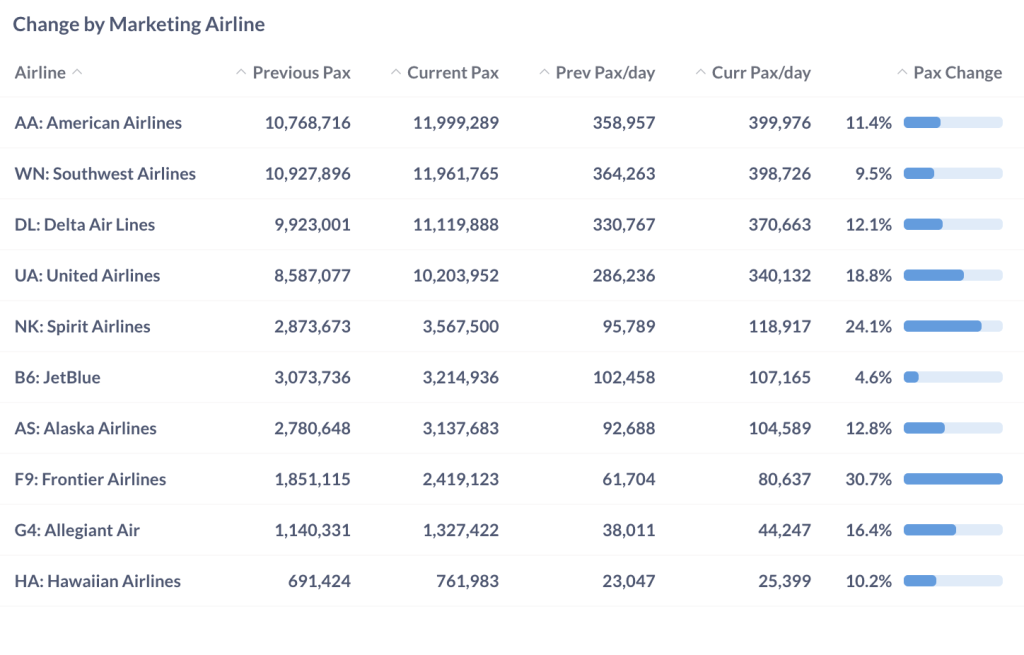
Figure 6: Air Traffic by Dominant Marketing Airlines in November 2023 (Current) vs. November 2022 (Previous)
From November 2022 to November 2023, all major airports reported growth exceeding 10%. Notably, New York’s JFK and Miami International Airport (MIA) spearheaded this year-over-year expansion, with JFK witnessing a 23.3% increase and MIA achieving a 20.0% rise.
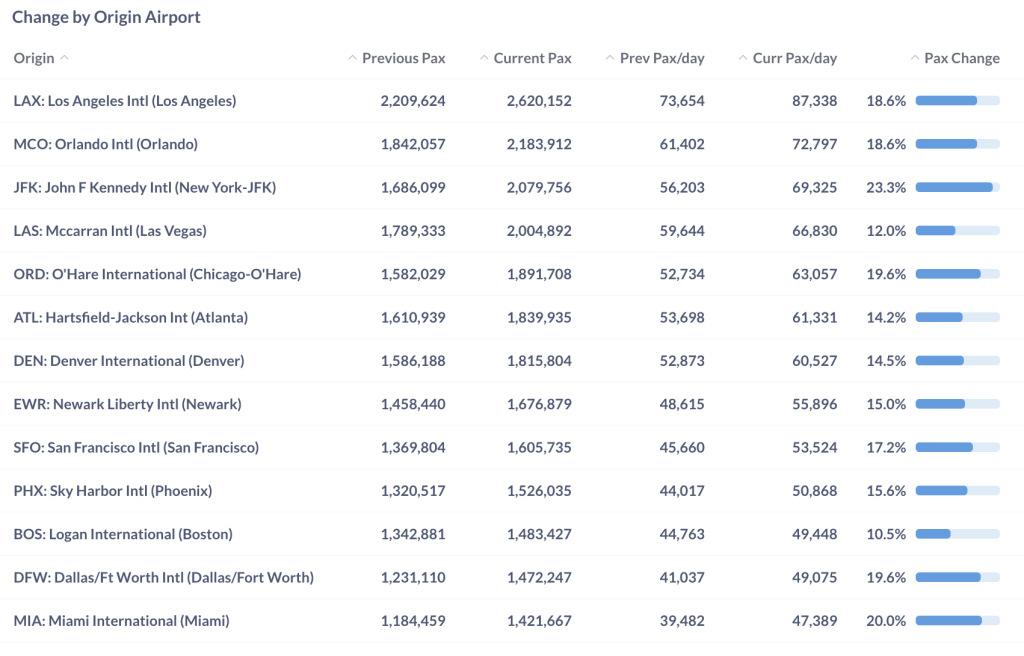
Figure 7: Air Traffic by Top Origin Airport in November 2023 (Current) vs. November 2022 (Previous)
For more detailed information on traffic and fares by route and airline, please contact service@flightbi.com or request a demo of Fligence USOD. They will be able to provide you with customized information to meet your specific needs and requirements.