Traffic and fare data by airline and route can provide valuable insights into market trends, demand, and competition. By analyzing this data, airlines can optimize their pricing strategies, plan their capacity, and make informed decisions about their route network. The data can also be used for market and competitive analysis, helping airlines identify profitable routes and gain a competitive advantage.
Based on initial true O&D level data from FlightBI released this week, both domestic and international air traffic in the United States witnessed a downward trend from December 2023 to January 2024. Concurrently, there was a modest increase in average airfares during the same period.
Volume Trend
January 2024 witnessed a decrease in domestic passengers, dropping to 45.5 million from December 2023’s 51.4 million. However, this figure marks a 2% increase compared to January 2020’s 44.6 million passengers, two months before the COVID-19 outbreak, indicating a gradual recovery in domestic air travel. The international sector experienced a modest decline, with passenger numbers falling from 19.9 million in December 2023 to 19.5 million in January 2024.
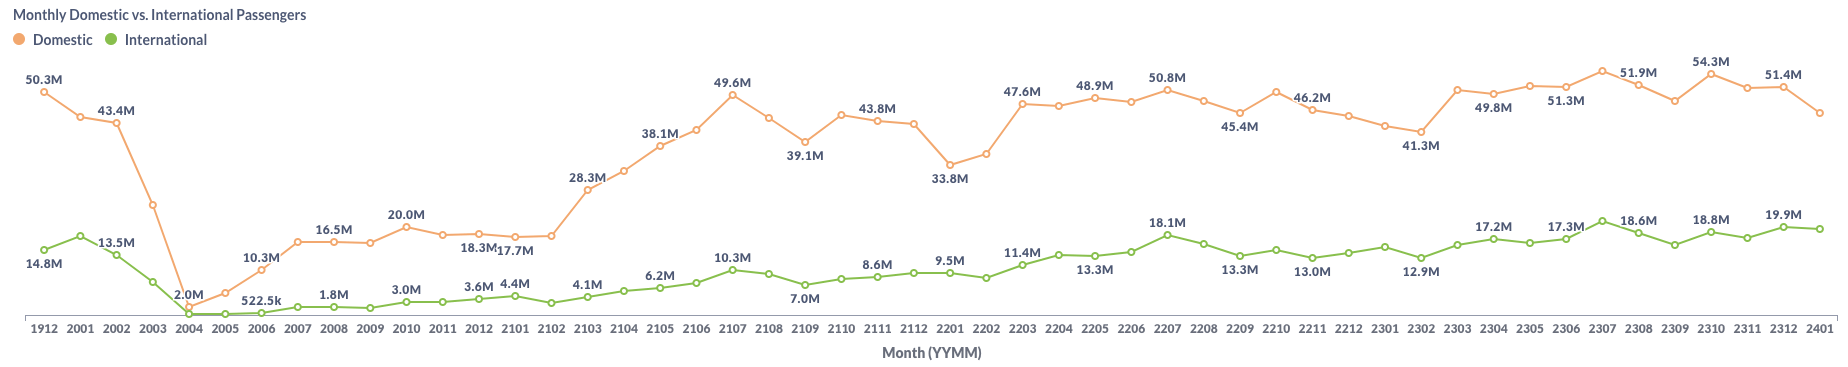
Figure 1: US Domestic and International Air Traffic by Month
Airfare Trend
Recent data reveals subtle shifts in airfare trends, highlighting a marginal increase in flight costs. The average gross fare for flights inched up from $218 in December 2023 to $219 in January 2024. Similarly, the average net fare experienced a slight uptick, advancing from $186 to $187 during the same timeframe. This points to a modest rise in air travel costs at the outset of 2024.
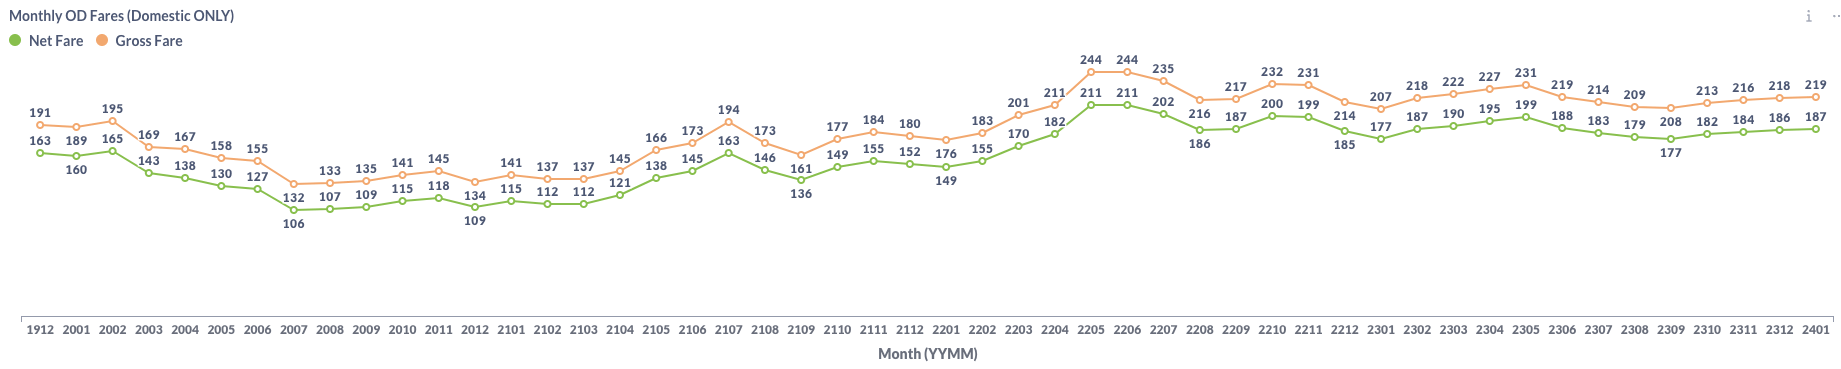
Figure 2: US Domestic Average Airfare by Month
Load Factor Trend
In January, major US airlines experienced a decline in the average load factor, which fell to 76.5% from December’s 79.4%, as depicted in Figure 3. This decrease placed the average load factor below the pre-COVID benchmark of 80.4%, observed in January 2020, and also below the load factor of 77.6% recorded in January 2023, indicating a continued impact on airline capacity utilization relative to both pre-pandemic levels and the previous year.
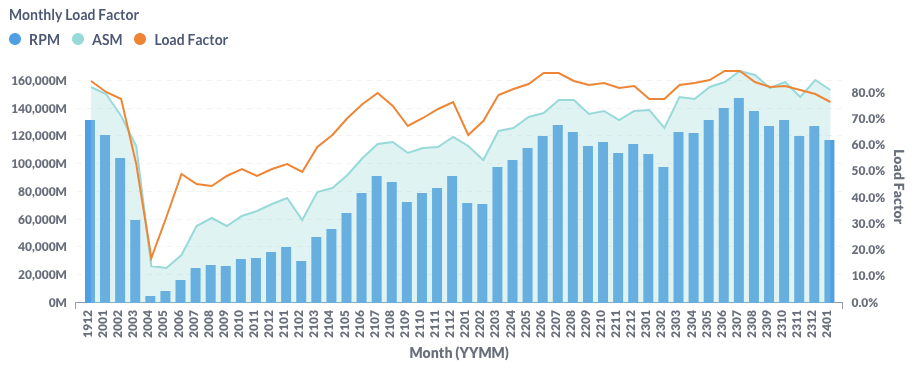
Figure 3: US Airlines’ Average Load Factor by Month
Month Over Month Comparison
Between December 2023 and January 2024, all major US airlines witnessed a month-over-month downturn in traffic. Leading this decline were Alaska Airlines (AS) and Southwest Airlines (WN), which experienced significant drops of 18.4% and 15.8%, respectively.
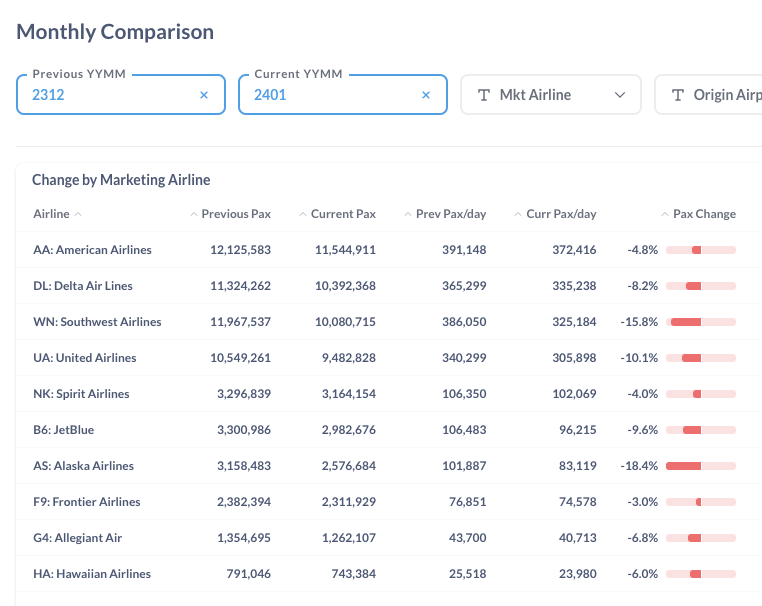
Figure 4: Air Traffic by Dominant Marketing Airlines in December 2023 (Previous) vs. January 2024 (Current)
In the same timeframe, the majority of large airports experienced a decrease in traffic. However, exceptions were noted in Florida, where airports such as Fort Lauderdale (FLL) and Miami (MIA) saw an uptick in traffic. San Francisco (SFO) experienced the most significant decline, with a 19.3% drop, while airports like JFK, ORD, BOS, and SEA each registered decreases exceeding 17%.
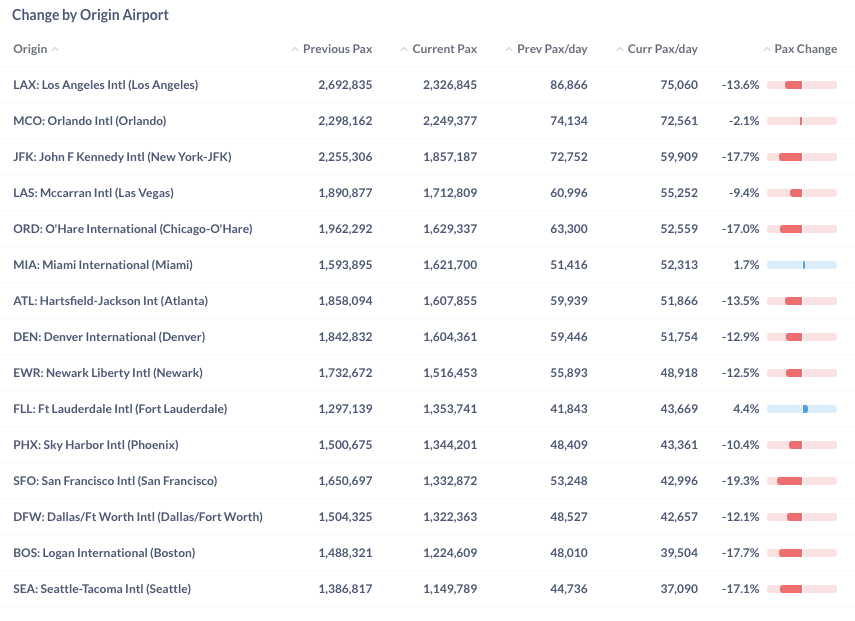
Figure 5: Air Traffic by Top Origin Airports in December 2023 (Previous) vs. January 2024 (Current)
Year Over Year Comparison
The year-over-year analysis from January 2023 to January 2024 reveals an overall positive growth trend among major US airlines, with the exception of Alaska Airlines (AS). Leading the upward momentum, Frontier Airlines (F9), American Airlines (AA), and United Airlines (UA) showcased robust growth, recording increases of 19.6%, 11.0%, and 6.8%, respectively. This underscores their significant contributions to the industry’s positive trajectory. In contrast, Alaska Airlines (AS) experienced a 2.8% decline compared to the previous year.
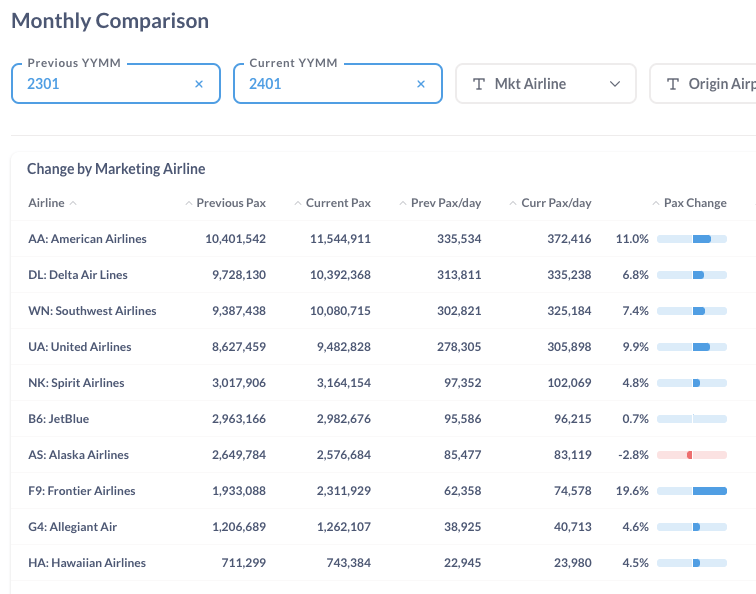
Figure 6: Air Traffic by Dominant Marketing Airlines in January 2024 (Current) vs. January 2023 (Previous)
From January 2023 to January 2024, the majority of major airports saw an increase in traffic. Leading the year-over-year growth, Miami (MIA), John F. Kennedy (JFK) in New York, and Dallas/Fort Worth (DFW) experienced notable expansions, with traffic increases of 18.5%, 16.7%, and 15.9%, respectively. Meanwhile, traffic at Phoenix (PHX) and Las Vegas (LAS) remained relatively stable, showing minimal changes and slight decreases.
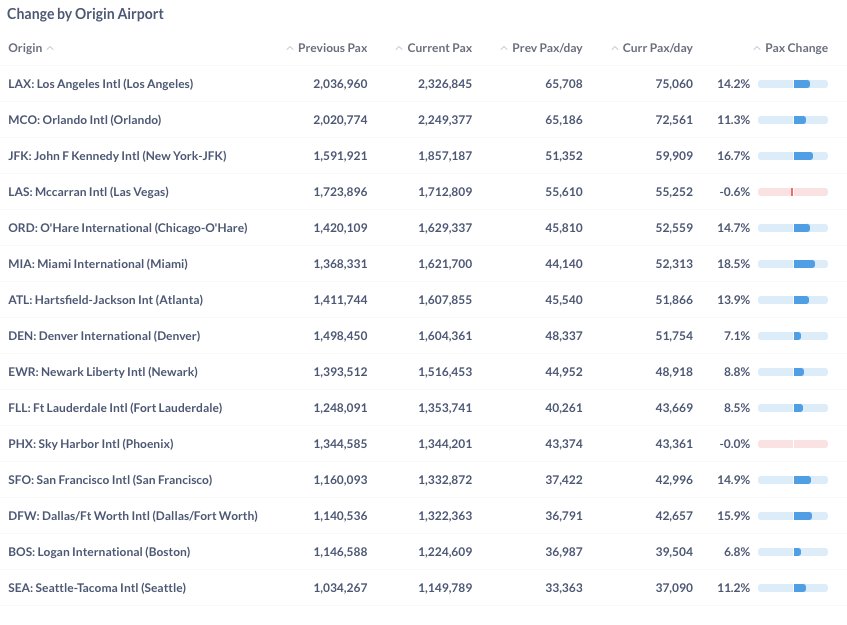
Figure 7: Air Traffic by Top Origin Airport in January 2024 (Current) vs. January 2023 (Previous)
For more detailed information on traffic and fares by route and airline, please contact service@flightbi.com or request a demo of Fligence USOD. They will be able to provide you with customized information to meet your specific needs and requirements.