The US BizAv (Business Aviation) market has been booming since March 2021. This series of articles track the traffic trend of this market. We define the BizAv market as part-135 on-demand for-hire private flying by business jets or certain turboprop planes. The numbers in the following charts exclude part-91 private flights. If you are interested in all flights by business jets, or detailed flights by route and operator, please get in touch with us.
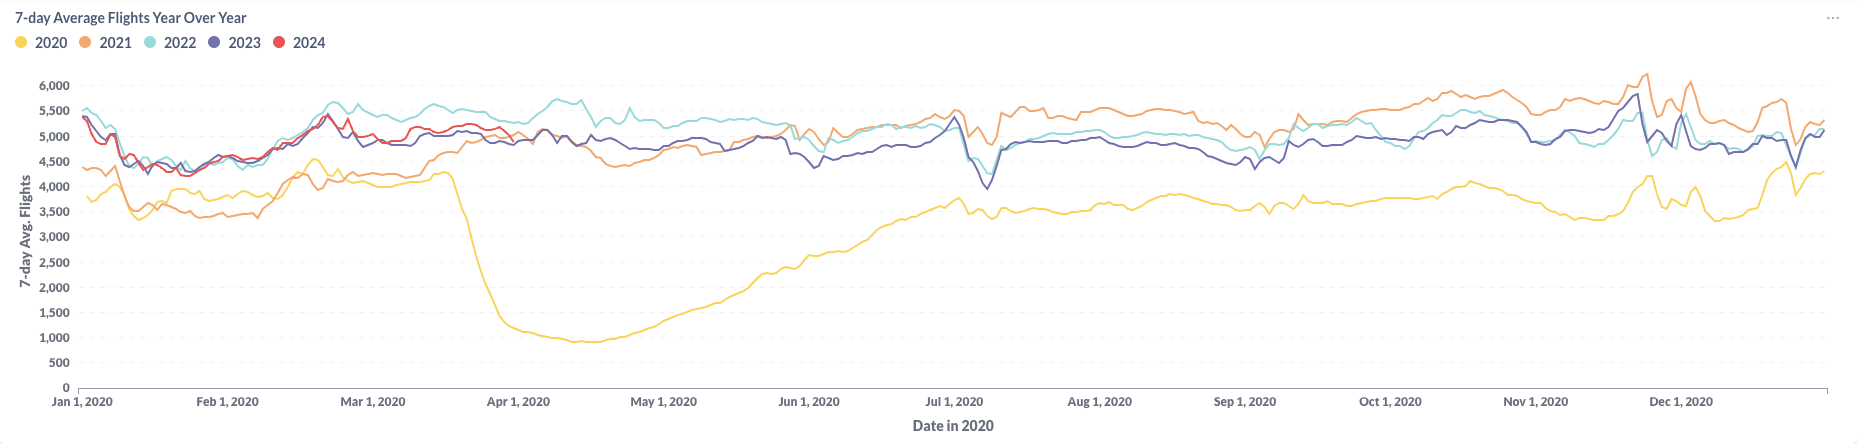
Figure 1: Year over Year Trend of the U.S. BizAv Market
Figure 1 illustrates the trends in U.S. Business Aviation (BizAv) traffic from January 2020 to March 2024. In March 2024, the flight activity trend positioned itself between the curves of 2022 and 2023, leaning closer to the lower levels observed in 2023.
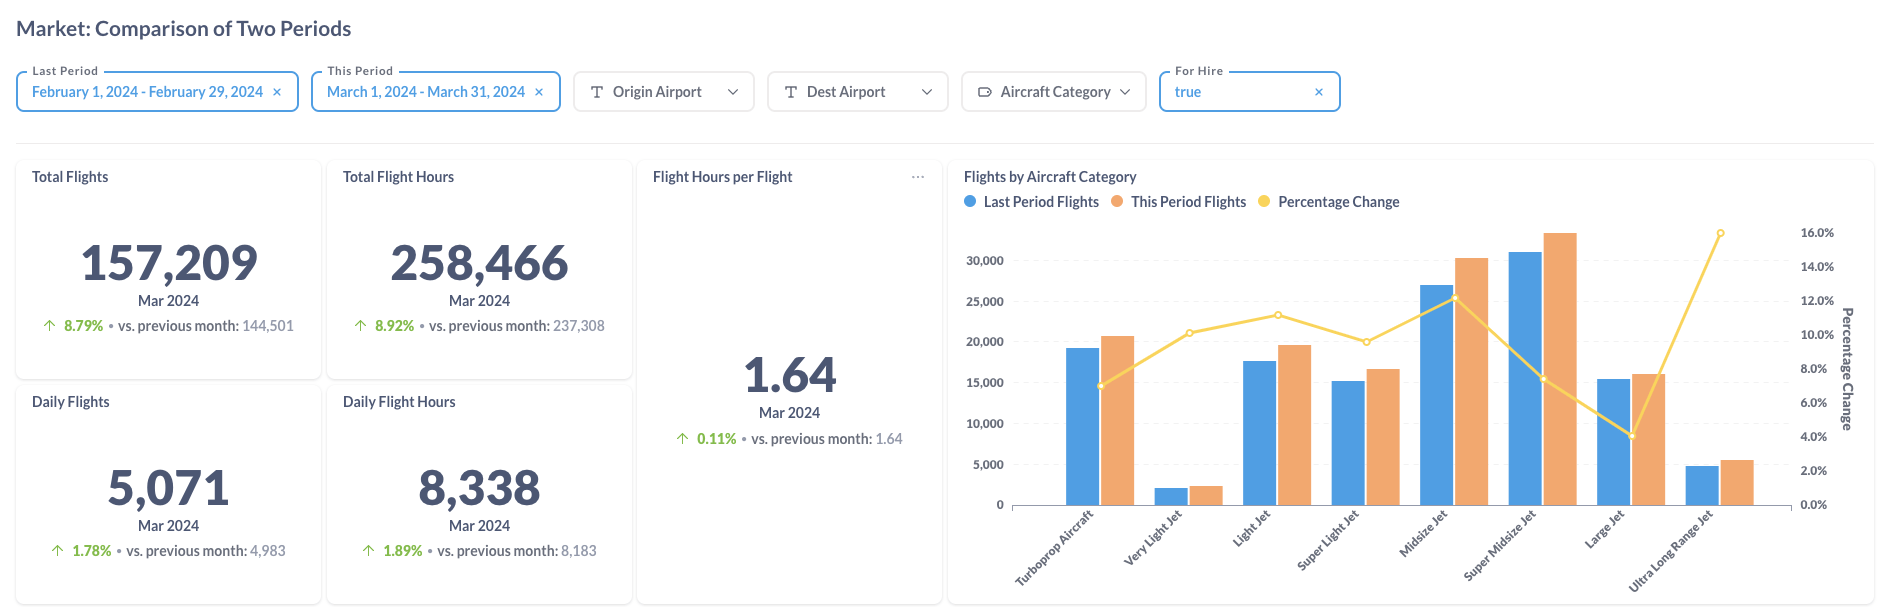
Figure 2: Comparison of the U.S. BizAv Flights This Month vs. Last Month
Figure 2 presents a comparative analysis of flight data between March 2024 and February 2024, revealing a 1.78% rise in daily flight frequency. The increase in total daily flight hours was slightly better at 1.89%, contributed by the increased average flight duration per departure. The increase of average flight duration was attributed to the 16.0% growth in flight activities by Ultra Long Range Jets, outpacing the growth of smaller jets. However, flights by all aircraft categories achieved a positive growth.
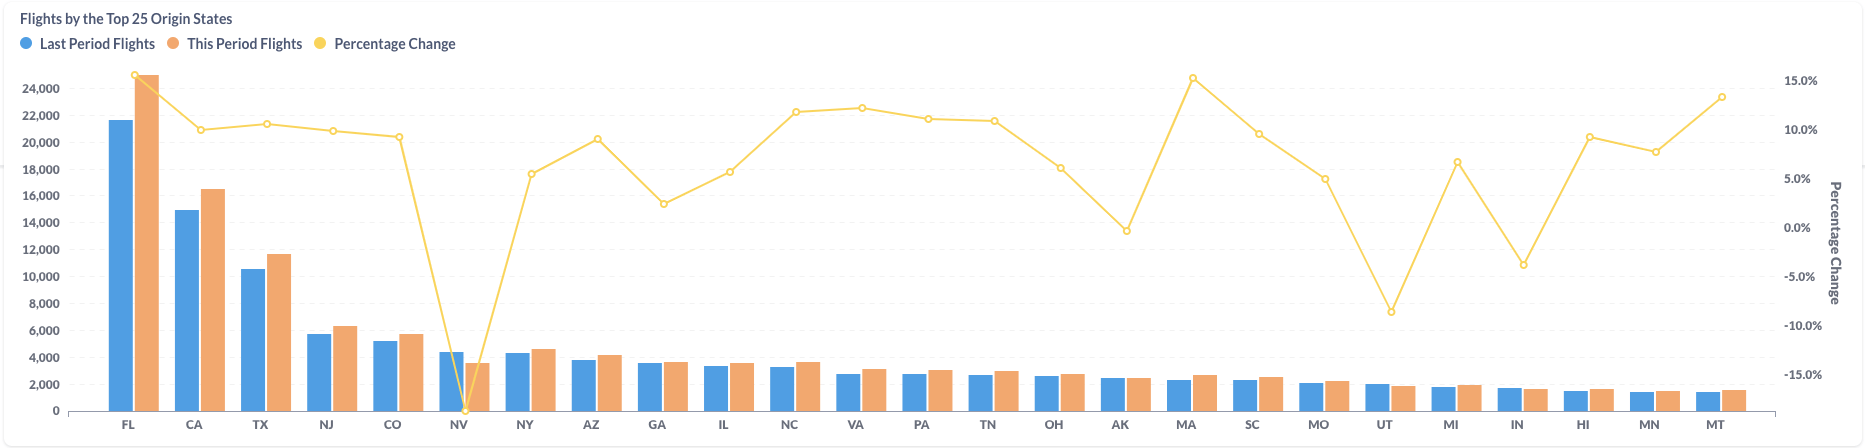
Figure 3: Comparison of the U.S. BizAv Flights by the Top 25 Origin States (This Month vs. Last Month)
Between February 2024 and March 2024, aviation activity experienced significant growth in several large U.S. states, including Florida (FL), California (CA) and Texas (TX). The top 3 states saw increases of 15.6%, 10.0% and 10.6% respectively. Notably, Nevada (NV) recorded the deepest decline in volume of Business Aviation (BizAv) activity at 18.7%, on a month-to-month basis.
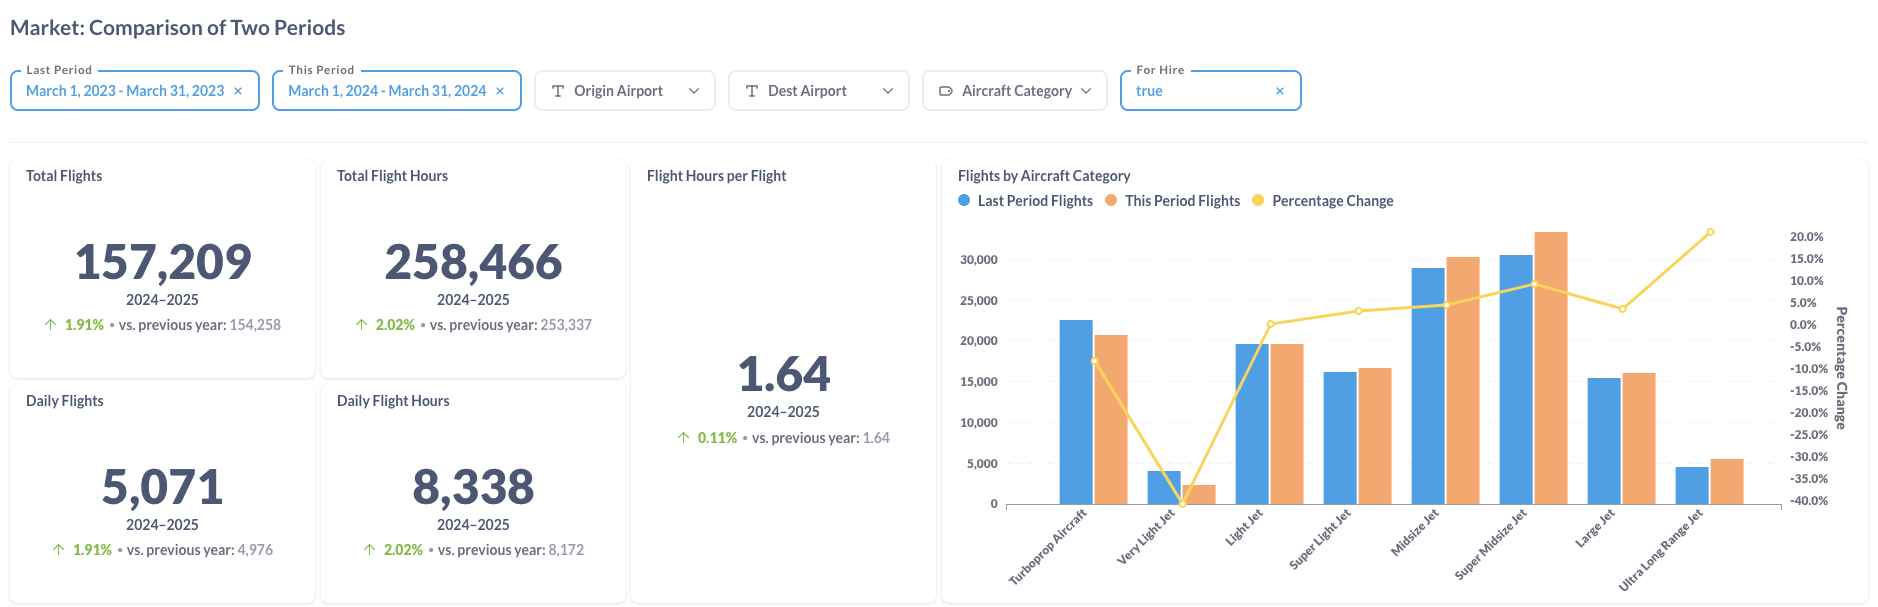
Figure 4: Comparison of the U.S. BizAv Flights This Year vs. Last Year
March of this year, compared to March 2023, saw a 1.91% increase in the number of flights and a 2.02% rise in flight hours, attributable to a 0.11% increase in average flight hours per flight. Among the different aircraft types, Very Light Jets experienced a significant decline of 40.7%, while Turboprop aircraft recorded a 8.2% decrease. Conversely, the larger aircraft categories, including Super Midsize Jets, Large Jets, and Ultra Long Range Jets, observed increases, especially Ultra Long Range Jets created a record of growth at 21.2%. This trend suggests a shift in customer preference towards larger aircraft and long range over the previous year.
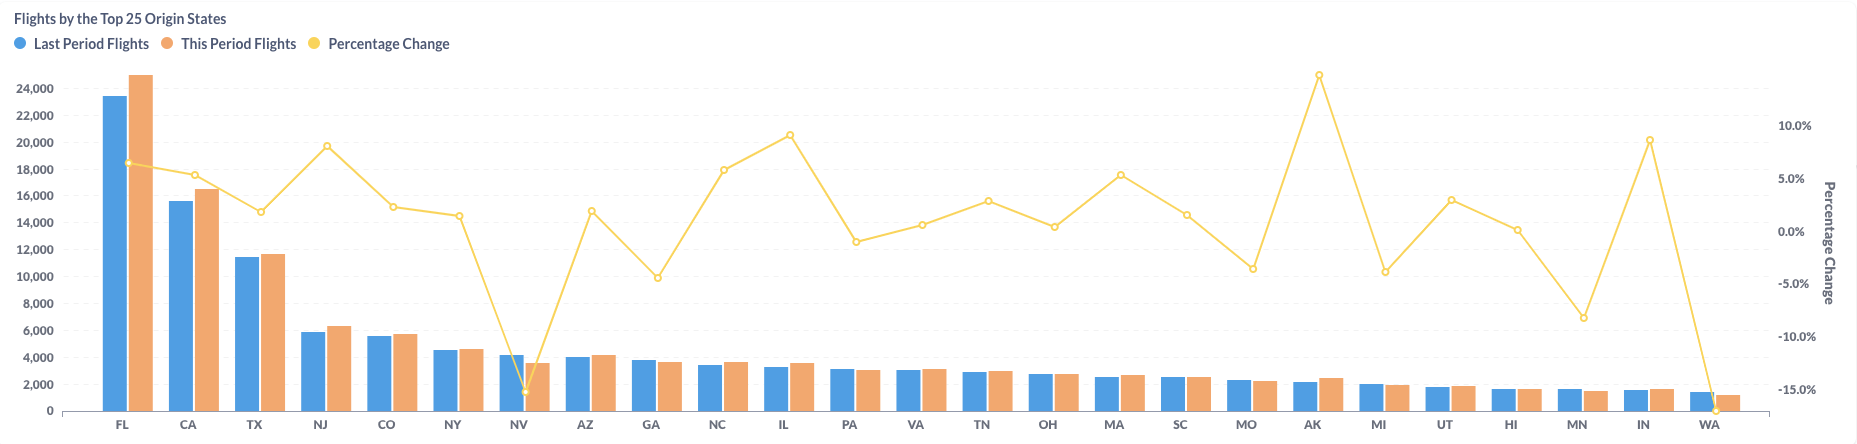
Figure 5: Comparison of the U.S. BizAv Flights by the Top 25 Origin States (This Year vs. Last Year)
Comparing flight data from March 2023 to March 2024, the majority of larger states experienced an uptick in total flight activity. The top three states by activity, Florida (FL), California (CA), and Texas (TX), all recorded increases in their flight operations, with growth rates at 6.5%, 5.3% and 1.8% respectively. In contrast, Nevada (NV) witnessed a significant decline in flight activity, with a decrease of 15.2%.
To summarize, from March 2023 to March 2024, the U.S. Business Aviation (BizAv) market witnessed growth in states like Florida, California, and Texas, but Nevada, where Las Vegas is located, saw a decline. A trend towards larger aircraft emerged, with declines in Very Light Jets against growth in larger jet categories. Month-over-month data from February to March 2024 showed activity spikes in most states, despite declines in Nevada, highlighting both seasonal fluctuations and a preference shift towards more capable aircraft within the BizAv sector.