Traffic and fare data by airline and route can provide valuable insights into market trends, demand, and competition. By analyzing this data, airlines can optimize their pricing strategies, plan their capacity, and make informed decisions about their route network. The data can also be used for market and competitive analysis, helping airlines identify profitable routes and gain a competitive advantage.
Based on initial true O&D level data from FlightBI released this week, there has been an increase in US domestic air traffic in February 2024 compared to the previous month, while international air traffic has experienced a decline. Additionally, there has been almost no change in average airfares during this period.
Volume Trend
In February 2024, domestic passenger numbers rose from 45.3 million in January to 46.1 million, showing a 6.2% increase compared to February 2020’s pre-COVID figure of 43.4 million passengers. This growth signifies a robust recovery in domestic air travel. Conversely, the international sector saw a decline, with passenger numbers decreasing from 19.4 million in January to 17.5 million in February 2024.
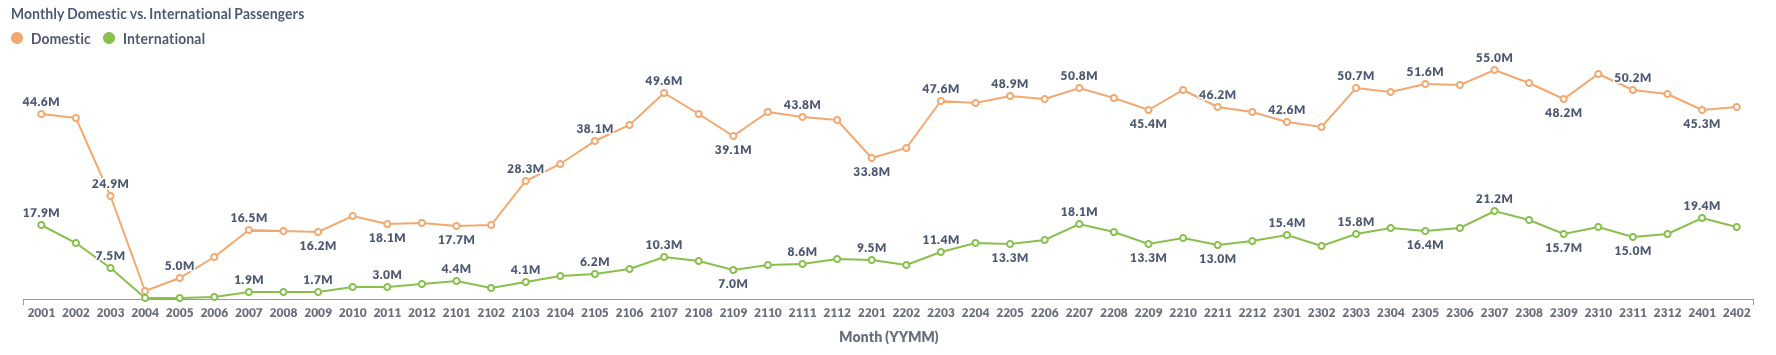
Figure 1: US Domestic and International Air Traffic by Month
Airfare Trend
The latest data indicates almost no changes in airfare trends. The average gross fare for flights remains at $211 in February. Meanwhile, the average net fare saw a slight increase from $180 to $181 during the same period.
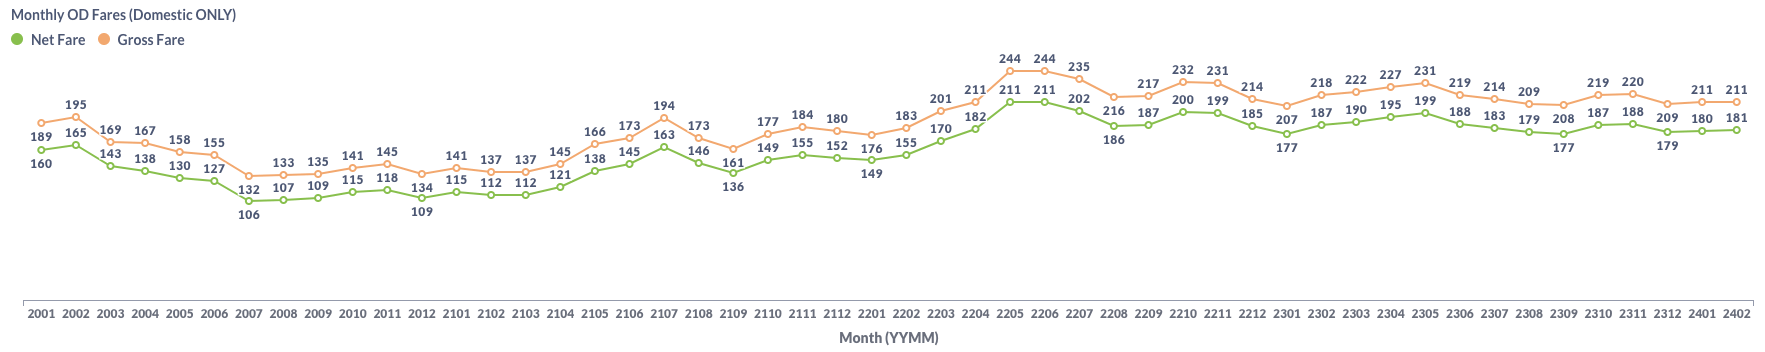
Figure 2: US Domestic Average Airfare by Month
Load Factor Trend
The Available Seat Miles (ASM) inched up while Revenue Passenger Miles (RPM) decreased from January 2024 to February 2024, leading to reduced average load factor of major US airlines from 78.7% in January to 75.4% in February, as illustrated in Figure 3. This decline places the average load factor below the pre-COVID benchmark of 77.5% seen in February 2020 and also lower than the load factor of 77.7% recorded in February 2023. These figures highlight a continued impact on airline capacity utilization compared to both pre-pandemic levels and the previous year.
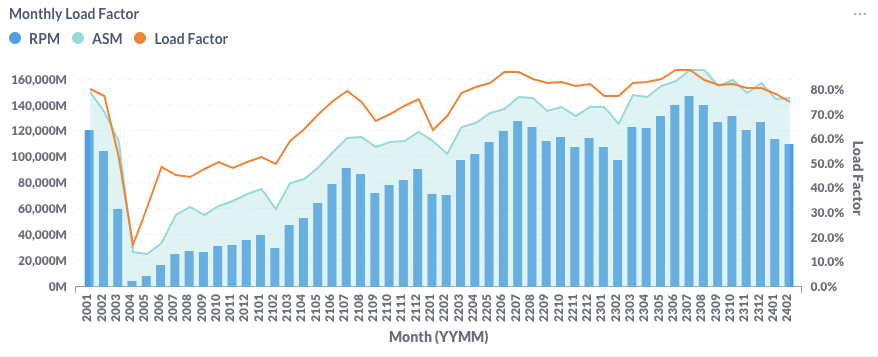
Figure 3: US Airlines’ Average Load Factor by Month
Month Over Month Comparison
In the transition from January 2024 to February 2024, all major US airlines observed an increase in traffic per day compared to the previous month. Notably, Alaska Airline (AS) and JetBlue (B6) led this surge with substantial growth rates of 14.5% and 9.4%, respectively.
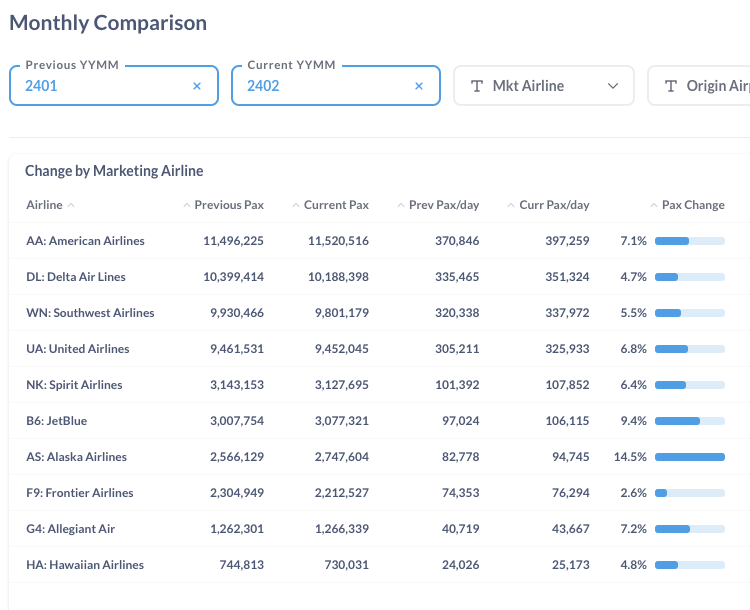
Figure 4: Air Traffic by Dominant Marketing Airlines in January 2024 (Previous) vs. February 2024 (Current)
During the same period, the majority of major airports saw a rise in daily traffic. Boston (BOS), Phoenix (PHX), and Chicago (ORD) led this growth with month-to-month increases of 16.3%, 11.5%, and 9.2%, respectively.
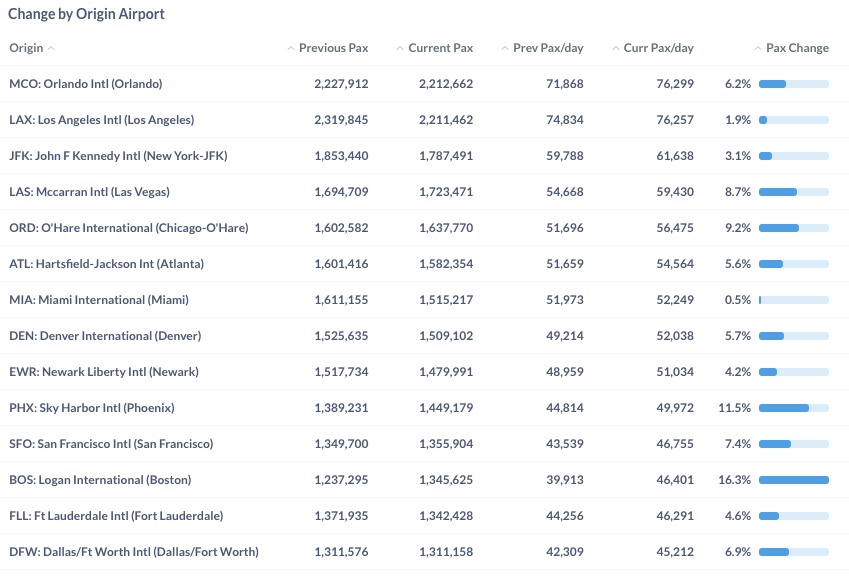
Figure 5: Air Traffic by Top Origin Airports in January 2024 (Previous) vs. February 2024 (Current)
Year Over Year Comparison
The year-over-year comparison from February 2023 to February 2024 demonstrates a generally positive growth trend across major US airlines. United Airlines (UA), Frontier Airlines (F9), and Delta Air Lines (DL) led this upward trajectory with strong growth rates of 14.7%, 12.0%, and 11.2%, respectively, highlighting their substantial impact on the industry’s positive momentum. Meanwhile, Southwest Airlines (WN) and Allegiant Air (G4) experienced more modest growth (3%) and even a loss (-0.5%), compared to the previous year.
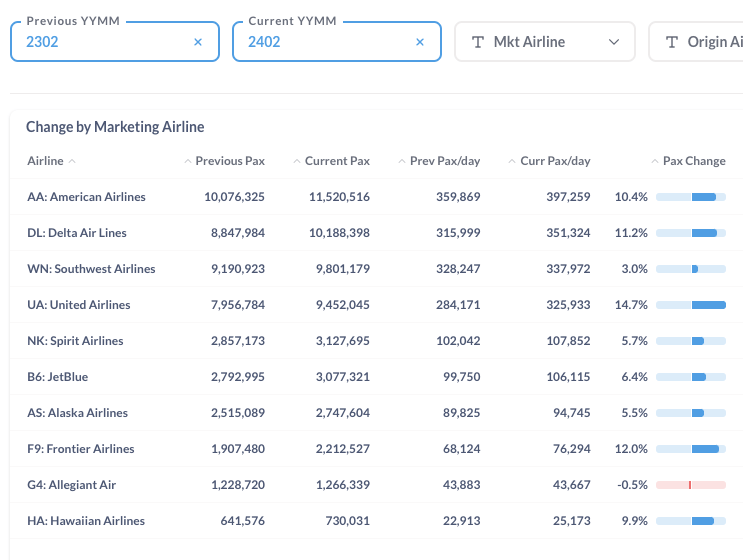
Figure 6: Air Traffic by Dominant Marketing Airlines in February 2024 (Current) vs. February 2023 (Previous)
Between February 2023 and February 2024, the majority of major airports witnessed a rise in traffic. Leading this year-over-year growth were Dallas/Fort Worth (DFW), John F. Kennedy (JFK) in New York, and Miami (MIA), which experienced significant expansions with traffic increases of 19.0%, 18.6%, and 18.4%, respectively. Meanwhile, Denver (DEN) and Las Vegas (LAS) saw more moderate growth rates at 2.4% and 2.1%, respectively.
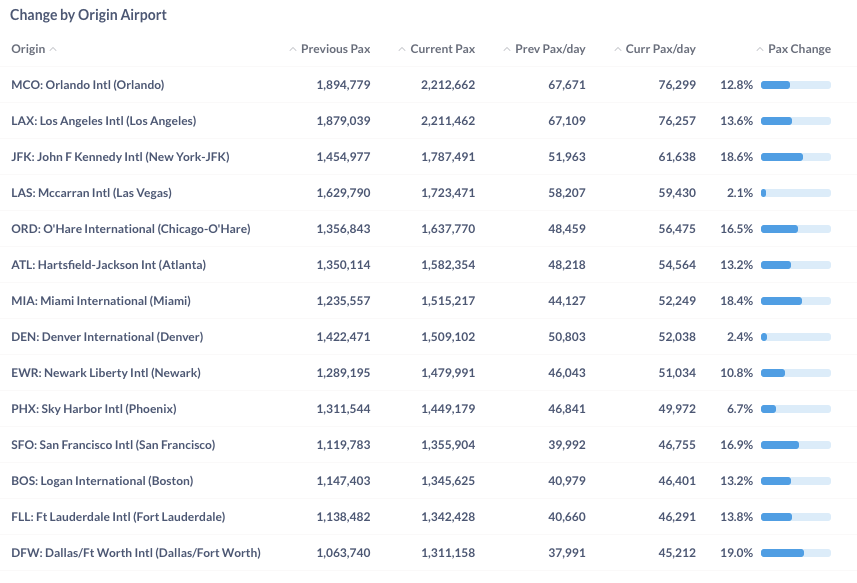
Figure 7: Air Traffic by Top Origin Airport in February 2024 (Current) vs. February 2023 (Previous)
For more detailed information on traffic and fares by route and airline, please contact service@flightbi.com or request a demo of Fligence USOD. They will be able to provide you with customized information to meet your specific needs and requirements.