The US BizAv (Business Aviation) market has been booming since March 2021. This series of articles track the traffic trend of this market. We define the BizAv market as part-135 on-demand for-hire private flying by business jets or certain turboprop planes. The numbers in the following charts exclude part-91 private flights. If you are interested in all flights by business jets, or detailed flights by route and operator, please get in touch with us.
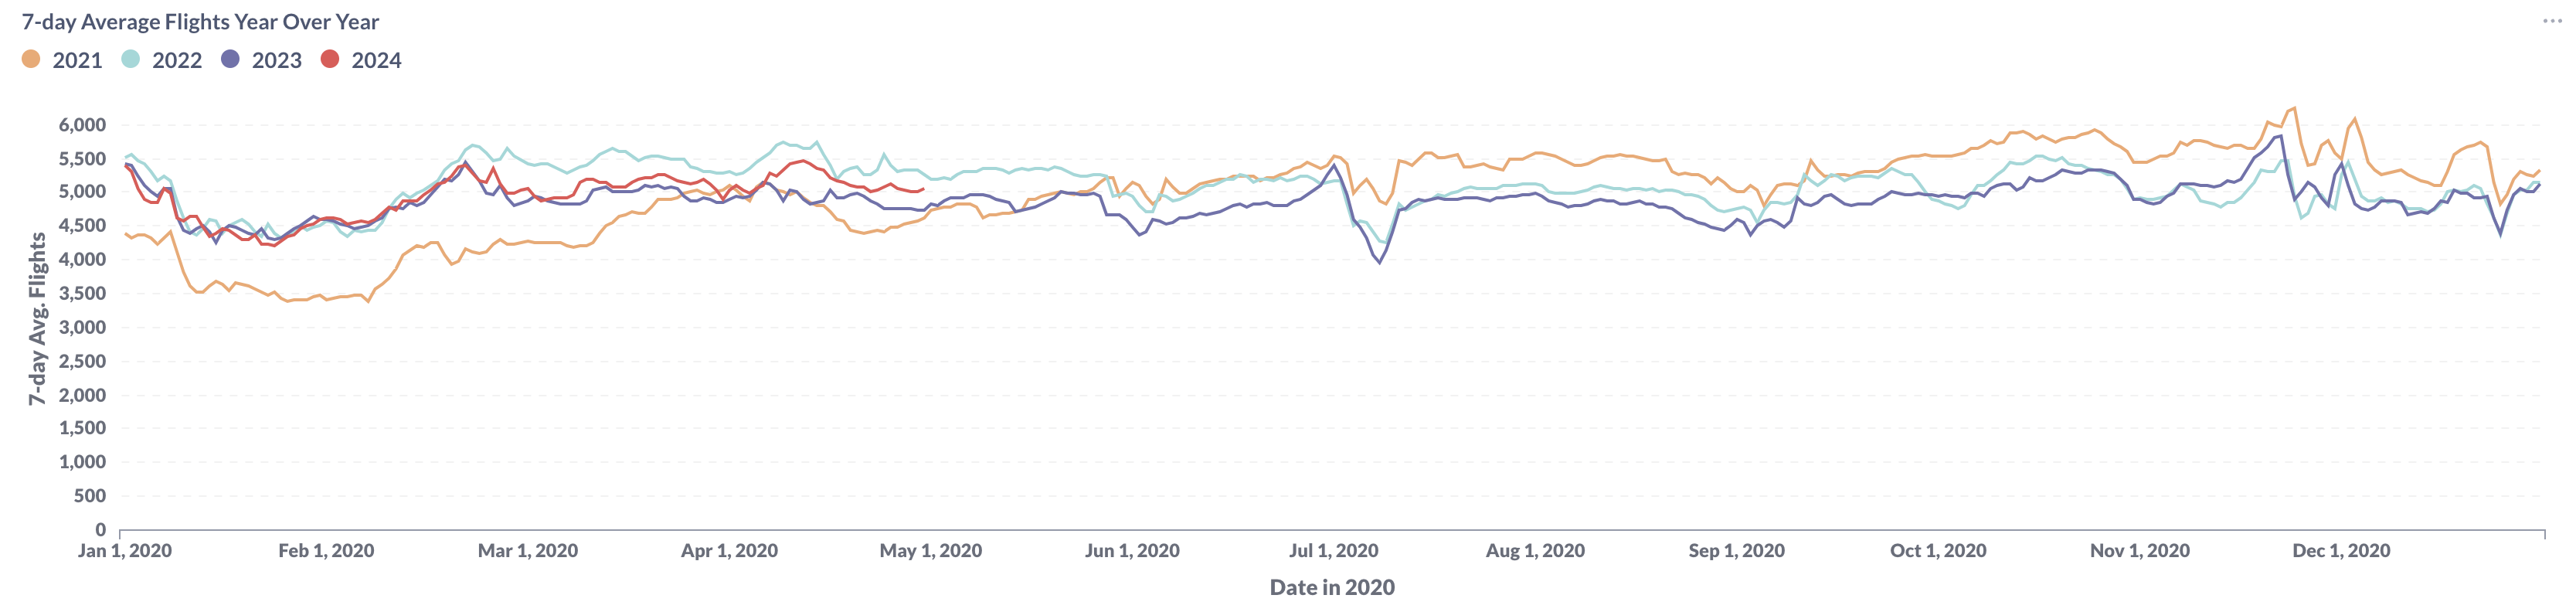
Figure 1: Year over Year Trend of the U.S. BizAv Market
Figure 1 depicts the trends in U.S. Business Aviation (BizAv) traffic from January 2021 to April 2024. By April 2024, the flight activity trend had positioned itself between the curves of 2022 and 2023, showing a slight decline from the start to the end of April 2024.
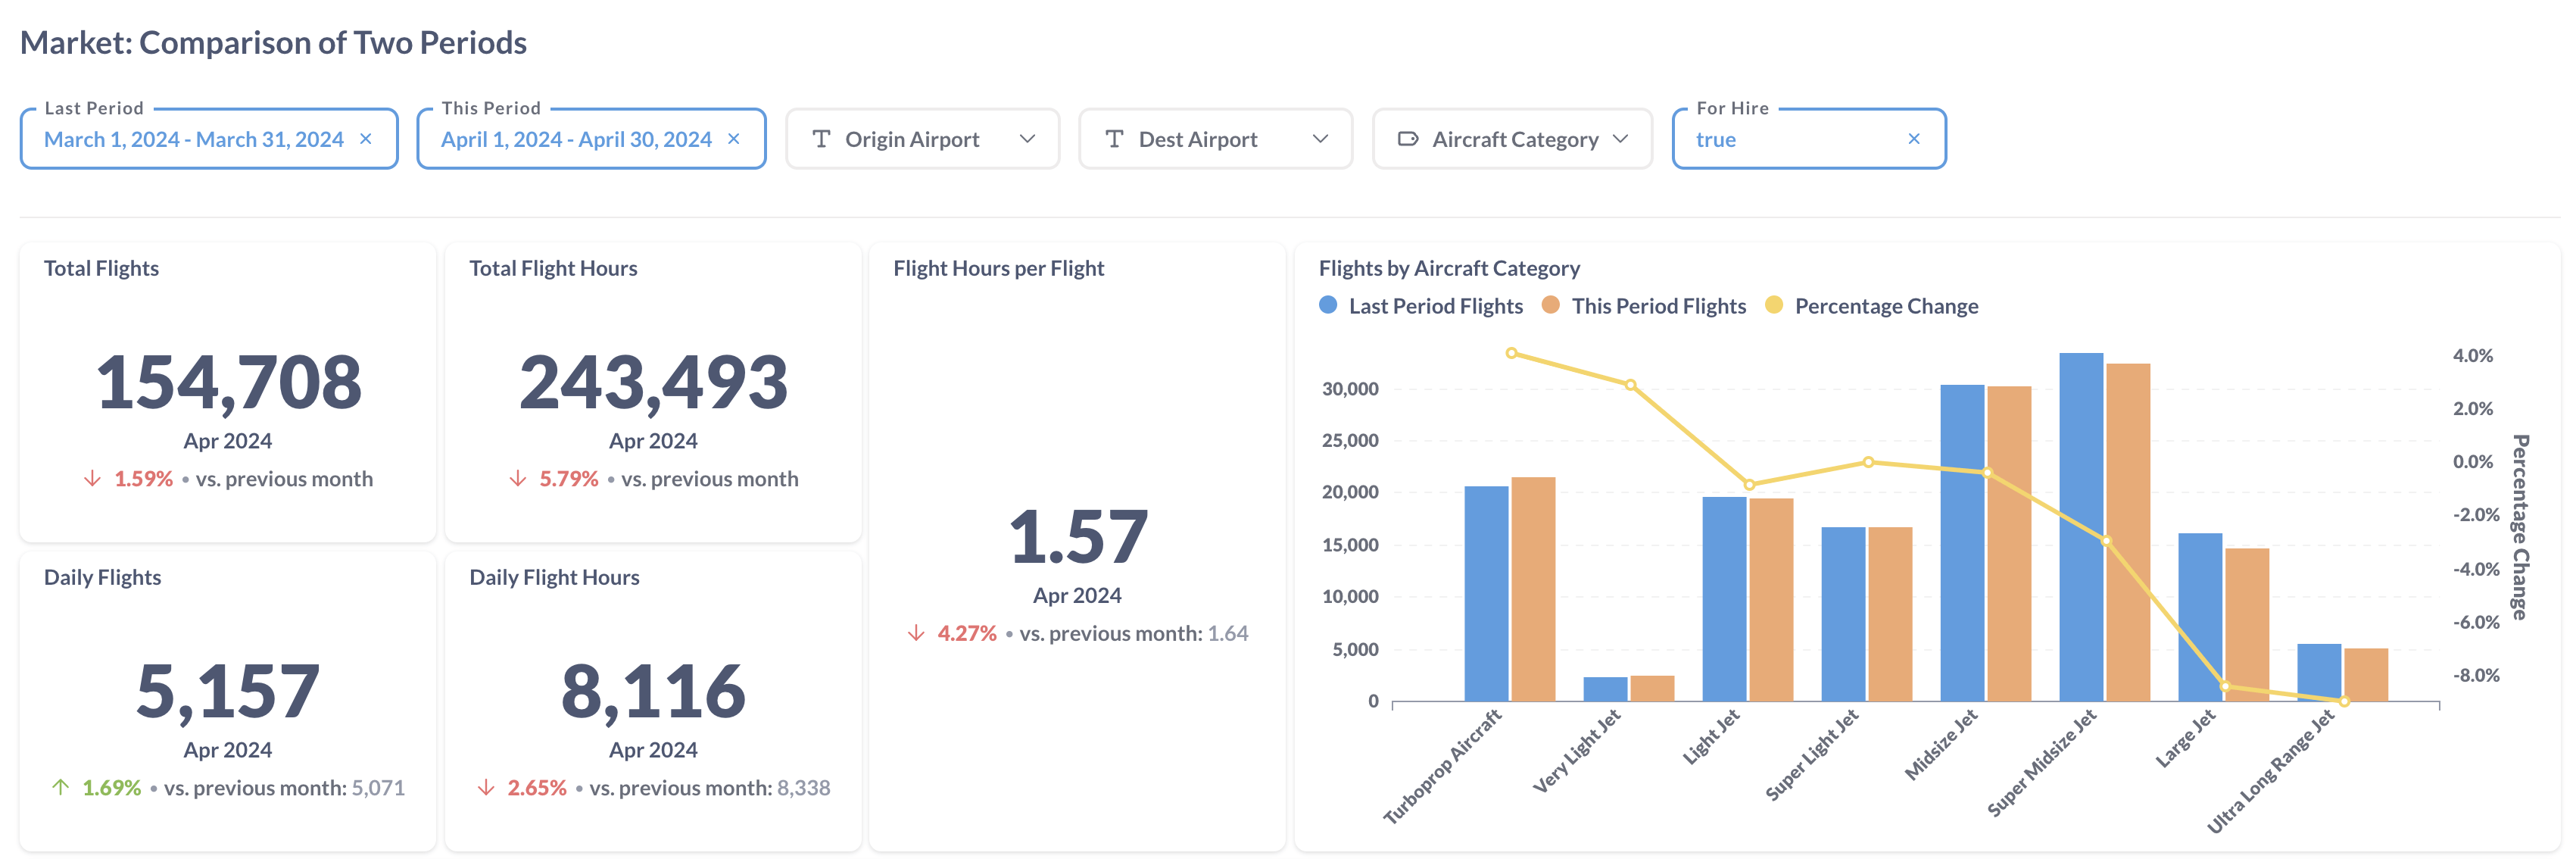
Figure 2: Comparison of the U.S. BizAv Flights This Month vs. Last Month
Figure 2 provides a comparative analysis of flight data for March 2024 and April 2024, showing a 1.69% increase in daily flight frequency. However, daily flight hours decreased by 2.65%, mainly due to reduced average flight duration per departure. This decline in average flight duration was driven by a decrease in flight activities for Large Jets and Ultra Long Range Jets, which fell by 8.4% and 9.0%, respectively.
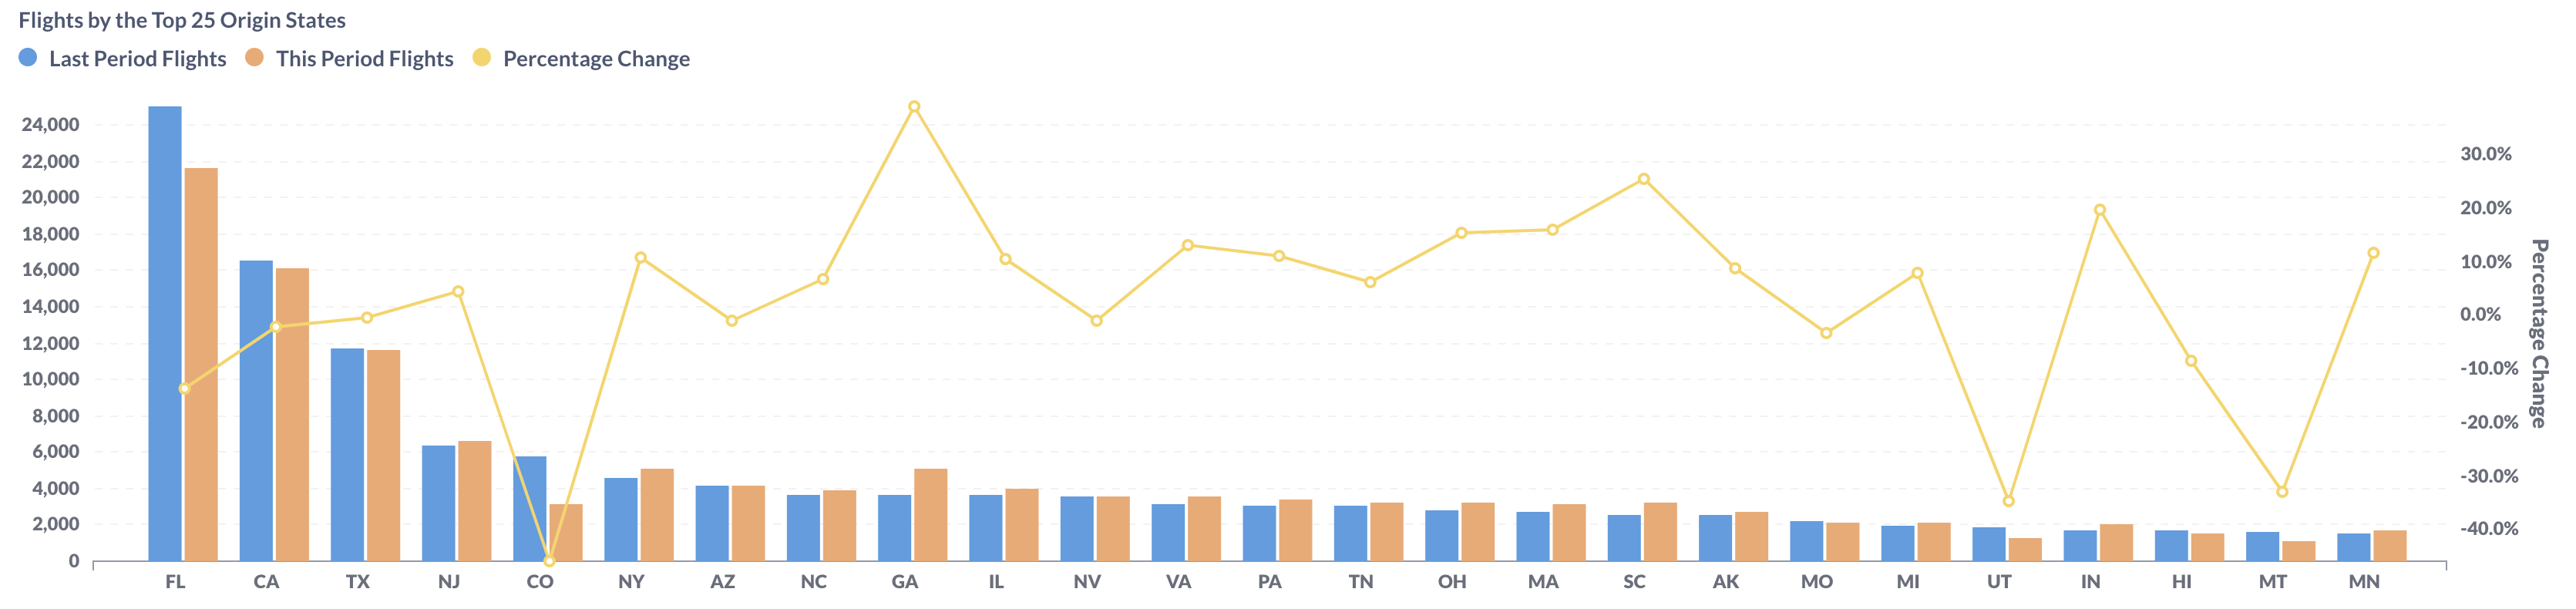
Figure 3: Comparison of the U.S. BizAv Flights by the Top 25 Origin States (This Month vs. Last Month)
During March 2024 and April 2024, business aviation activity fluctuated across various U.S. states. The top three states—Florida (FL), California (CA), and Texas (TX)—experienced declines of 13.7%, 2.2%, and 0.5%, respectively. Notably, Colorado (CO) saw the most significant decline, while Georgia (GA) achieved the highest growth among the top 25 states.
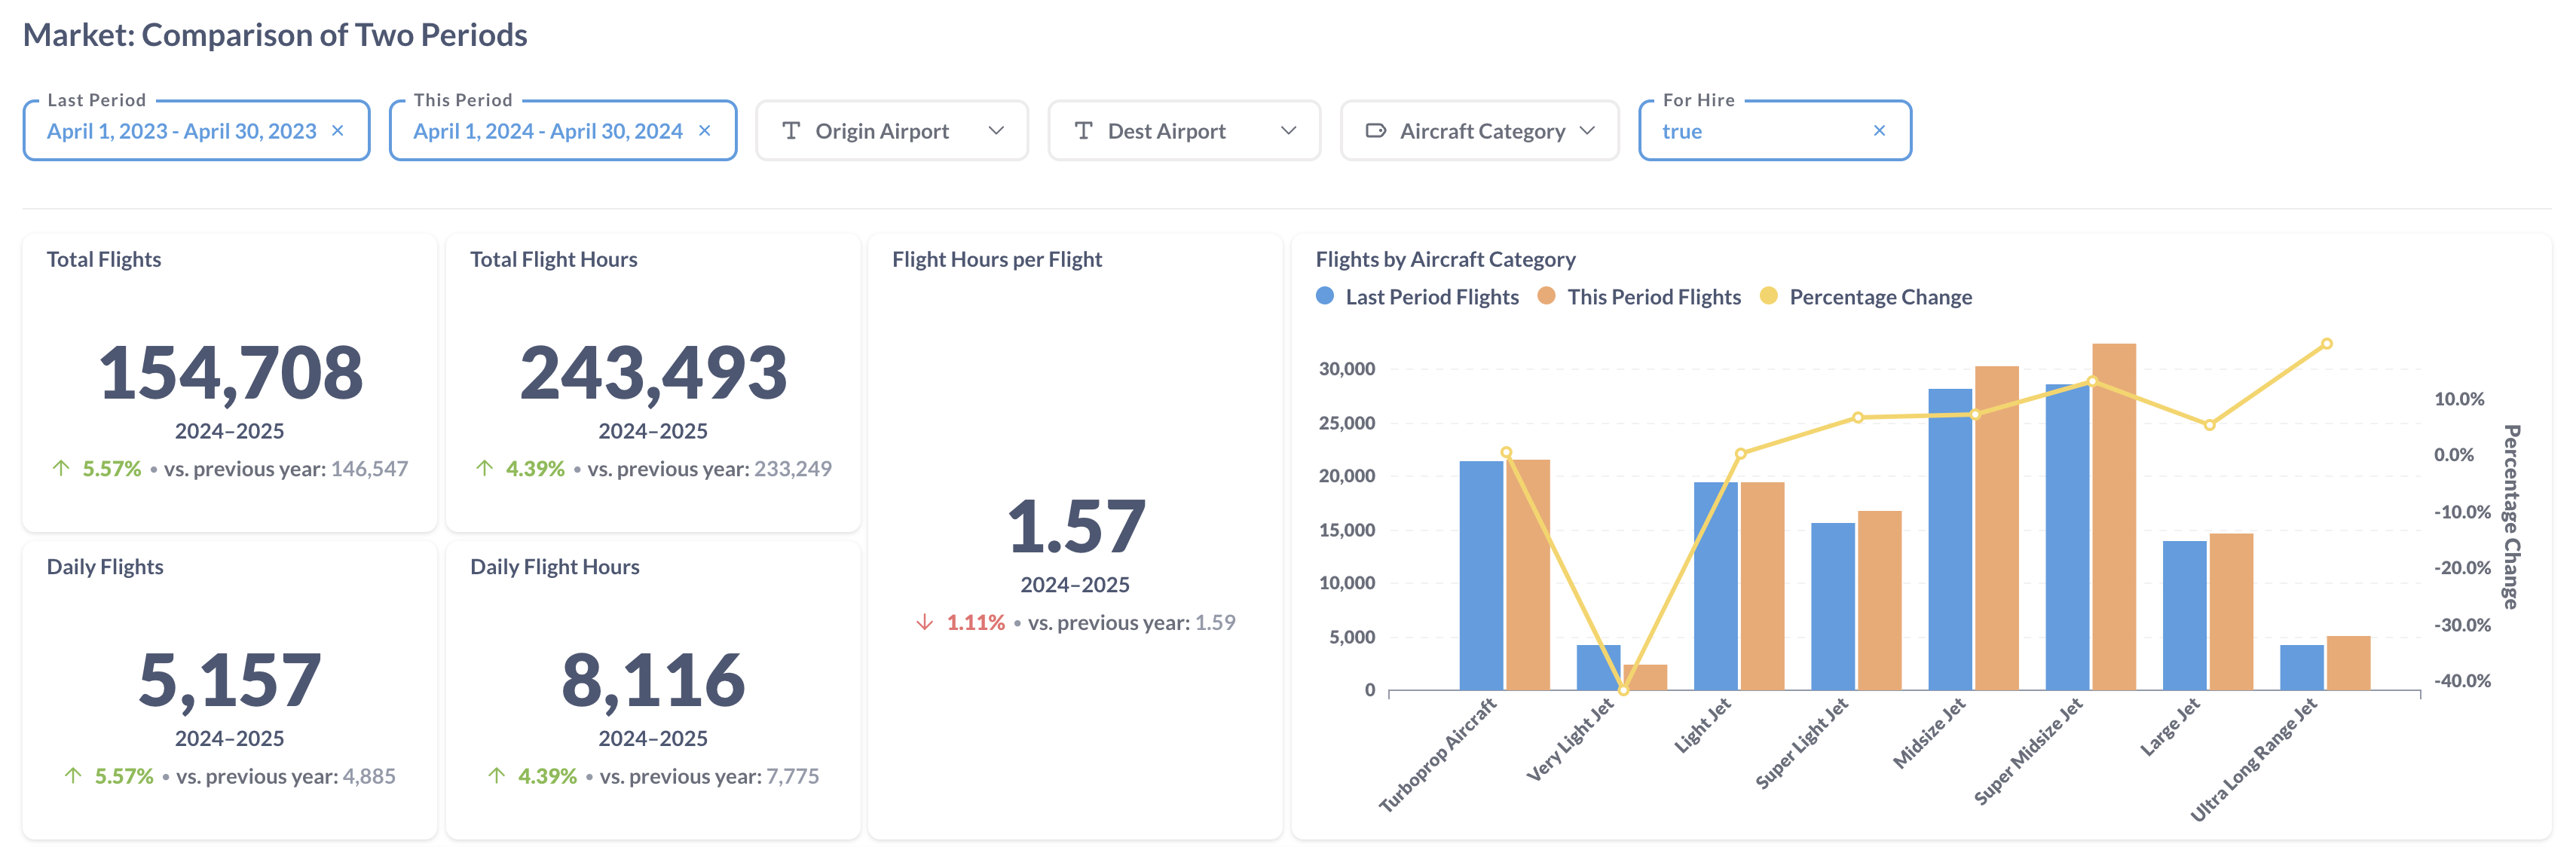
Figure 4: Comparison of the U.S. BizAv Flights This Year vs. Last Year
In April of this year, there was a 5.57% increase in the number of flights and a 4.39% rise in daily flight hours compared to April 2023. This increase can be attributed to a 1.11% decrease in average flight hours per flight. Notably, Very Light Jets saw a substantial decline of 41.6%. Conversely, larger aircraft categories such as Super Midsize Jets, Large Jets, and Ultra Long Range Jets experienced increases, with Ultra Long Range Jets setting a record growth of 19.7%.
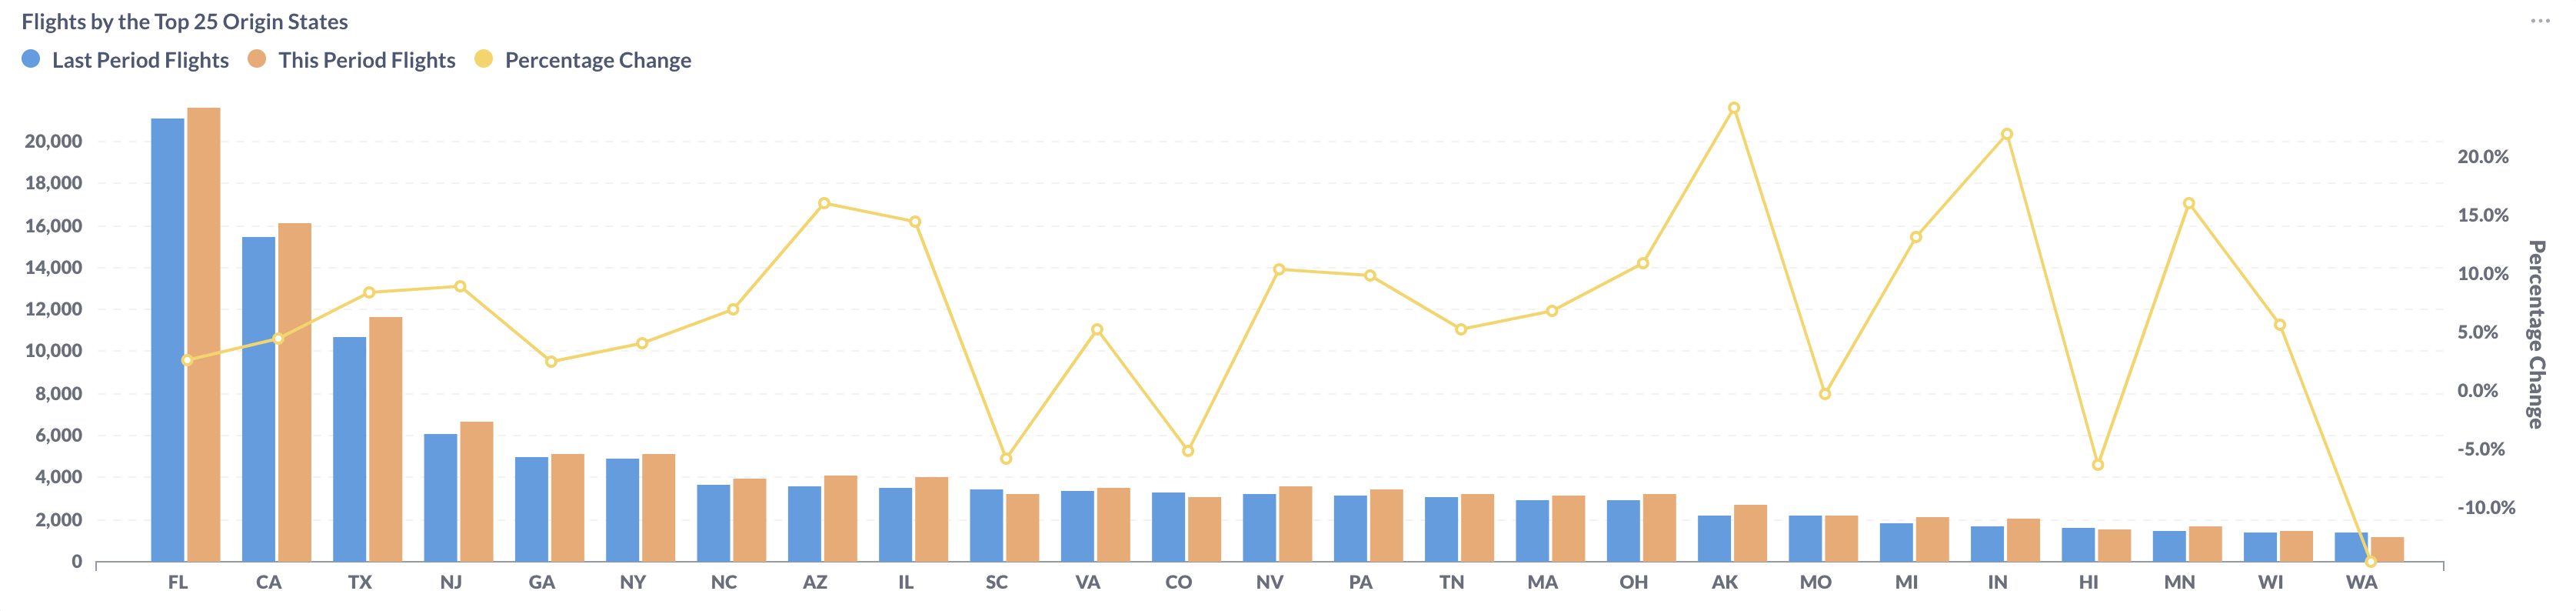
Figure 5: Comparison of the U.S. BizAv Flights by the Top 25 Origin States (This Year vs. Last Year)
When comparing flight data from April 2023 to April 2024, most larger states saw an increase in total flight activity. Florida (FL), California (CA), and Texas (TX), the top three states by activity, all showed growth in their flight operations, with growth rates of 2.6%, 4.4%, and 8.4%, respectively. However, South Carolina (SC) and Colorado (CO) experienced declines of 5.8% and 5.2%, respectively.