Overall air traffic was down from October, but the average airfare increased again. The preliminary true O&D level data released by FlightBI this week shows that US domestic passenger volume dropped from October 2022 to November 2022 by 5% while the average airfare increased by 5%.
Volume Trend
US domestic traffic by true O&D decreased from 50.8 million passengers in October to 48.3 million in November, which is still higher than the pre-pandemic level of 47.3M million in November 2019! The US international traffic also decreased from 16.3 million in October to 15.7 million in November, but the average daily traffic barely changed.
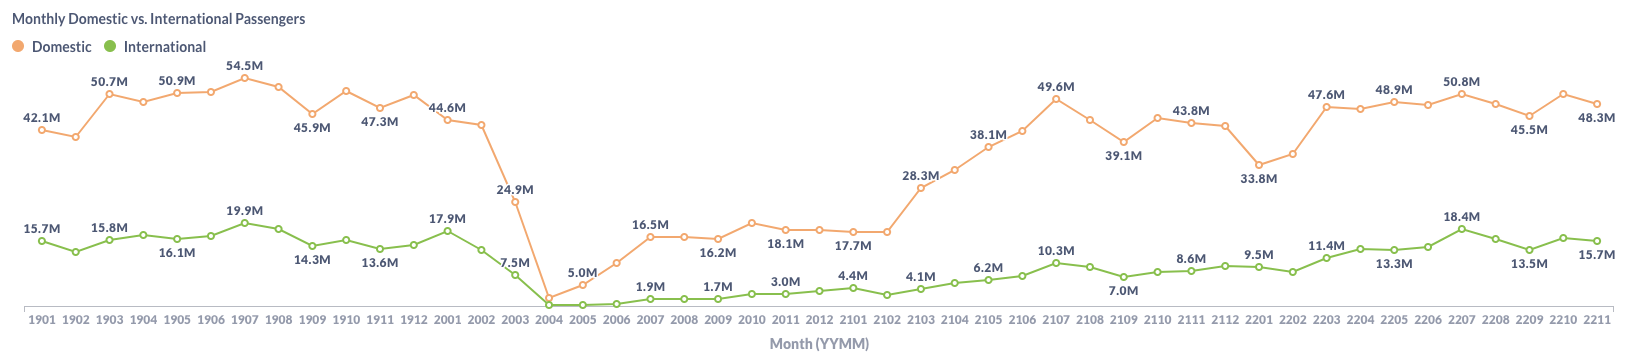
Figure 1: US Domestic and International Air Traffic by Month
Airfare Trend
The average domestic gross fare was up from $208 in October to $219 in November. The average net fare increased from $179 to $188 over the same period.
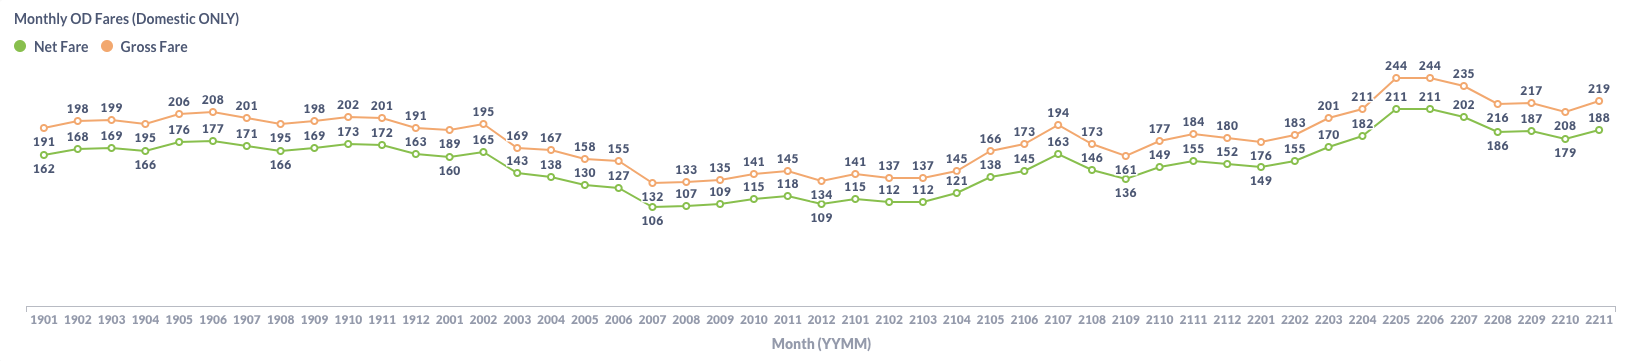
Figure 2: US Domestic Average Airfare by Month
The increased Airfare is not driven by Fuel prices anymore. As shown in the chart below provided by EIA, the US jet fuel price went down in November. It seems that airlines just want to keep more profit in their pocket when 2022 is wrapping up.
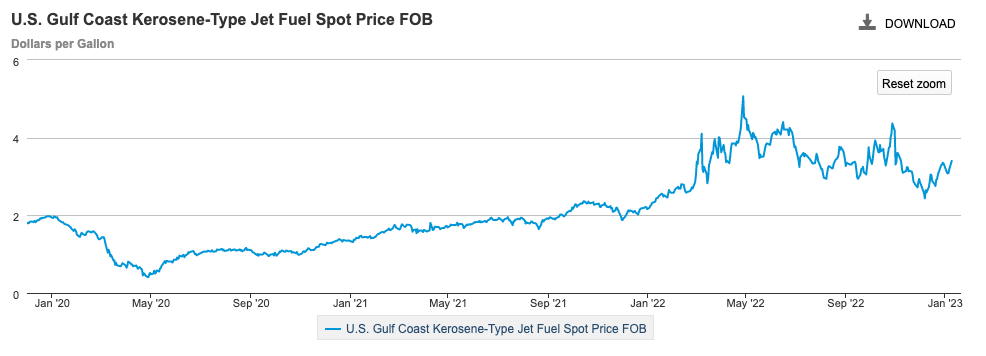
Figure 3: US Jet Fuel Price
Load Factor Trend
The average load factor in November was 80.0%, slightly lower than October’s 81.4%. As shown in Figure 4 below, both traffic and capacity decreased in November, but the traffic declined faster than the capacity.
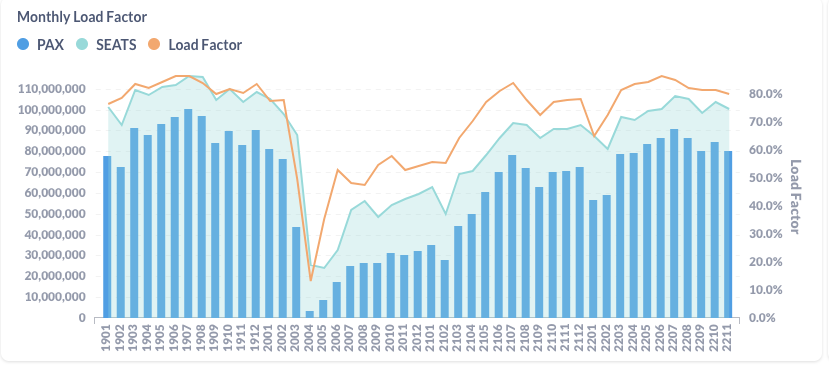
Figure 4: US Airlines’ Average Load Factor by Month
Month Over Month Comparison
From October to November, Hawaiian(HA) gained 18.3% of traffic per day. JetBlue(B6) and Southwest(WN) also had some growth. All other major US airlines carried fewer passengers per day in November than the previous month. Among them, Spirit(NK), Frontier(F9), and American(AA) lost more than 5% of daily traffic.
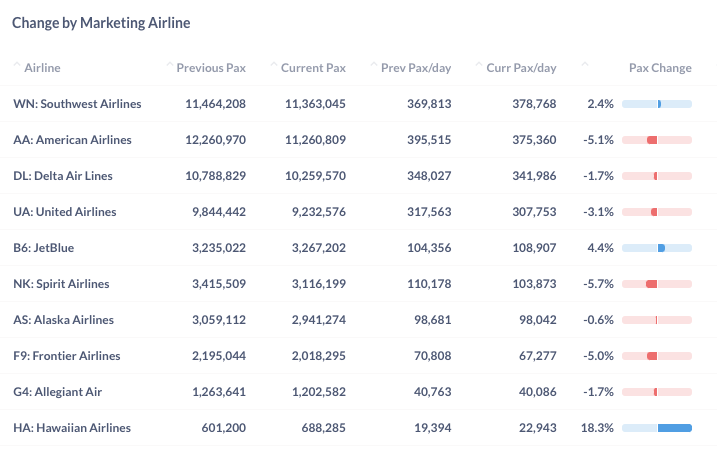
Figure 5: Air Traffic by Dominant Marketing Airlines in November 2022 (Current) vs. October 2022 (Previous)
Most top airports saw less traffic in November than in October. Las Vegas(LAS) and Boston (BOS) had a 10.3% and 9.4% decrease. But Los Angeles (LAX) and Orlando (MCO) sent out more daily passengers in November.
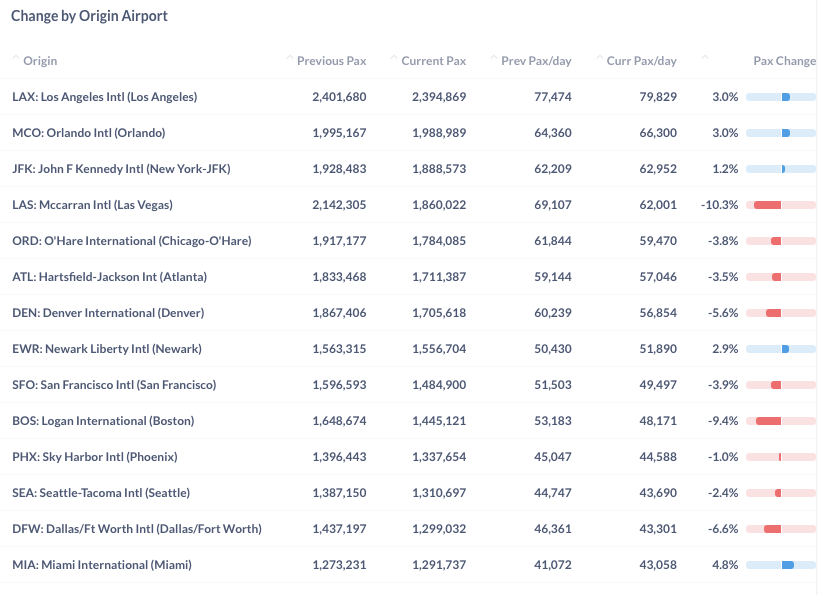
Figure 6: Air Traffic by Top Origin Airports in November 2022 (Current) vs. October 2022 (Previous)
Year Over Year Comparison
Compared to the same month last year, all major US airlines had achieved substantial growth. Frontier(F9), Spirit(NK), and Hawaiian(HA) led with a year-over-year growth rate of 28.8%, 25.9% and 23.1%, respectively. But the largest legacy carrier American(AA) only grew its daily traffic by 3.6%.
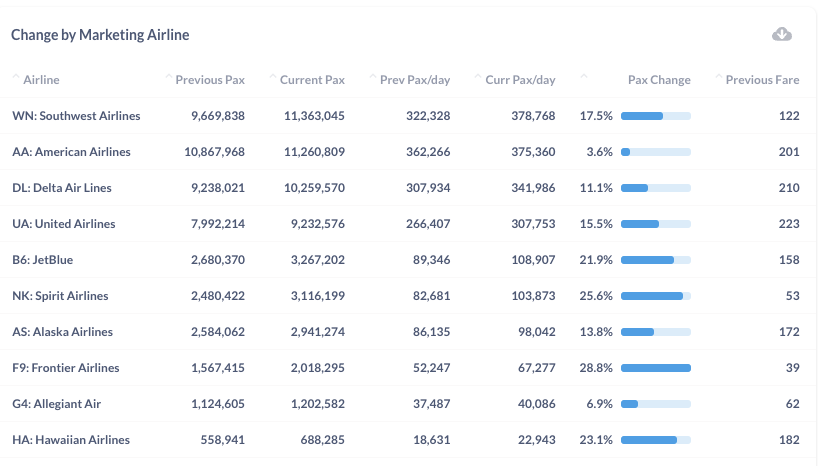
Figure 7: Air Traffic by Dominant Marketing Airlines in November 2022 (Current) vs. November 2021 (Previous)
Growth by top airports is still very good. New York’s JFK airport led the year-over-year growth with 41.2%. San Francisco (SFO) and Boston (BOS) also kept the momentum and generated 34.5% and 30.9% more passengers than last year. Among the top airports, Phoenix (PHX) has the smallest growth of 4.4% because it has more domestic traffic portion than most other large airports.
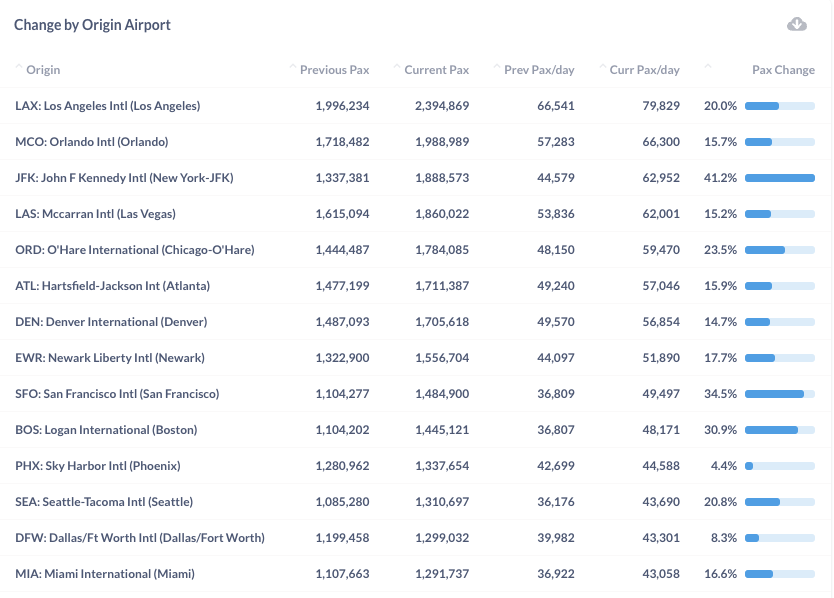
Figure 8: Air Traffic by Top Origin Airport in November 2022 (Current) vs. November 2021 (Previous)
For more granular traffic and fare information by route and airline, please get in touch with service@flightbi.com or request a demo of Fligence USOD.