The US BizAv (Business Aviation) market has been booming since March 2021. This series of articles track the traffic trend of this market.
We define the BizAv market as part-135 on-demand for-hire private flying by business jets or certain turboprop planes. The numbers in the following charts exclude part-91 private flights. If you are interested in all flights by business jets, or detailed flights by route and operator, please get in touch with support@flightbi.com.
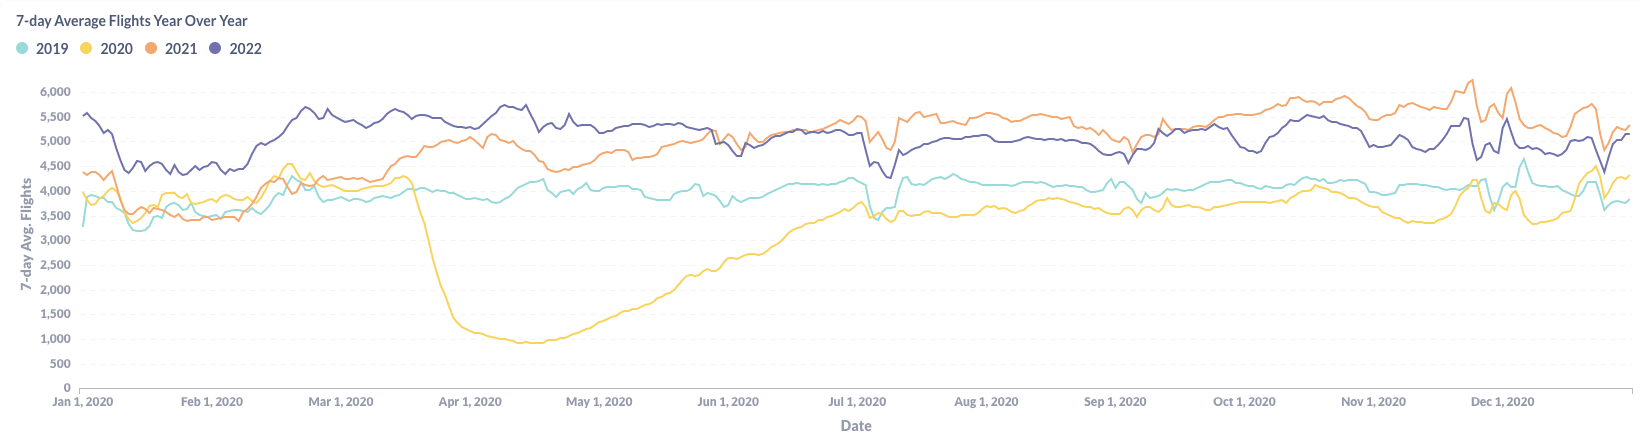
Figure 1: Year over Year Trend of the U.S. BizAv Market
As shown in Figure 1, the U.S. BizAv traffic in December 2022 followed the same pattern as last year – the curve went up before Christmas, dropped during Christmas, and then rebounded. Different from commercial air, the BizAv sector has not been impacted much by the bad weather during Christmas week. The flight gap between 2022 and 2021 shrank at the end of December.
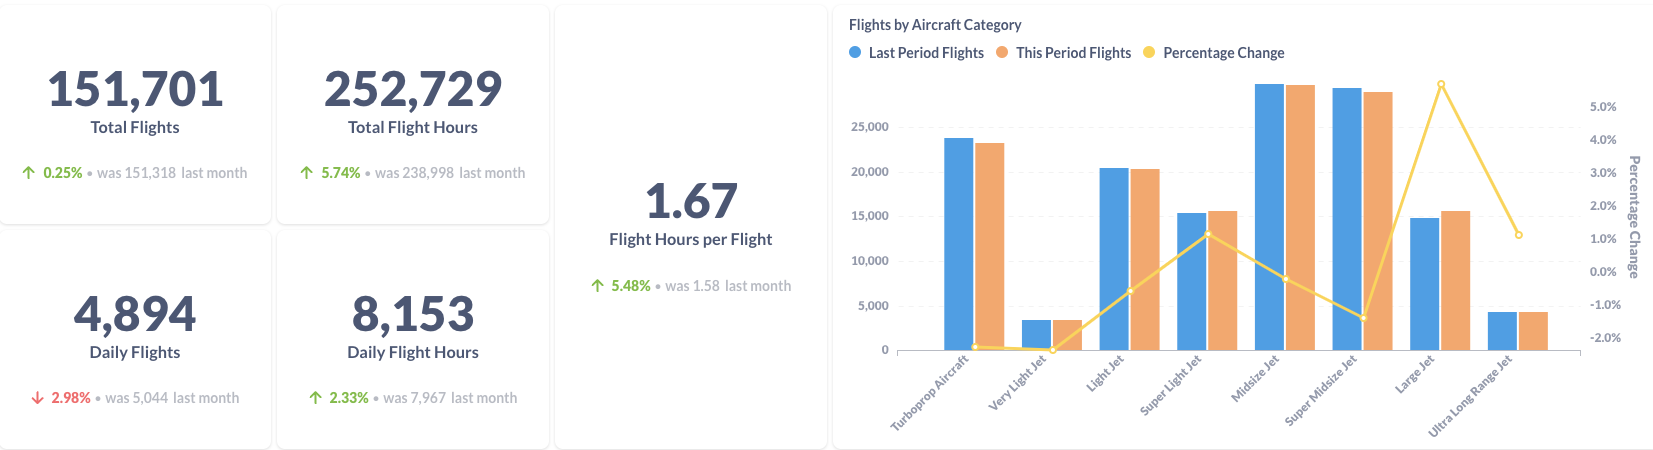
Figure 2: Comparison of the U.S. BizAv Flights This Month vs. Last Month
Figure 2 is a comparison between December 2022 and November 2022. The average daily flights decreased by 3%, although total flights increased by 0.25% because there is one more day in December. However, the flight hours per flight increased by 5.5%, leading to a 2.3% increase in daily flight hours. The contribution was primarily from Large Jet, which usually have a longer flight range than smaller jets and turboprops.
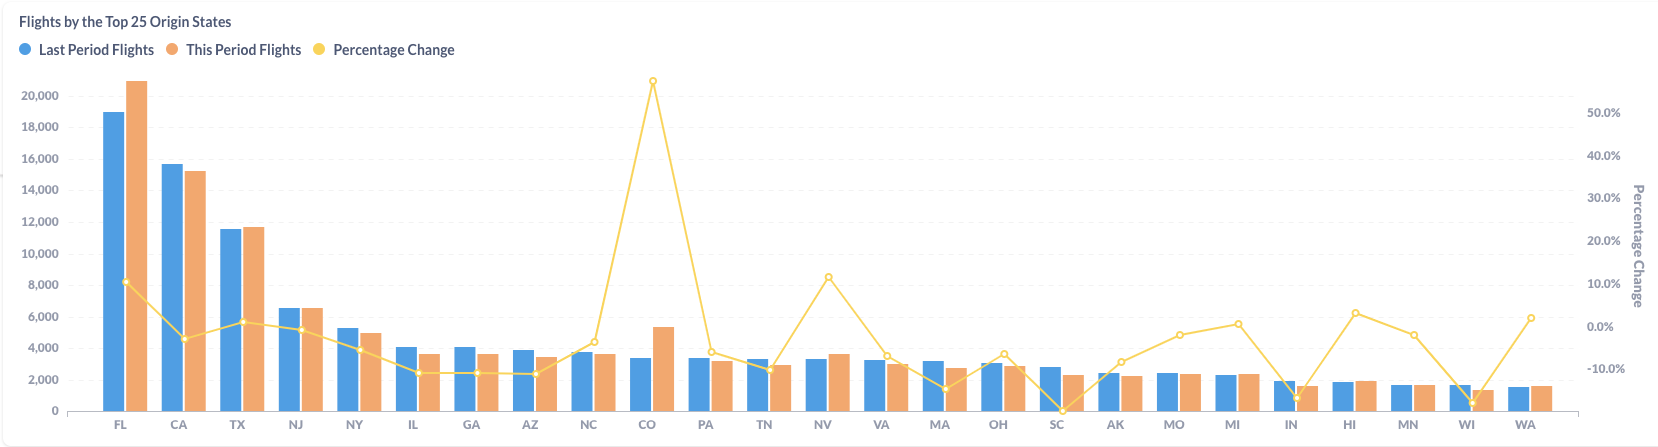
Figure 3: Comparison of the U.S. BizAv Flights by the Top 25 Origin States (This Month vs. Last Month)
In terms of Origin state, Florida(FL) and Colorado(CO) achieved the highest growth (10.4% and 57.4%, respectively) because many BizAv customers chose to spend the winter in warm Florida or to ski in Colorado. California (CA) decreased by 2.9% and New York(NY) dropped by 5.4%.
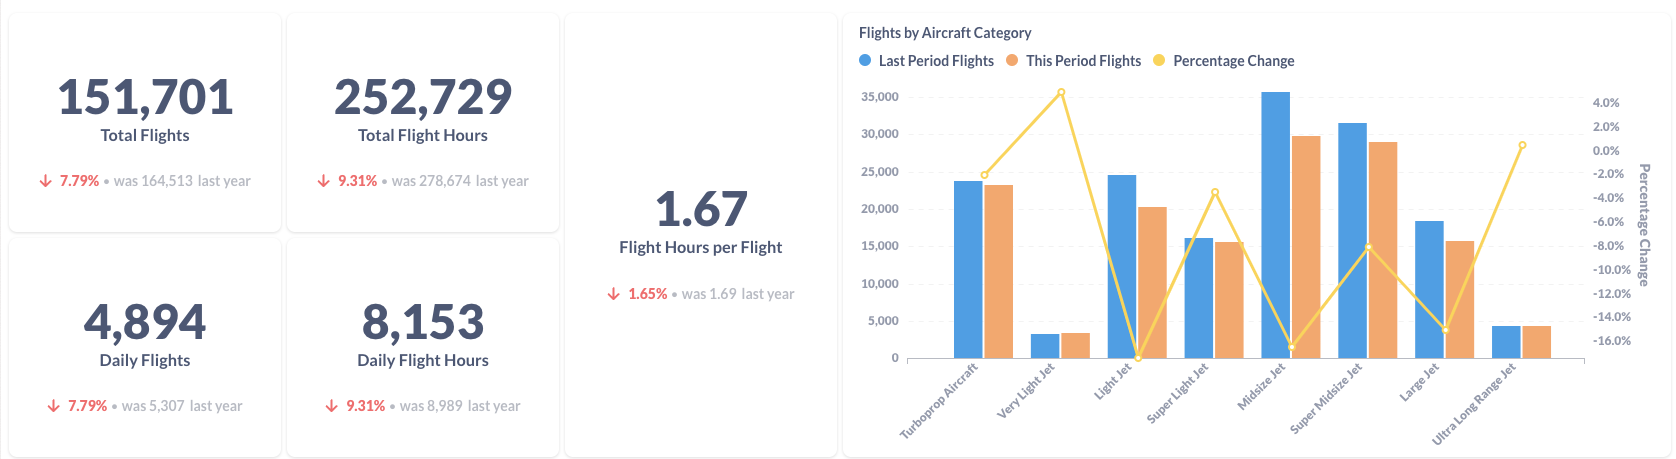
Figure 4: Comparison of the U.S. BizAv Flights This Year vs. Last Year
Compared to December last year, total business flights decreased by 7.8%. Total flight hours dropped by 9.3% because the average flight hours per flight also shrank by 1.7%. Although the smallest categories – Very Light Jets and Ultra Long Range Jet – achieved positive growth, all other aircraft types are in the negative zone. However, the year-over-year decrease slowed down in December from November.
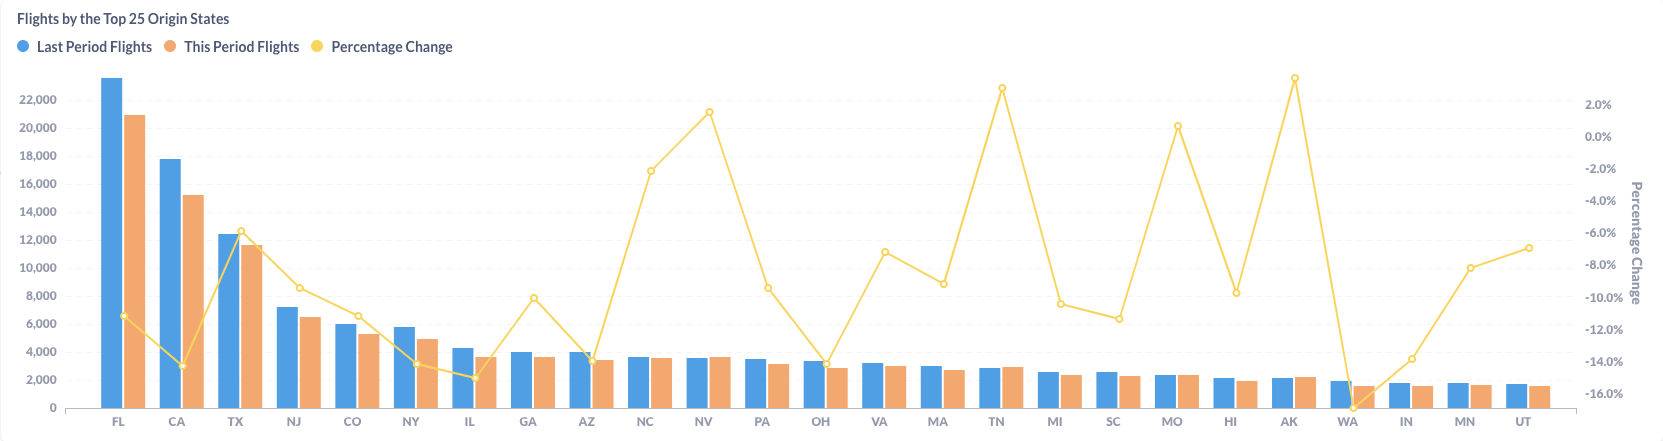
Figure 5: Comparison of the U.S. BizAv Flights by the Top 25 Origin States (This Year vs. Last Year)
The flight contraction happened in most of the Origin States. NV, TN, MO, and AK managed to achieve positive growth from the last year, but the growth rates are very small. On the opposite side, the decrease in FL, CA, and IL is between 11% and 15%. Some large cities had big losses from the same month last year. For example, Los Angeles (KVNY) dropped 25.5% from December 2021 to December 2022.