The US BizAv (Business Aviation) market has gone through a booming period since March 2021. This series of articles track the traffic trend of this market.
We define the BizAv market as part-135 on-demand for-hire private flying by business jets or certain turboprop planes. The numbers in the following charts exclude part-91 private flights. If you are interested in all flights by business jets, please contact support@flightbi.com.
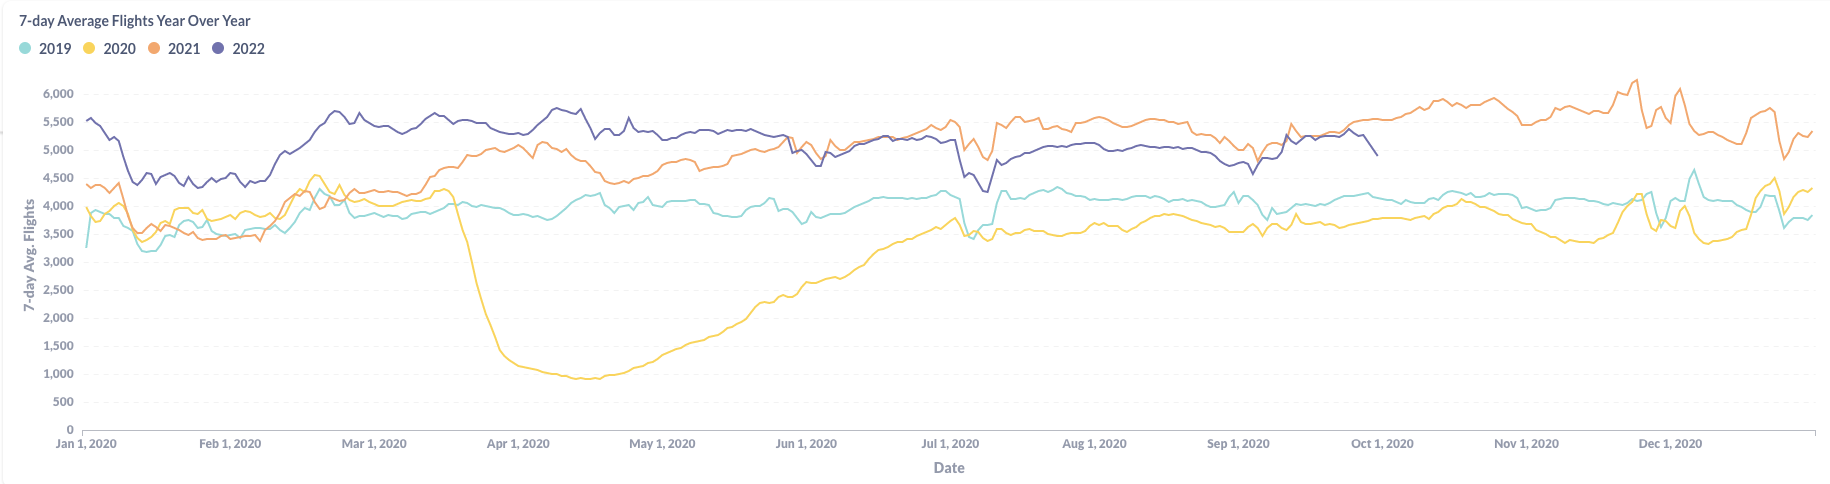
Figure 1: Year over Year Trend of the U.S. BizAv Market
As shown in Figure 1, the U.S. BizAv traffic went up at the beginning of September 2022 but dropped at the end. It has reached the 2021 level after a relatively calm summer, although the decrease in the last several days enlarged the gap again. The overall level is still higher than the pre-pandemic level.
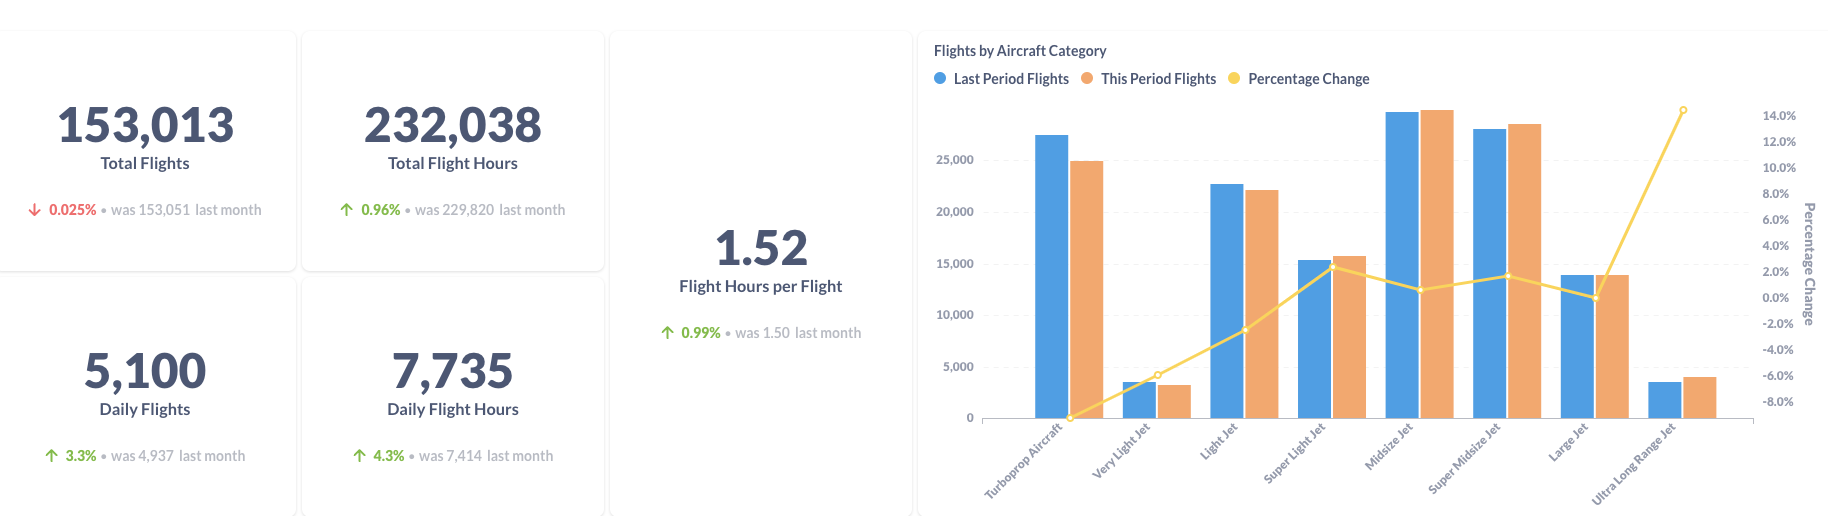
Figure 2: Comparison of the U.S. BizAv Flights This Month vs. Last Month
Figure 2 is a comparison between September 2022 and August 2022. The total traffic decreased by 2.5%, primarily because September has one day less than August. The average daily traffic increased by 3.3%. Both total flight hours and daily flight hours have increased, thanks to the contribution from the Ultra Long Range Jet. As a result, the average flight length slightly increased to 1.52 hours per flight.
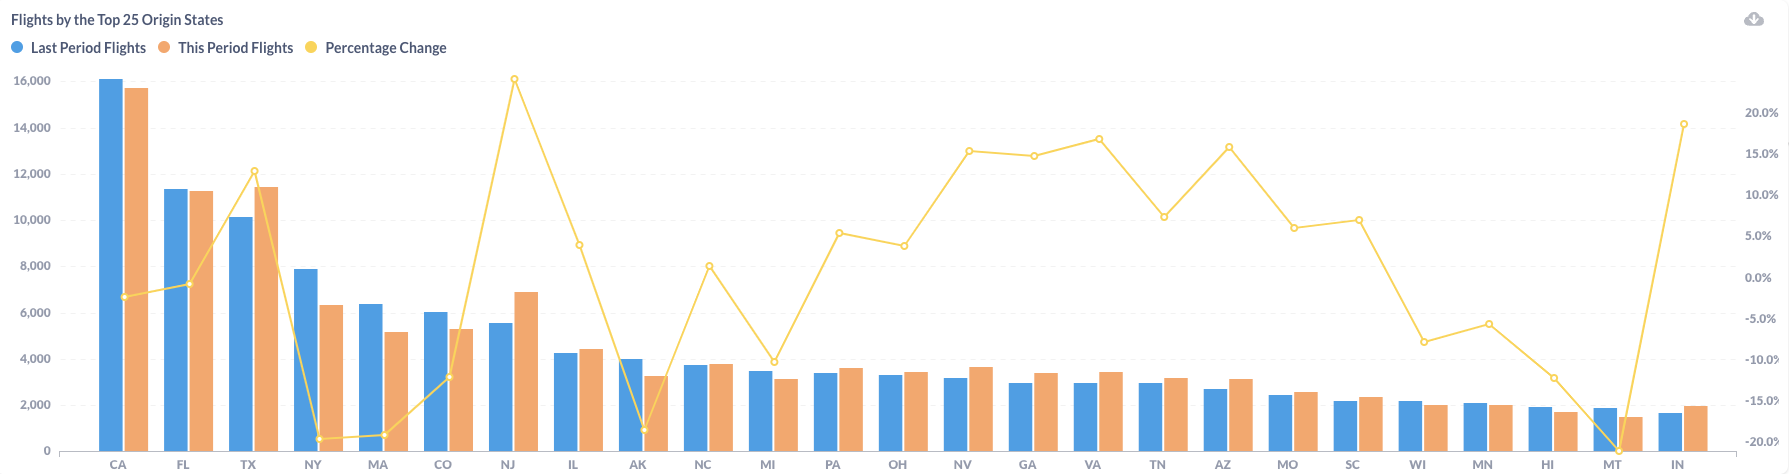
Figure 3: Comparison of the U.S. BizAv Flights by the Top 25 Origin States (This Month vs. Last Month)
Among the top 3 states – California(CA), Florida(FL), and Texas(TX), Texas is the star of September. It increased traffic by 13% month to month and won the 2nd place title held by Florida in the previous months. Another fast-growing state is New Jersey(NJ), where the Teterboro (KTEB) airport is located. The traffic is from New York City and the month-to-month growth of 52.3% is stunning.
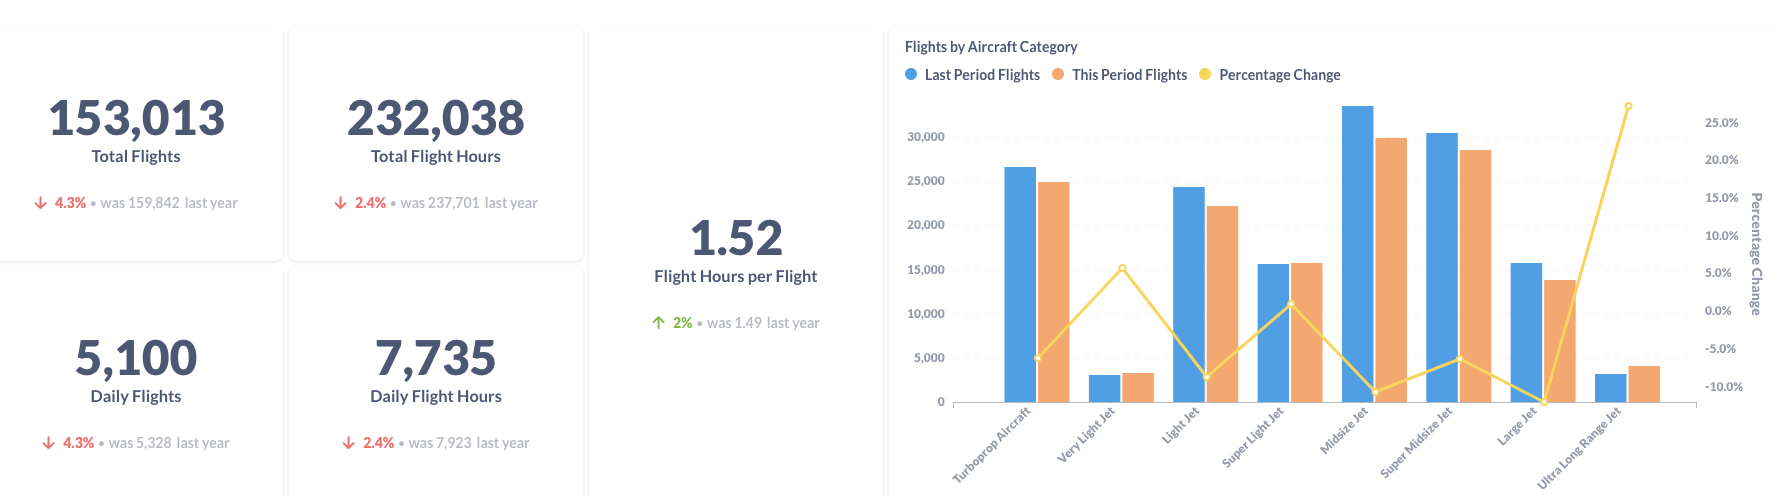
Figure 4: Comparison of the U.S. BizAv Flights This Year vs. Last Year
Compared to September last year, total business flights decreased by 4.3%. The average flight hours per flight increased by 2%. Therefore the total flight hours decreased by 2.4% from last year. Only Very Light Jet and Ultra Long Range Jet have significantly more flights than last year, but the total size of those two categories is very small.
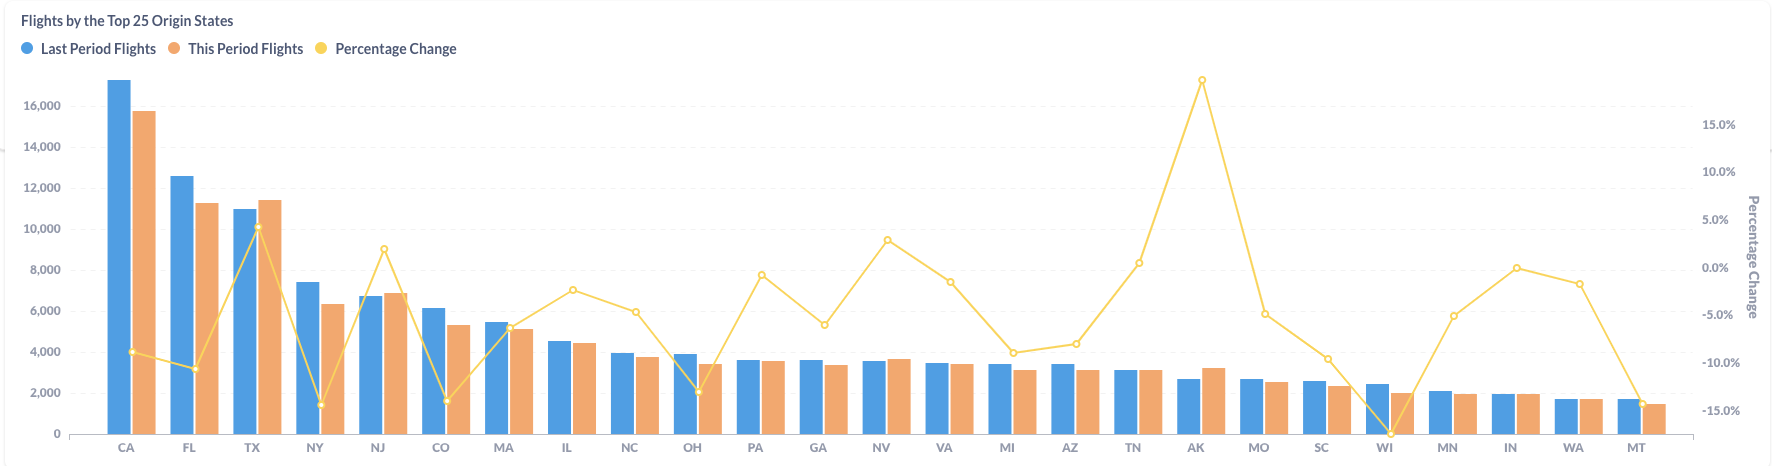
Figure 5: Comparison of the U.S. BizAv Flights by the Top 25 Origin States (This Year vs. Last Year)
Most origin states had a decrease in business flights from last year. California (CA) decreased by 8.9%, and Florida (FL) decreased by 10.6%. However, Texas (TX), New Jersey (NJ), and Alaska (AK) achieved growth from last year.