The average airfares declined in July 2022! The preliminary true O&D level data released by FlightBI today shows that passenger volume increased moderately from June 2022 to July 2022, but the average airfare has decreased by almost 10%.
Volume Trend
US domestic traffic by true O&D increased from 50.1 million passengers in June to 51.6 million in July, which is still below the pre-pandemic level of 54.5 million in July 2019. Given that there is 1 more day in July than June, the daily traffic barely changed. However, the US international traffic grew from 17.8 million in June to 20.0 million in July.
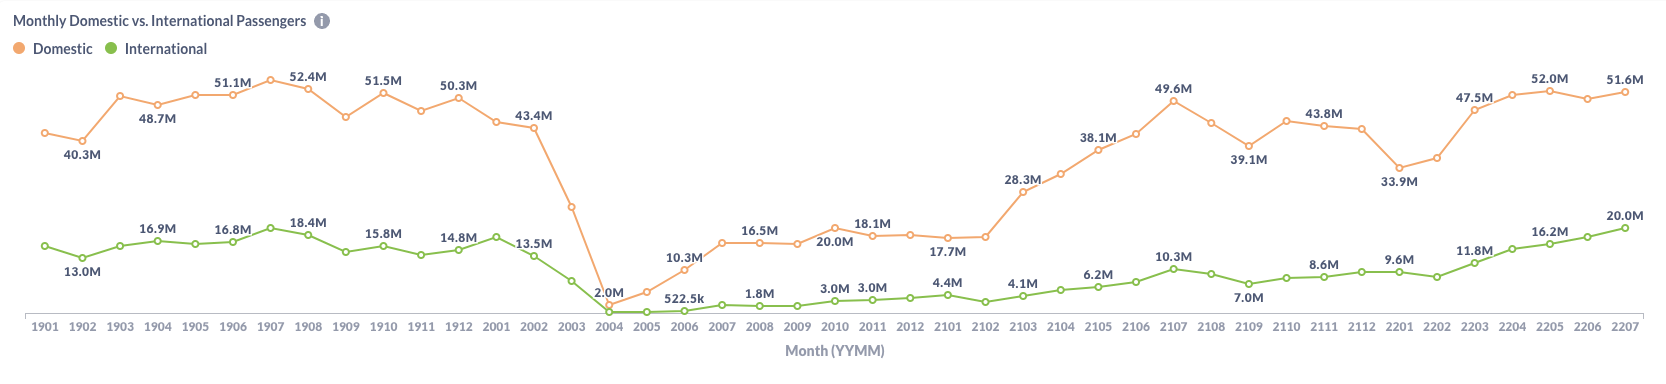
Figure 1: US Domestic and International Air Traffic by Month
Airfare Trend
Both gross fares and net fares decreased about 10% from June. The domestic average gross fare was reduced from $283 in June to $256 in July. Similarly, the average net fare dropped from $240 to $217.
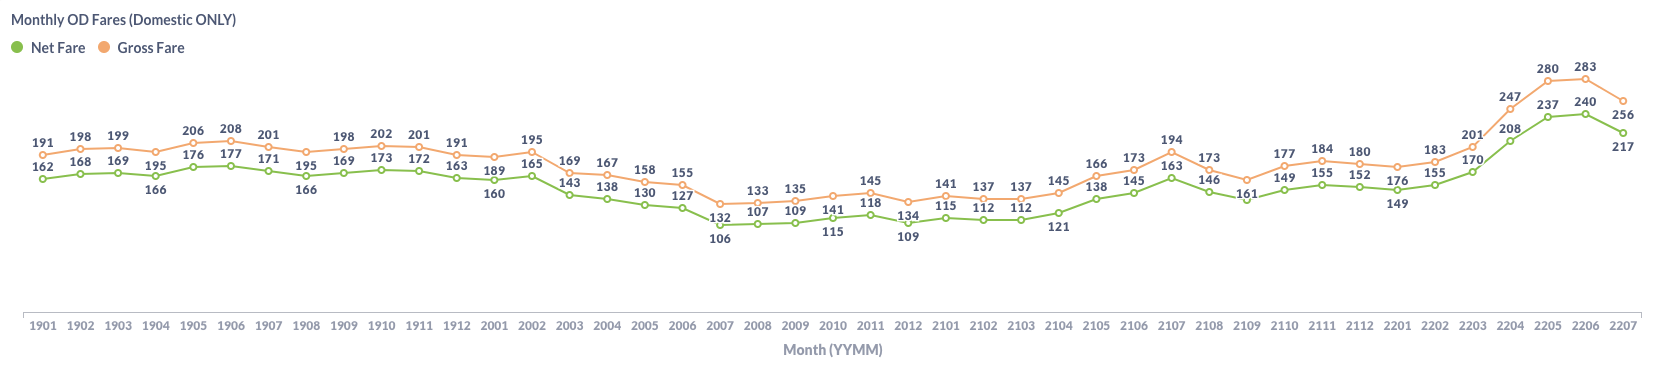
Figure 2: US Domestic Average Airfare by Month
The reduction of average fares is primarily driven by the cutback of Jet fuel prices. As shown in the chart below provided by EIA, the US jet fuel price has ebbed from its peaked in May.
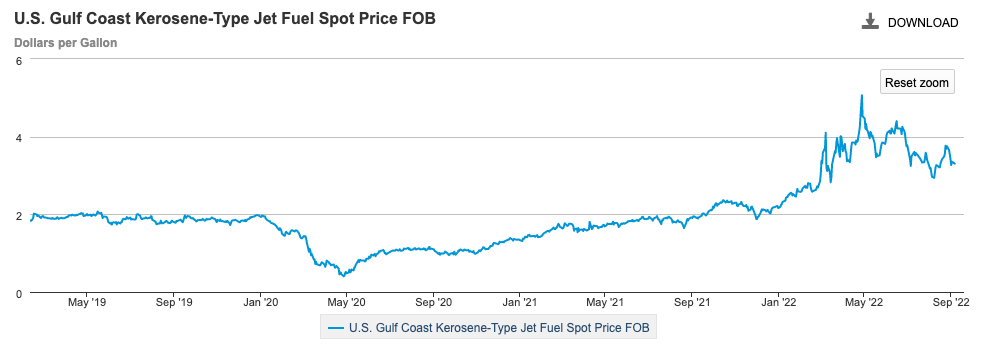
Figure 3: US Jet Fuel Price
Load Factor Trend
The average load factor in July is 82.2%, which is slightly better than that in July because traffic grew marginally faster than the capacity did.
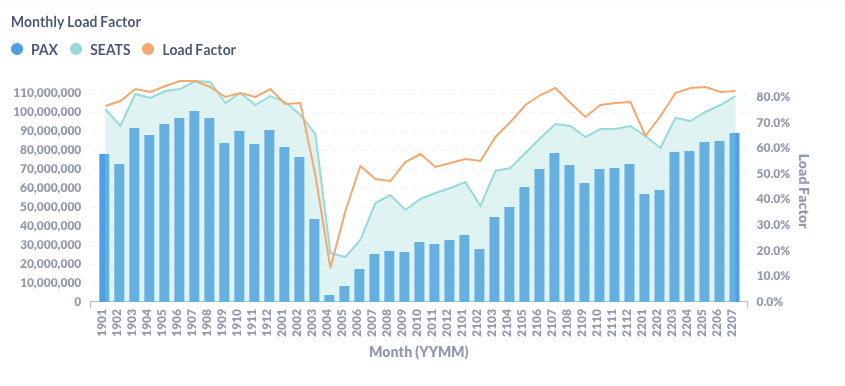
Figure 4: US Airlines’ Average Load Factor by Month
Month Over Month Comparison
From June to July, all major US airlines grew in total passenger traffic. However, because there is one day more in July than in June, American(AA) and Delta(DL) actually carried fewer passengers per day. Jet Blue(B6) and Frontier(F9) performed better than other airlines, with 5.4% and 5.0% growth rates, respectively. Hawaiian Airlines (HA) increased traffic by 4.8%, thanks to the growing traffic to its base in the famous summer vacation destination.
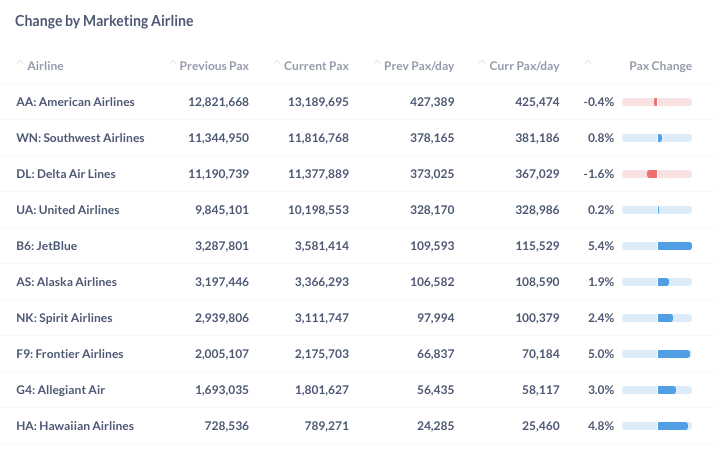
Figure 5: Pax by Dominant Marketing Airlines in July 2022 (Current) vs. June 2022 (Previous)
Traffic change by the airport is modest compared with the previous months. Among the top airports, Seattle (SEA) achieved the highest monthly growth of 4.8%. Two New York airports, LGA and JFK, grew by 4.3% and 3.8%. On the other side, Phoenix (PHX) lost 5.5% of daily passengers, and San Francisco (SFO) slowed down by 5.3%.
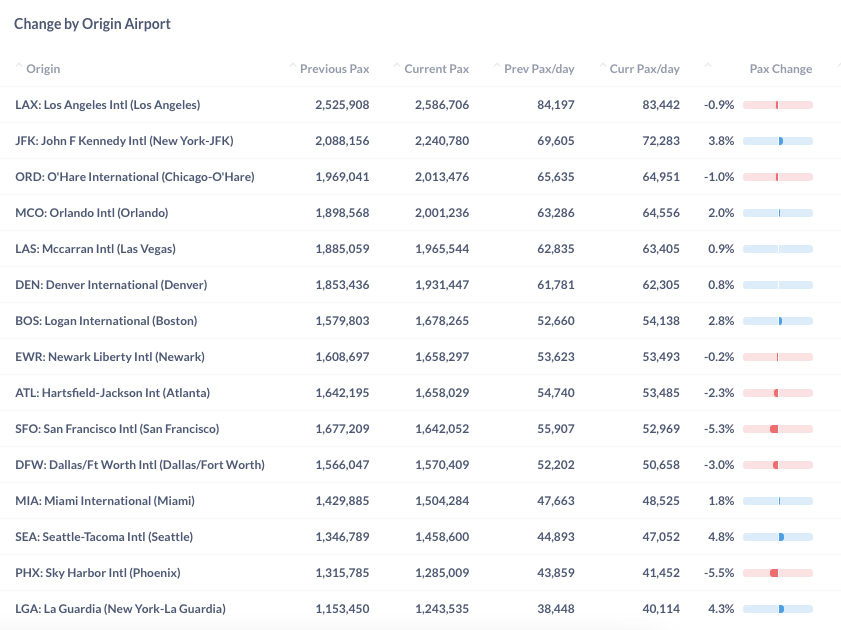
Figure 6: Pax by Top Origin Airports in July 2022 (Current) vs. June 2022 (Previous)
Year Over Year Comparison
Compared to the same month last year, some airlines had achieved two-digit growth while others had single-digit growth and even a loss. United(UA) led with a year-over-year growth rate of 22.0%. But Allegiant (G4) decreased by 3.3%, indicating the rebound of leisure travel from COVID has reached its end.
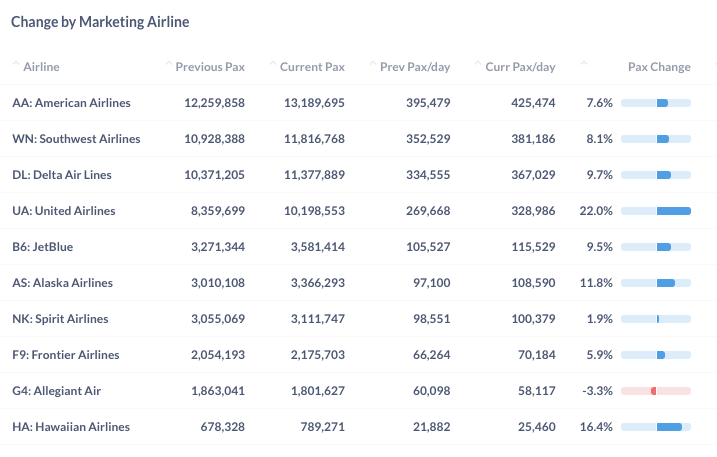
Figure 7: Pax by Dominant Marketing Airlines in July 2022 (Current) vs. July 2021 (Previous)
By origin, we still see many airports had significant growth from last year. New York’s two airports increased traffic by 69.2% (LGA) and 45.4% (JFK), thanks to the rebound in international traffic and business trips. San Francisco (SFO) and Boston (BOS) also generated 48.6% and 41.7% more passengers than last year. Among the top airports, only Fort Lauderdale (FLL) had a 3.0% decrease. The leisure market started the recovery first last year and is losing momentum now.
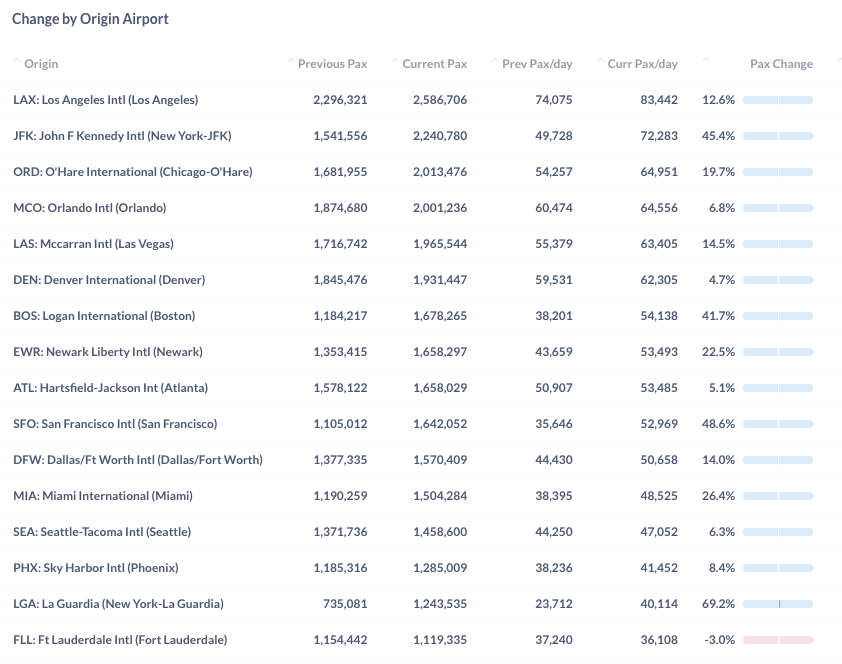
Figure 8: Pax by Top Origin Airport in July 2022 (Current) vs. July 2021 (Previous)
For more granular traffic and fare information by route and airline, please contact service@flightbi.com or request a demo of Fligence USOD.