The US BizAv (Business Aviation) market has gone through a booming period since March 2021. Will this trend continue? Probably not. Private flying is a luxury. When the COVID viruses were rampant and commercial aviation limped, travelers gave a higher priority to their health and convenience. That’s the primary demand driver behind the worldwide BizAv market growth.
But commercial aviation is coming back. On one hand, more travel restrictions have been removed. Travelers are less concerned about COVID. On the other hand, commercial airlines are offering higher compensations to attract pilots. After the COVID outbreak, many commercial airlines put crew on furlough, which created an opportunity for BizAv operators to recruit new pilots for their growing business. But now the flow is shifted back to the opposite direction.
We define the BizAv market as part-135 on-demand for-hire private flying by business jets or certain turboprop planes. The numbers in the following charts exclude part-91 private flights. If you are interested in all flights by business jets, please contact support@flightbi.com.
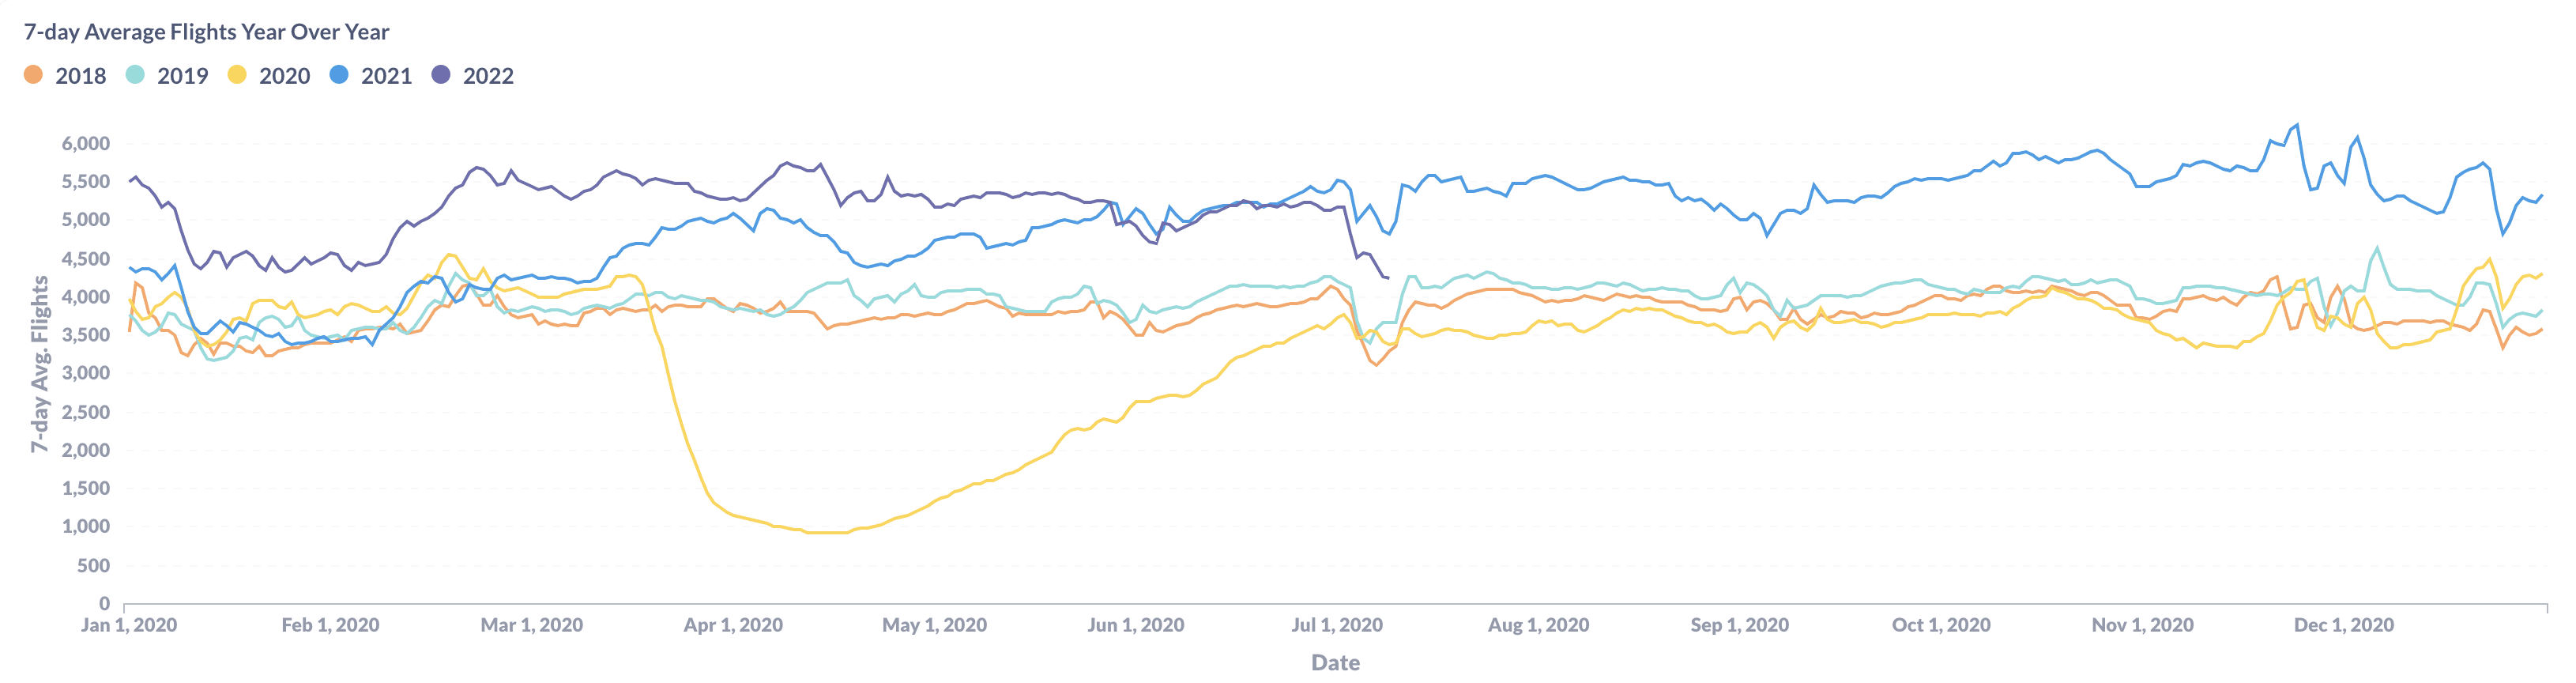
Figure 1: Year over Year Trend of the U.S. BizAv Market
Some business aviation media is celebrating more flights in the first half of 2022. As shown in Figure 1, it is true that there are about 14% more business flights in 2022 than in 2021 from January to June. But the gap has shrunk and reversed in June. Days around July 4th always see fewer business flights than other days. But this year the dip just got deeper.
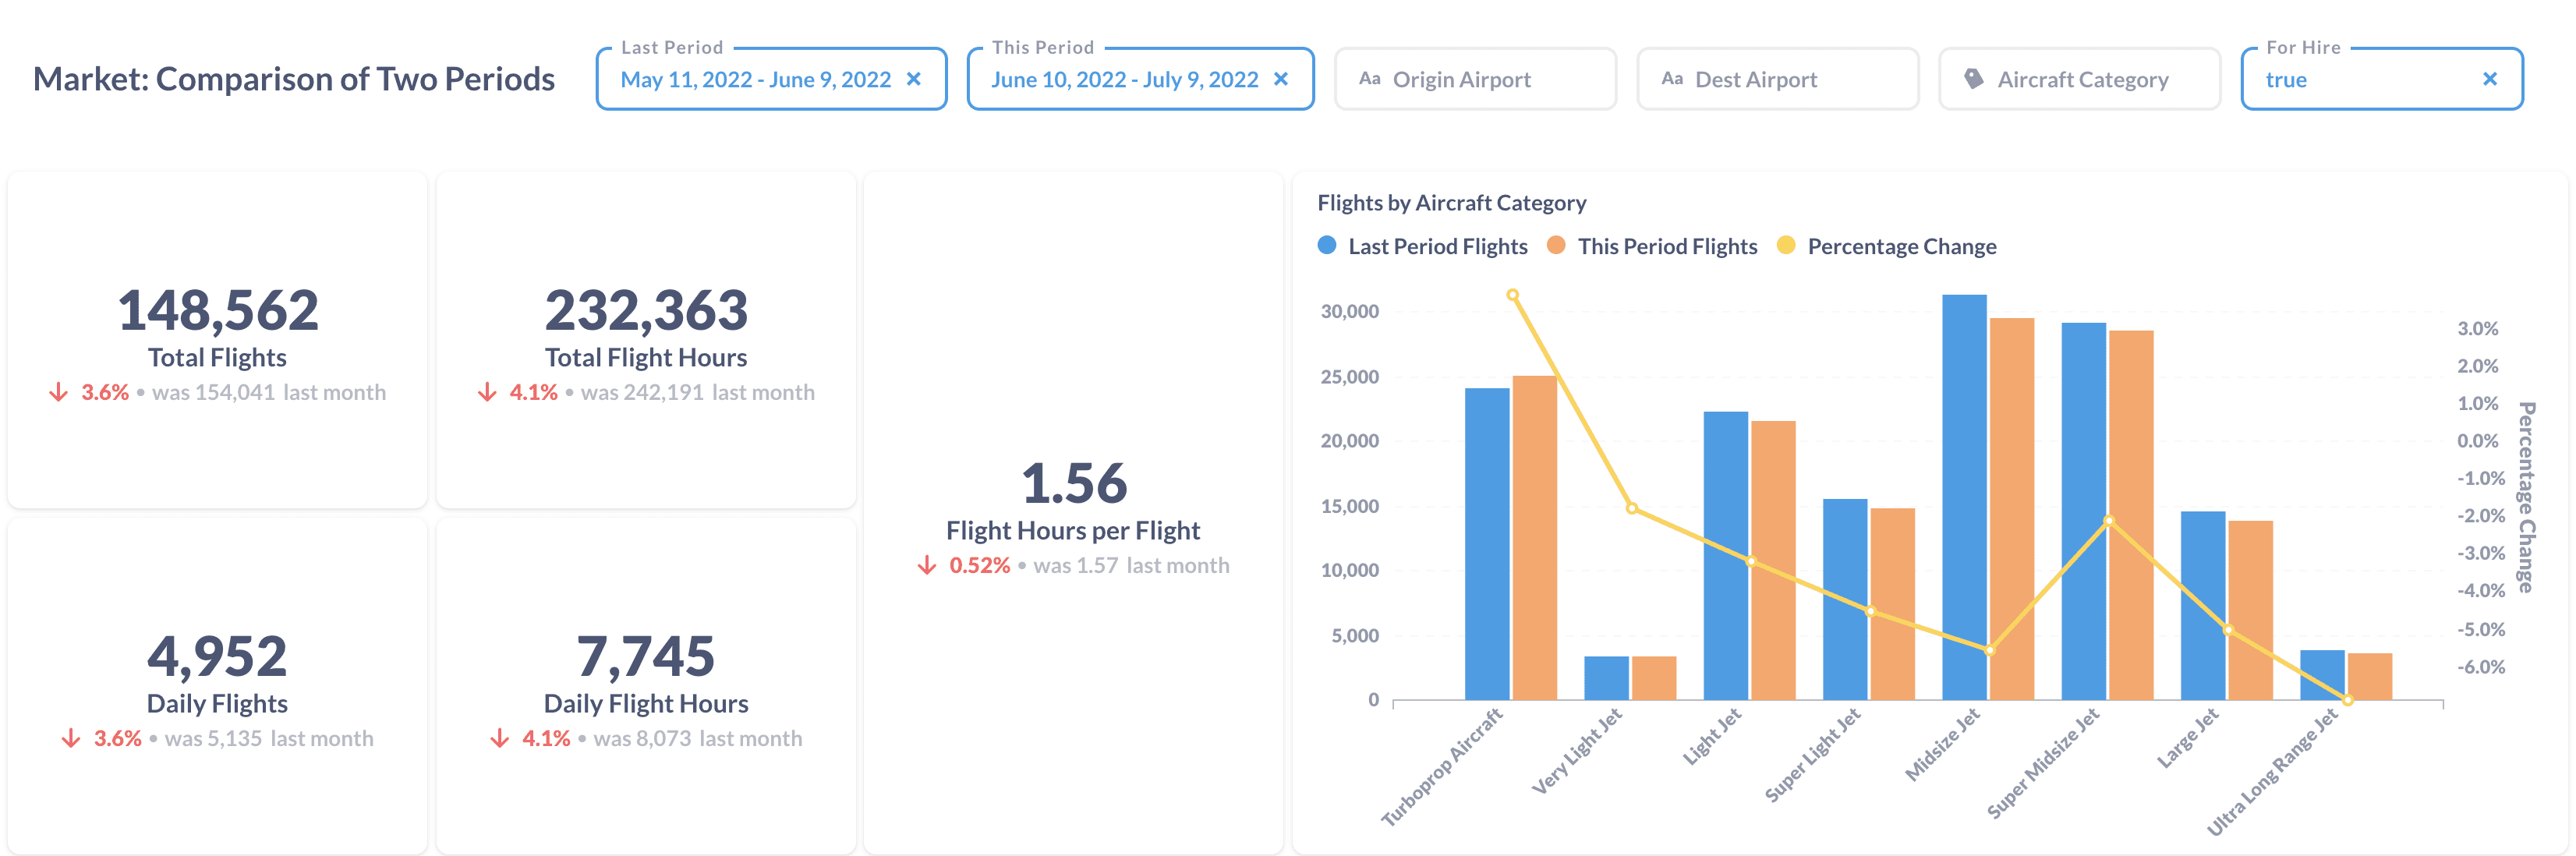
Figure 2: Comparison of the U.S. BizAv Flights This Month vs. Last Month
Figure 2 is a comparison of the most recent 30-day period with the previous 30-day period. The number of flights has decreased by 3.6% while flight hours have declined by 4.1%. In other words, both the number of flights and average flight length are waning. In terms of aircraft category, the expensive jets, including Ultra Long Range Jet, Large Jet, and Midsize Jet, had the largest decrease between 5-7%. Only the most economic Turboprop gained 3.9% from last month.
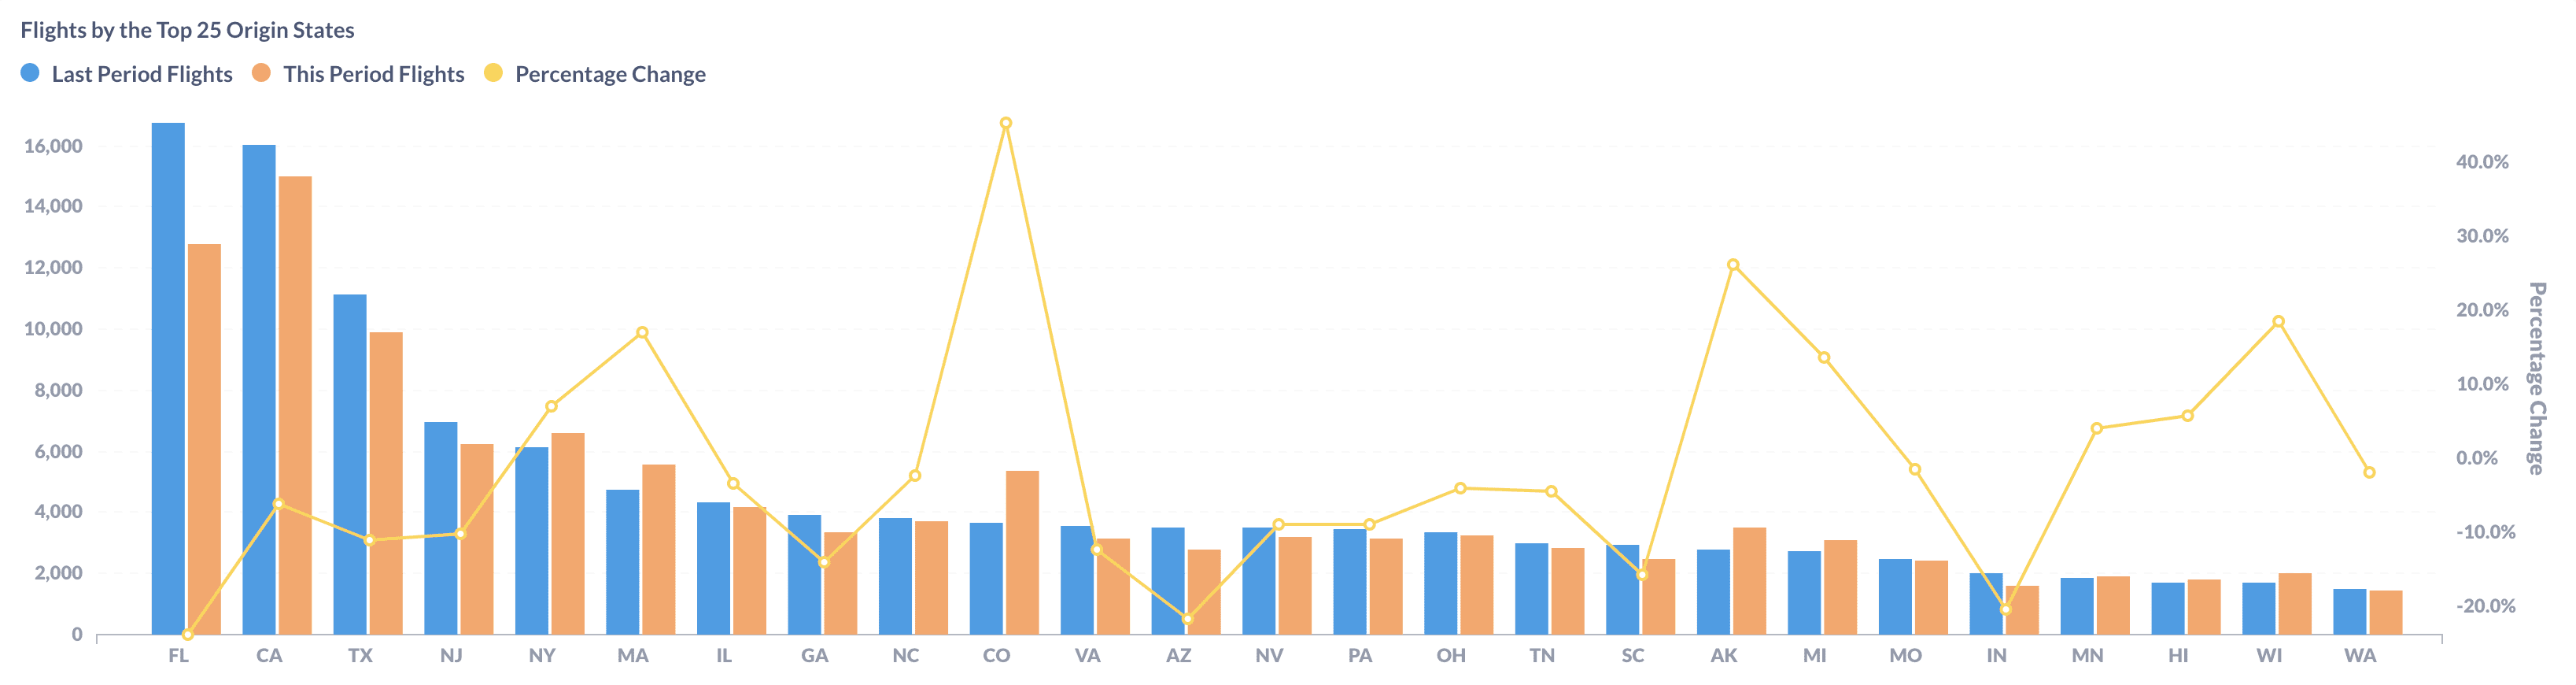
Figure 3: Comparison of the U.S. BizAv Flights by the Top 25 Origin States (This Month vs. Last Month)
All top 3 states – Florida(FL), California(CA), and Texas(TX) – had fewer business flights in this period. The bellwether FL experienced a decrease of -23.8%, partly because of the seasonality and partly because of the overall market trend. Among the top 25 origin states, Colorado(CO) and (Alaska)AK had the highest growth, thanks to the start of summer.
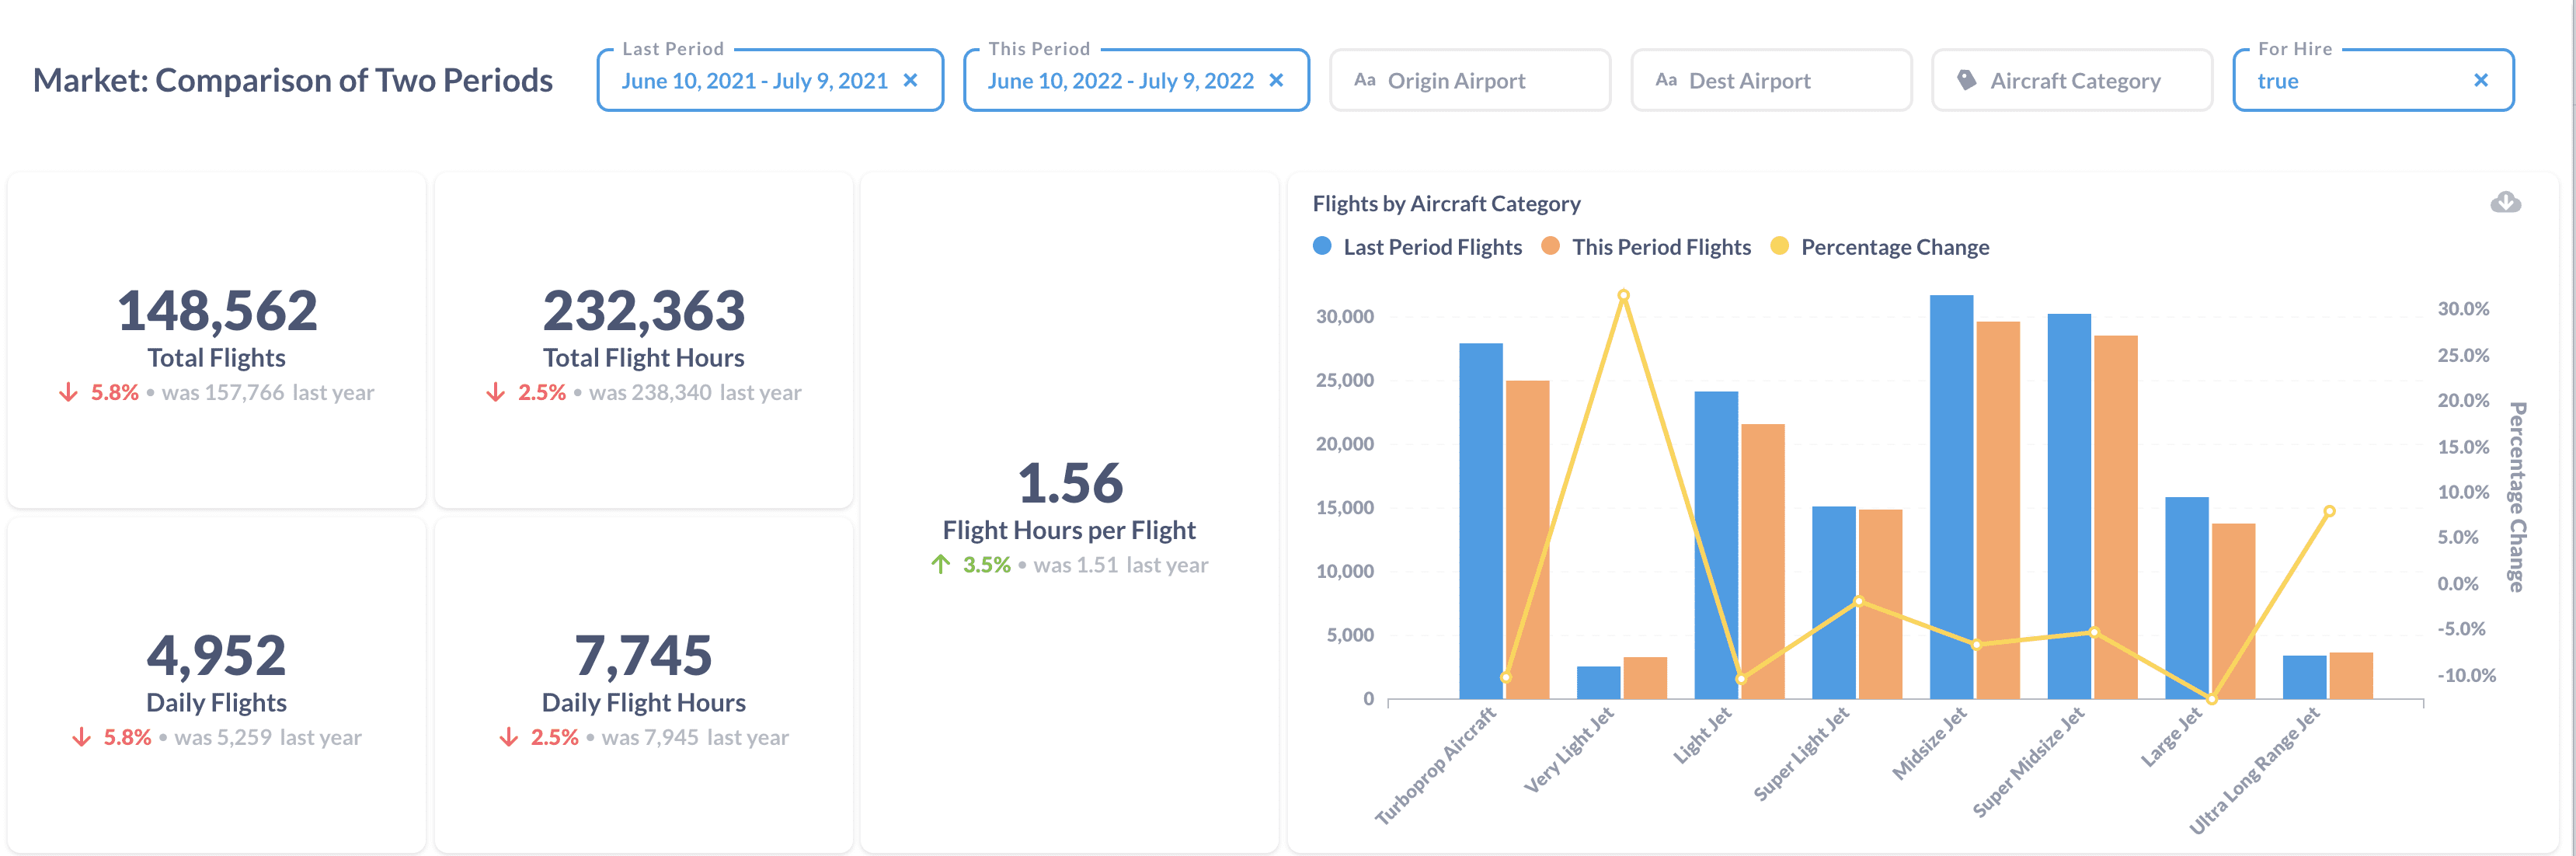
Figure 4: Comparison of the U.S. BizAv Flights This Year vs. Last Year
Compared to the same period last year, the number of total business flights decreased by 5.8%. The average flight hours per flight increased by 3.5%. Even so, the total flight hours decreased by 2.5% from last year. The contribution of flight hours is from Ultra Long Range Jet, which increased by 8.9%. The number of flights by Very Light Jet also increased by 31.6%. But it is the smallest group and flights by all other aircraft categories are cut back.
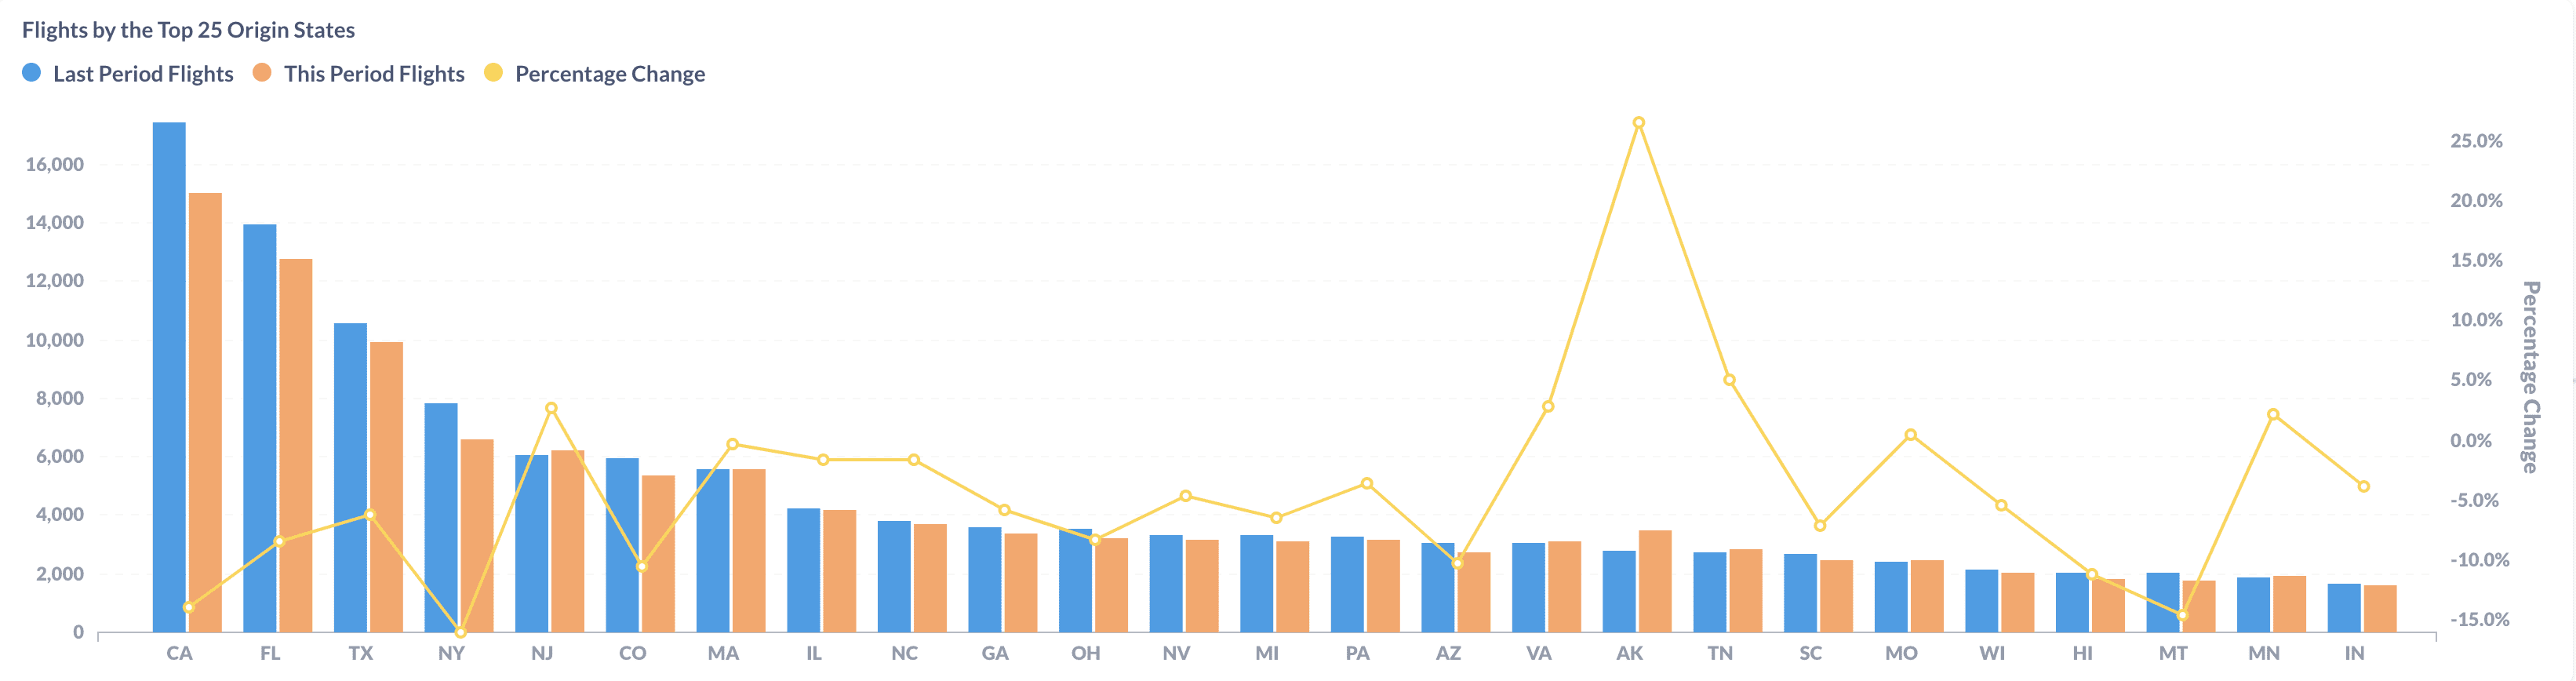
Figure 5: Comparison of the U.S. BizAv Flights by the Top 25 Origin States (This Year vs. Last Year)
Business flights from all top 3 origin states are dwindling from last year. California (CA) decreased by 13.9%. New Jersey is gaining some momentum with a growth rate of 2.8% because the largest business aviation airport in the U.S. – Teteboro – is rebounding. Alaska (AK) achieved a 26.5% growth. But the majority of those flights are by Turboprop. Those are not typical business flights attractive to BizAv operators.