The US BizAv (Business Aviation) market has gone through a booming period since March 2021. This series of articles track the traffic trend of this market.
We define the BizAv market as part-135 on-demand for-hire private flying by business jets or certain turboprop planes. The numbers in the following charts exclude part-91 private flights. If you are interested in all flights by business jets, please contact support@flightbi.com.
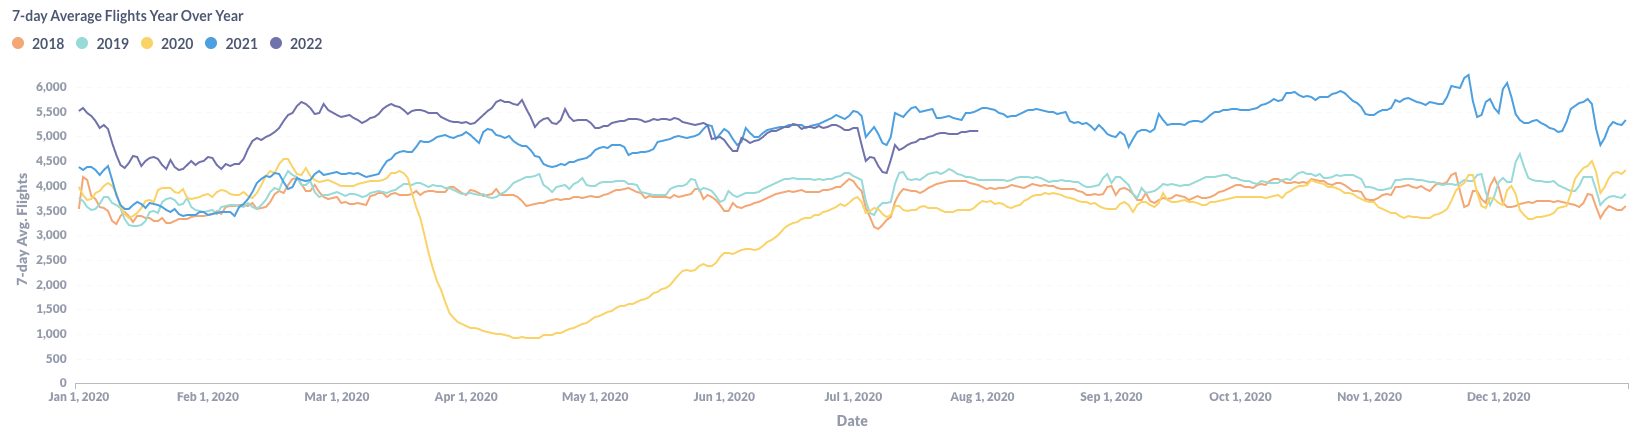
Figure 1: Year over Year Trend of the U.S. BizAv Market
As shown in Figure 1, there is a dent in the U.S. BizAv traffic curve around the July 4th holiday, which is normal for the U.S. BizAv Market. The traffic started growing again after the holiday. But the 2022 curve is still under the 2021 curve.
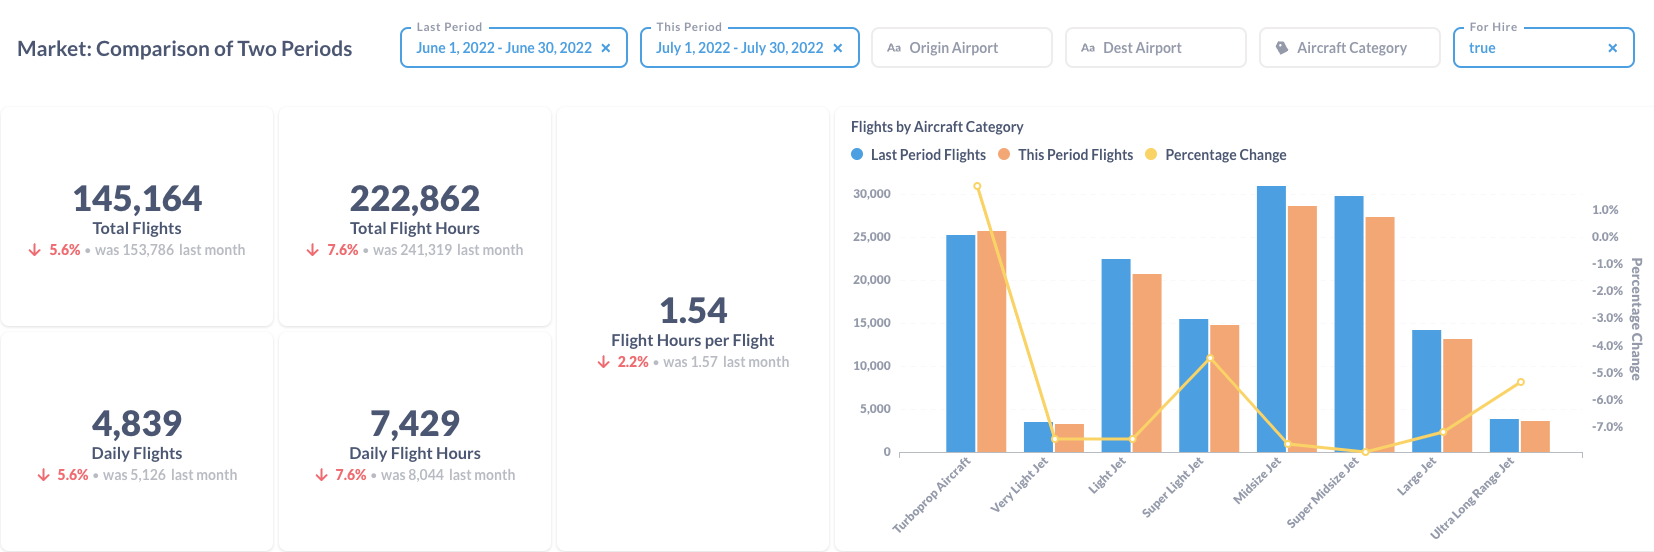
Figure 2: Comparison of the U.S. BizAv Flights This Month vs. Last Month
Figure 2 is a comparison of the first 30 days in July with June. The number of flights has decreased by 5.6%, and flight hours have declined by 7.6%. In other words, both the number of flights and average flight length are waning. In terms of aircraft category, all jets decreased between 4-8%. Only the most economic Turboprop gained 1.9% from last month.
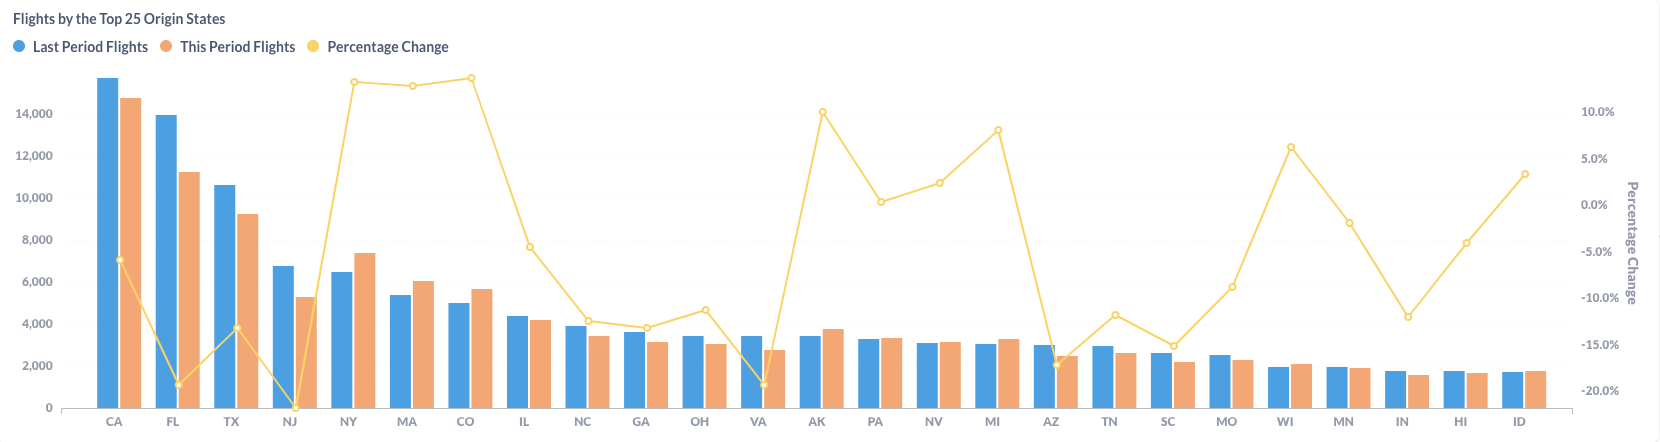
Figure 3: Comparison of the U.S. BizAv Flights by the Top 25 Origin States (This Month vs. Last Month)
All top 3 states – California(CA), Florida(FL), and Texas(TX) – had fewer business flights in this period. California won back its top business aviation state title from Florida because the latter experienced a decrease of 19.4%, while California declined by 5.9%. Among the top 25 origin states, New York(NY), Massachusetts(MA), and Colorado(CO) had the highest growth, around 13%, from the last month.
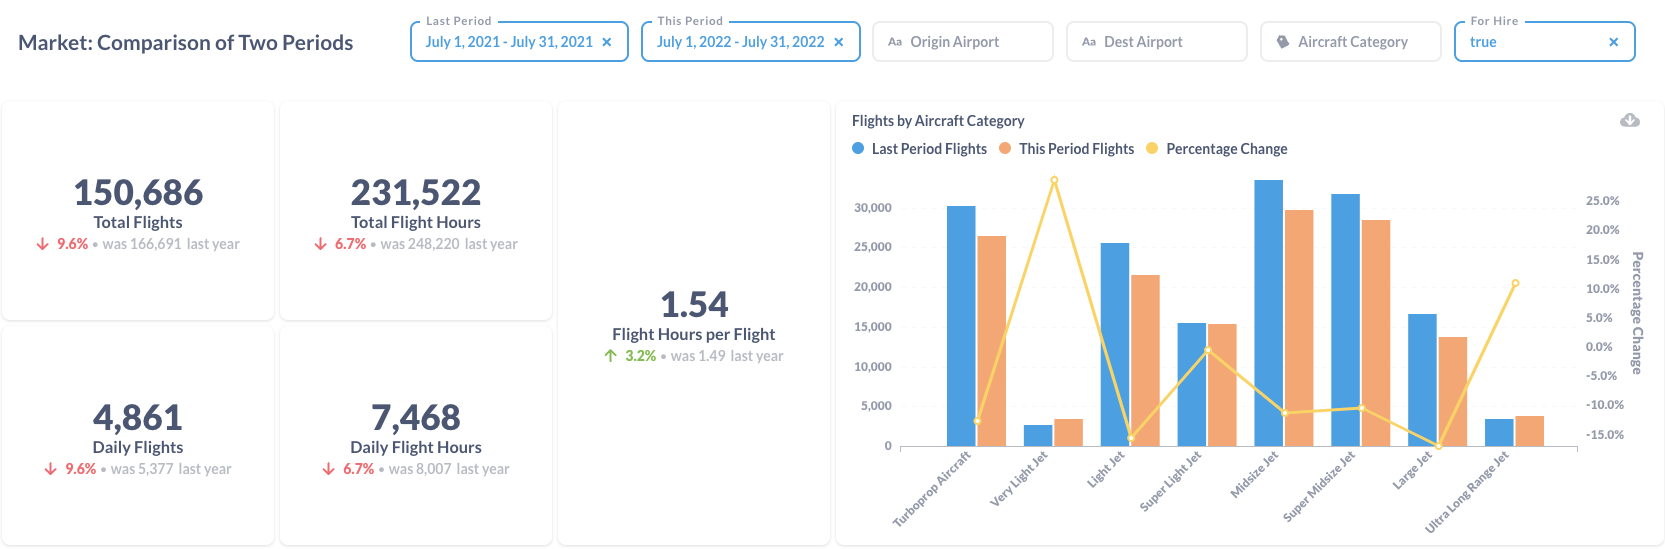
Figure 4: Comparison of the U.S. BizAv Flights This Year vs. Last Year
Compared to July last year, the number of total business flights decreased by 9.6%. The average flight hours per flight increased by 3.2%. Even so, the total flight hours decreased by 6.7% from last year. The contribution of flight hours is from Ultra Long Range Jet, which increased by 11% year over year. This indicates a good recovery of international travel. The number of flights by Very Light Jet also increased, at an even higher rate of 28.6%. But it is the smallest group. Flights by all other aircraft categories are lower than last year.
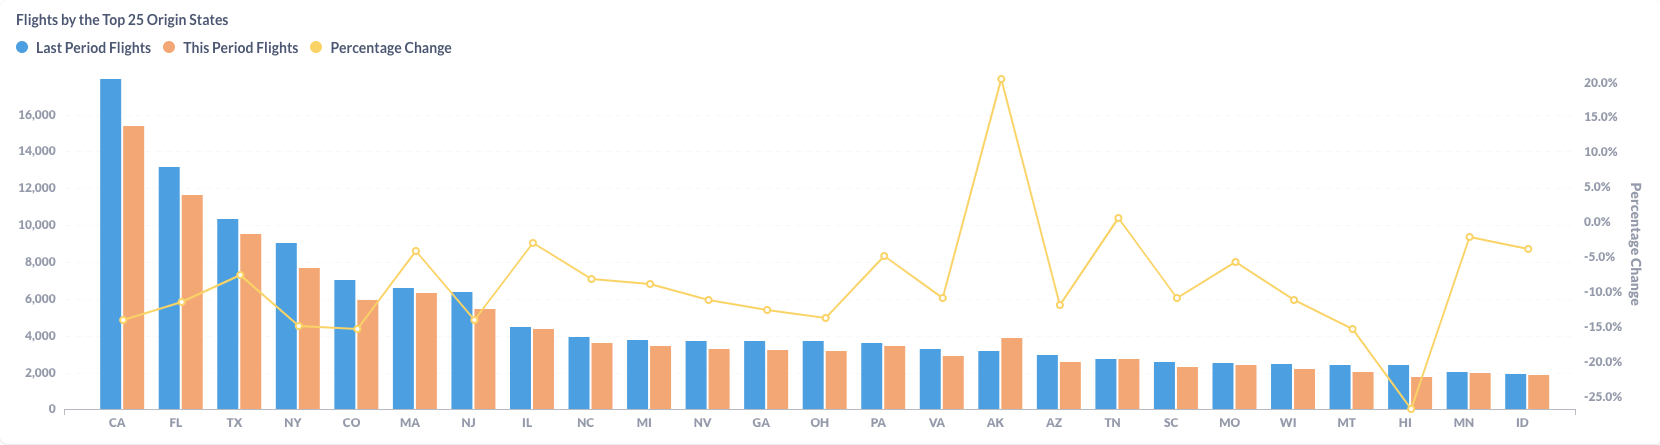
Figure 5: Comparison of the U.S. BizAv Flights by the Top 25 Origin States (This Year vs. Last Year)
Business flights from all top 3 origin states are dwindling from last year. California (CA) decreased by 14.1%. The biggest winner is Alaska (AK), which achieved a 20.5% growth, thanks to the hot temperature this summer. But the majority of those new flights are by Turboprop. Those are not typical business flights attractive to BizAv operators.