Airline Reporting Corp. (ARC) published a newsletter about the June Air Ticket Sales yesterday. The title states that the June ticket sales increased 87% year over year. That sounds right, given that the US air market is still recovering from the pandemic. What drew my attention is the following: month over month, June 2022 results showed total passenger trips down 5%. Did the US air traffic decrease from May to June?
Airport Traffic
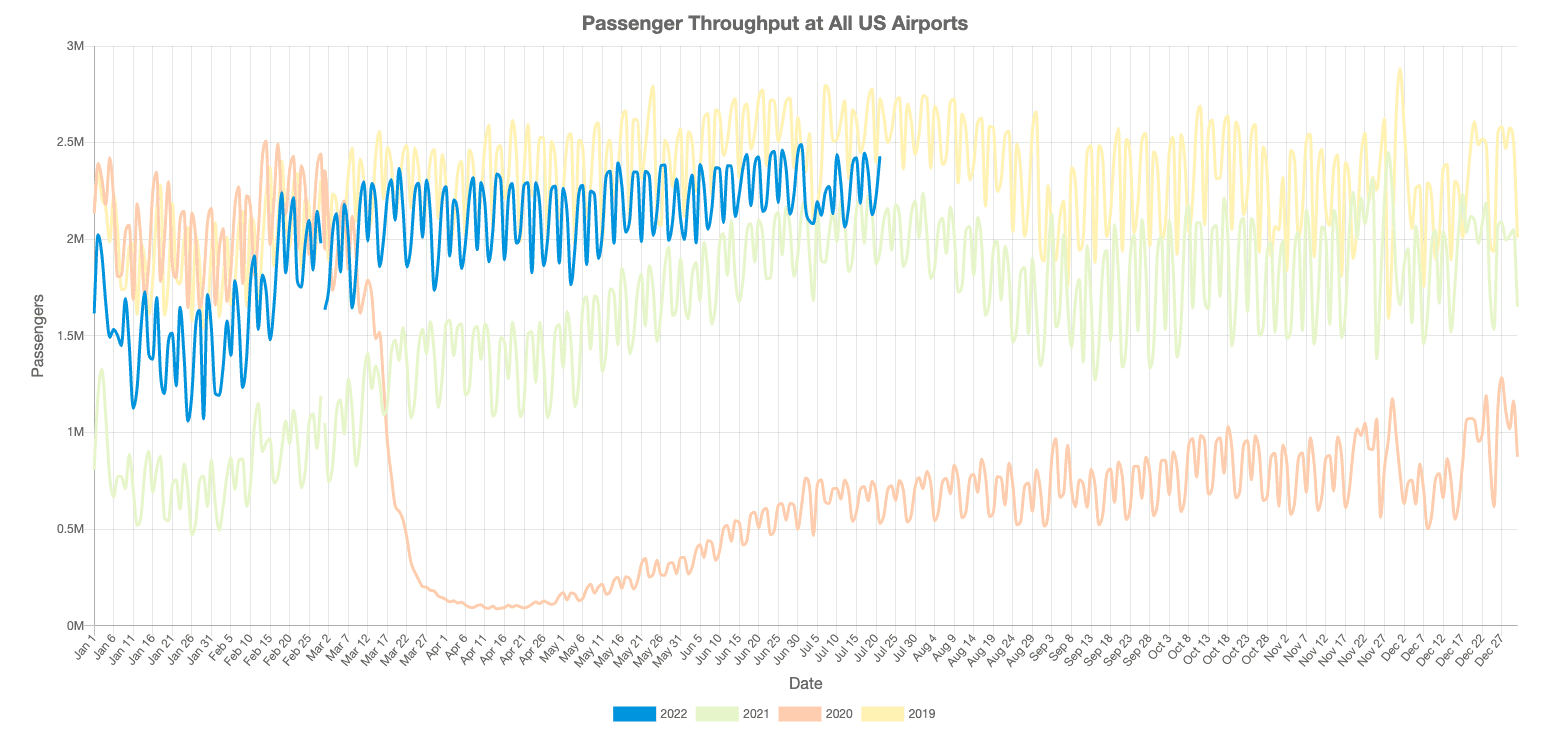
I went to FlightBI’s airport traffic monitor. Figure 1 shows the total passenger throughput at all US airports. The traffic level was relatively flat from March to May this year, but there was an uptrend in June. The ARC newsletter also pointed out “In pre-pandemic years, we typically saw an 8-12% decline in total sales and passenger trips from May to June”. But the yellow line in Figure 1 (2019 traffic) doesn’t show a decline in June either.
Data Definition
Data in Figure 1 are from US Transportation Security Administration (TSA). The number includes all people scanned by security machines at each airport. Besides normal air passengers, it includes airline crew members and people who don’t even fly, such as staff working at airport retailers. However, non-passenger traffic accounts for only about 5% of the total. There are some other noises. For example, if a flight is canceled after passengers have already gone through the security checkpoints, some of those passengers may not fly on that day. But overall the TSA numbers reflect the total air traffic trend very well.
ARC provides a settlement service between airlines and travel agencies for air tickets sold in the U.S. It has very good coverage of indirect sales of legacy airlines. However, low-cost carriers such as Southwest and ultra-low-cost carriers such as Frontier and Spirit generally don’t use ARC for settlement. The only exception is that Southwest works with ARC on business tickets, but those are still a small portion of total tickets sold by Southwest. Is the difference caused by direct sales versus indirect sales?
Airline Traffic
Fortunately, we have another data source to check the US total air traffic by trip. US Department of Transportation (DOT) published a T100 data with flight segment statistics and a DB1B data of 10% ticket samples from all major airlines. Based on those data, we have a model to scale up the DB1B trip level data to the 100% market size. Figure 2 is the result of three years before the pandemic.
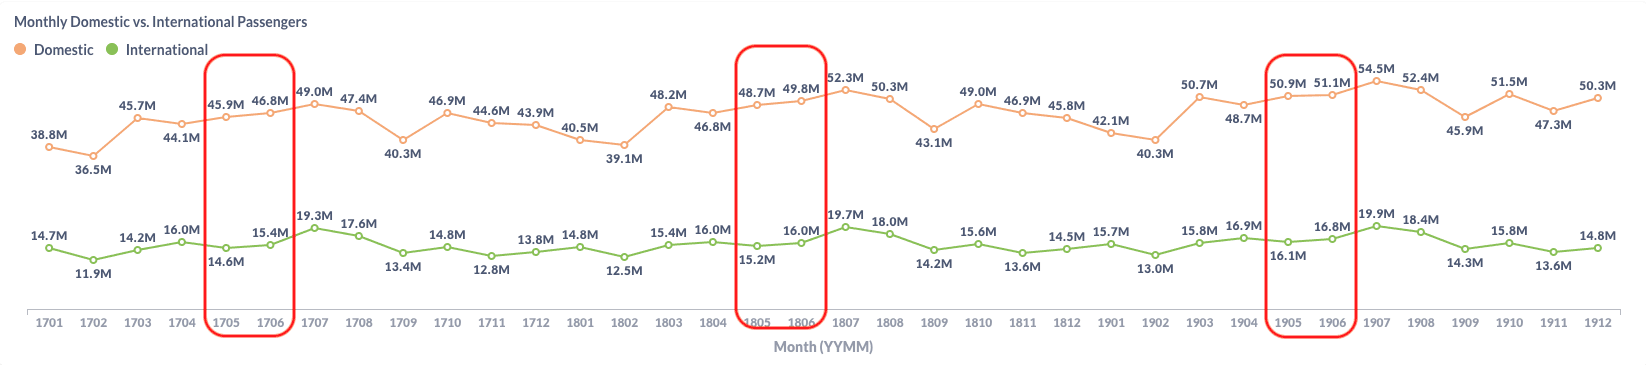
Because the latest data for June 2022 has not been available yet, we can only check the traffic in previous years. As shown in Figure 2, in 2017, 2018, and 2019, there were always higher traffic numbers in June than those in May. So could ARC’s numbers be wrong?
Purchase Date vs. Travel Date
I revisited ARC’s new release. Then came the aha moment! ARC’s article talks about air ticket sales. The total passenger trips in its news release are by purchase date. The airport throughput and airline trips I verified above are air traffic by travel date. That’s why those data show different directions.
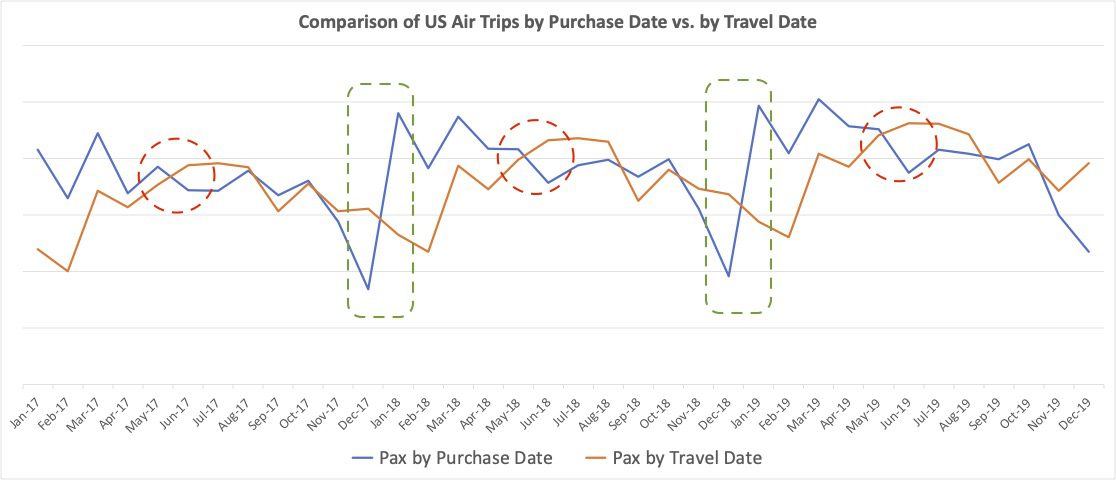
We all know that the air market has seasonality. More people travel in summer than in winter. But the purchase of air tickets has a different pattern. As shown in Figure 3, there are more purchases at the beginning of a year than at the end of a year. Because of the different patterns of purchases versus travel, there are two periods in which the two curves go in different directions. From May to June, traffic increases while purchasing decreases (as shown in the red circles). From December to January next year, traffic decreases while purchasing skyrockets (as shown in the green rectangles).
Reasons
The jump in air ticket purchasing from December to January is easy to understand. Many corporates run out of budget at the end of the year and re-open the budget at the beginning of next year. Individual travelers also tend to do travel planning at the beginning of the year.
The decrease in purchasing from May to June is an interesting phenomenon. Air travel peaks from the end of June to the beginning of September primarily because that’s when kids are out of school. Leisure travelers tend to book flight tickets 1-3 months before the trip. It’s likely more of the summer trips are booked in May than in June. Furthermore, May is a month with relatively more business trips than in other months because many leisure trips have been made during the spring break in March or April. Business travelers are price insensitive. They tend to purchase a ticket 1-2 weeks before the trip. Those are possible reasons why there are fewer air ticket sales in June than in May.
Conclusion
I was surprised to see the decrease in air trips from month to month in ARC’s newsletter. Now I know it’s just a sales decrease because of seasonality and travelers’ behavior. The U.S. air market is still on the right track!