The US BizAv (Business Aviation) market has been booming since March 2021. This series of articles track the traffic trend of this market. We define the BizAv market as part-135 on-demand for-hire private flying by business jets or certain turboprop planes. The numbers in the following charts exclude part-91 private flights. If you are interested in all flights by business jets, or detailed flights by route and operator, please get in touch with us.

Figure 1: Year over Year Trend of the U.S. BizAv Market
Figure 1 displays the trends in U.S. Business Aviation (BizAv) traffic from January 2020 to January 2024. The flight activity in January 2024 mirrors the levels observed in January 2022 and 2023. Typically, following New Year’s Day, there is a noticeable decrease in travel preference across both the BizAv and commercial aviation sectors.

Figure 2: Comparison of the U.S. BizAv Flights This Month vs. Last Month
Figure 2 offers a comparative analysis of flight data from December 2023 to January 2024, highlighting a 5.8% decrease in daily flight frequency for January compared to the previous month. The decline in total daily flight hours was slightly less significant, at 5.1%. Notably, the average flight duration per departure experienced a modest increase of 0.8%. Despite an overall reduction in activity across all aircraft categories, the Midsize Jet segment faced the steepest decline at 10.9%. In contrast, the Super Midsize Jet and Ultra Long Range Jet segments recorded minor increases of 1.3% and 0.7%, respectively.

Figure 3: Comparison of the U.S. BizAv Flights by the Top 25 Origin States (This Month vs. Last Month)
Between December 2023 and January 2024, aviation activity decreased in most U.S. states, with only a few witnessing growth. Remarkably, Florida (FL), the top-performing state, saw negligible change. California (CA), ranking second, experienced a 5.5% increase. Conversely, New Jersey (NJ) saw a significant decline of 16.3%. Notably, Utah (UT) recorded a substantial growth of 25.6%.
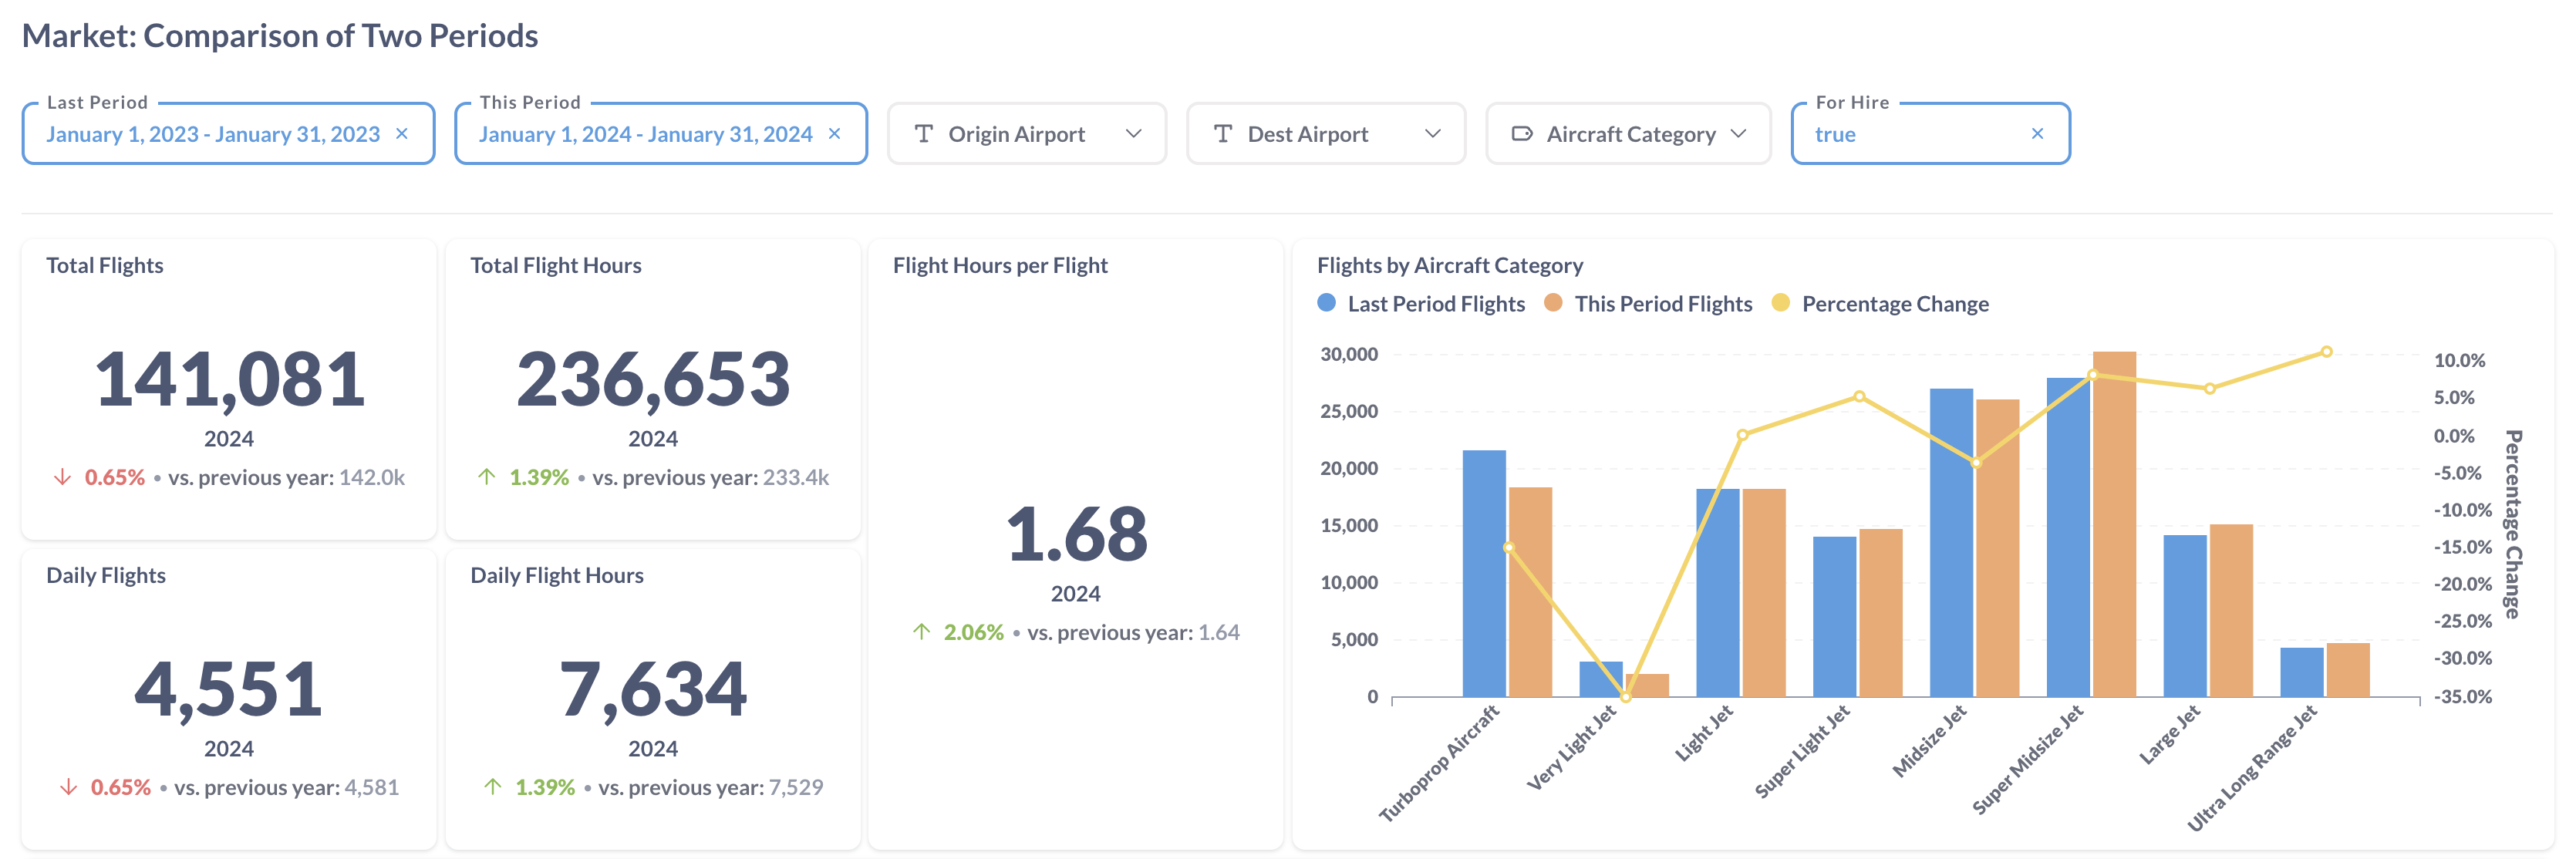
Figure 4: Comparison of the U.S. BizAv Flights This Year vs. Last Year
In January 2024, compared to the same month in 2023, there was a slight 0.65% decrease in the number of flights, but a 1.4% rise in flight hours, attributed to a 2.1% increase in average flight hours per flight. Among the various aircraft types, Very Light Jets experienced a notable decline of 35.1%, and Turboprop aircraft saw a 14.9% reduction. In contrast, the larger aircraft categories, including Super Midsize Jets, Large Jets, and Ultra Long Range Jets, witnessed increases ranging from 6.4% to 11.3%. This pattern indicates a shift in customer preference towards larger aircraft compared to the previous year.

Figure 5: Comparison of the U.S. BizAv Flights by the Top 25 Origin States (This Year vs. Last Year)
In the comparison of flight data from January 2023 to January 2024, significant differences emerged across larger states. The top three states, Florida (FL), California (CA), and Texas (TX), all saw growth ranging from 2.7% to 4.2%. In contrast, states known for tourism, such as Alaska (AK) and Hawaii (HI), experienced substantial declines, with decreases of 25.4% and 18.8%, respectively.
To summarize, the U.S. Business Aviation (BizAv) market saw a 5.8% decrease in flight frequency from December 2023 to January 2024, albeit with a slight uptick in average flight duration. A year-over-year comparison from January 2023 to January 2024 showed a modest 0.65% reduction in the number of flights, yet flight hours increased. Regionally, significant states like Florida, California, and Texas experienced growth, whereas tourist-focused destinations, particularly those favoring Turboprop and Very Light Jets, like Alaska and Hawaii, faced notable decreases.