The US BizAv (Business Aviation) market has been booming since March 2021. This series of articles track the traffic trend of this market.
We define the BizAv market as part-135 on-demand for-hire private flying by business jets or certain turboprop planes. The numbers in the following charts exclude part-91 private flights. If you are interested in all flights by business jets, or detailed flights by route and operator, please get in touch with us.
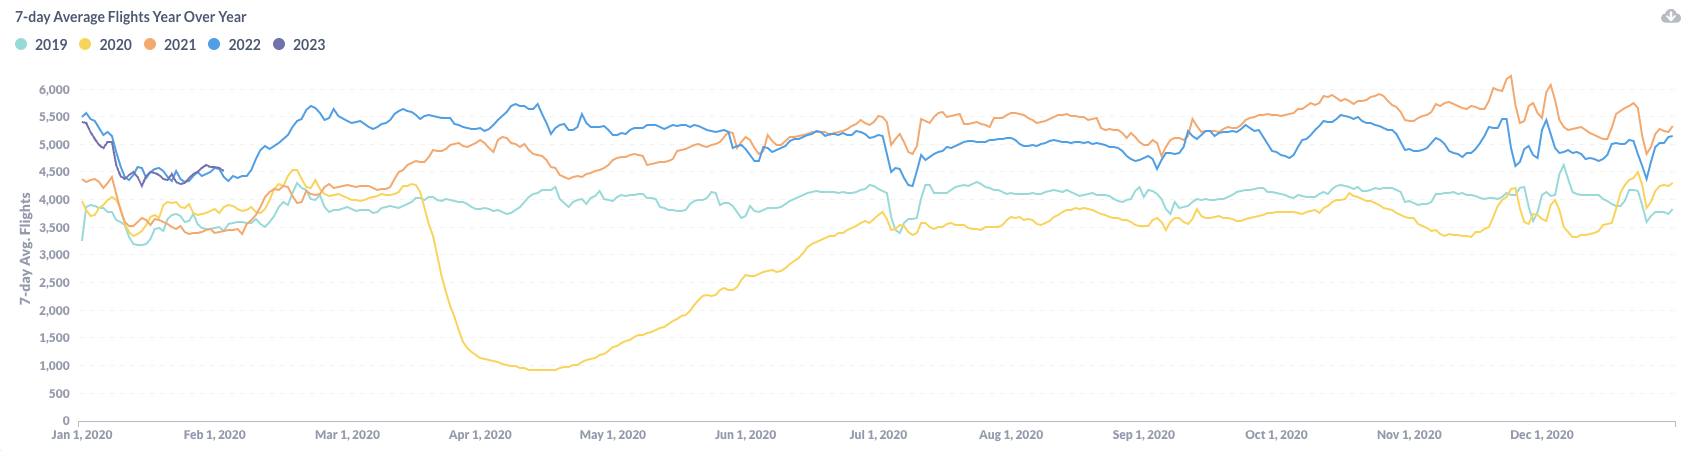
Figure 1: Year over Year Trend of the U.S. BizAv Market
As shown in Figure 1, the U.S. BizAv traffic in January 2023 followed the same pattern as last year – the curve went down from about 5,400 flights per day around the news year’s day to about 4,500 flights per day and then kept flat in the second half of January. The flight gap between 2023 and 2022 is relatively small..
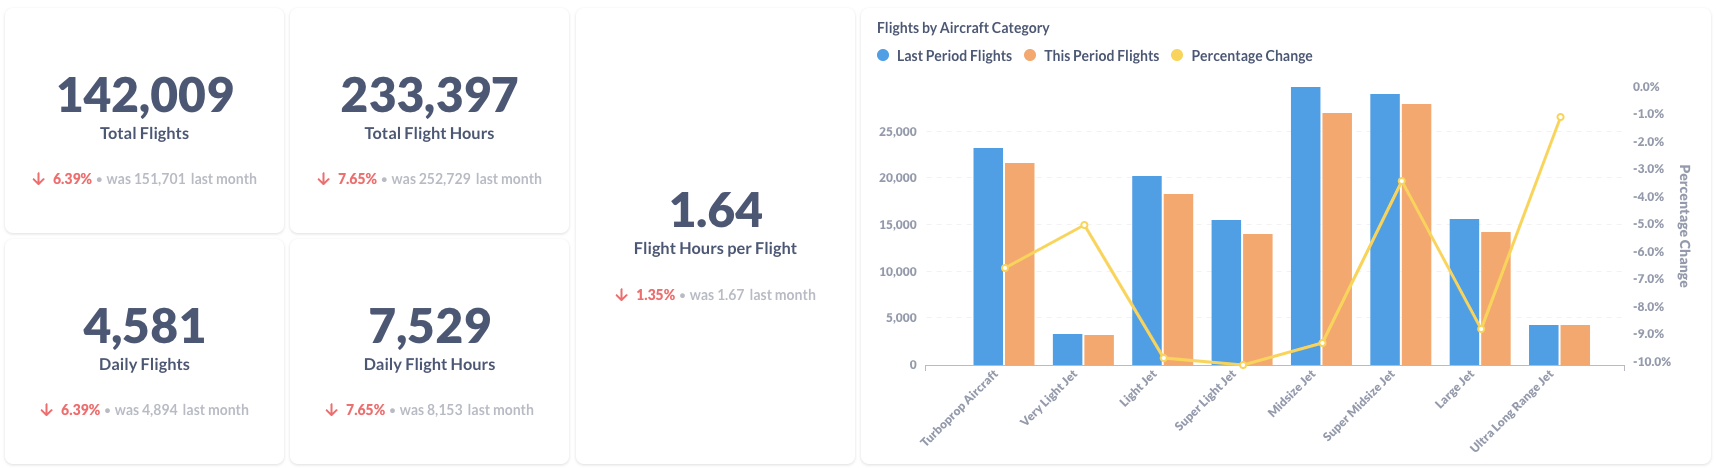
Figure 2: Comparison of the U.S. BizAv Flights This Month vs. Last Month
Figure 2 is a comparison between January 2023 and December 2022. The average daily flights decreased by 6.4%. The average daily flight hours dropped by 7.7% because the average flight hours per flight decreased by 1.4%. The cool-down of BizAv flights are from all aircraft categories, although Ultra Long Range Jet and Super Midsize Jet decreased less than other categories.
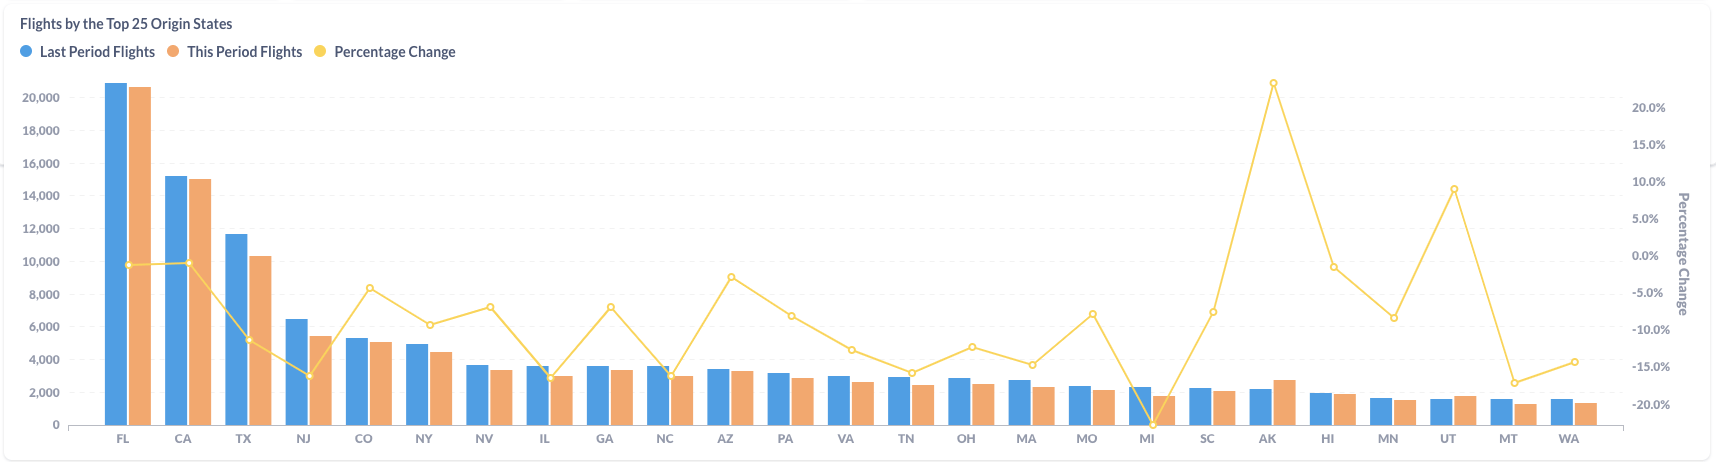
Figure 3: Comparison of the U.S. BizAv Flights by the Top 25 Origin States (This Month vs. Last Month)
All top origin states except Alaska(AK) and Utah(UT) had less flights in Jan 2023 than in Dec 2022. Texas(TX) and New Jersey(NJ) decreased 11.3% and 16.2%, respectively, much more severe than Florida(FL) and California (CA) did.
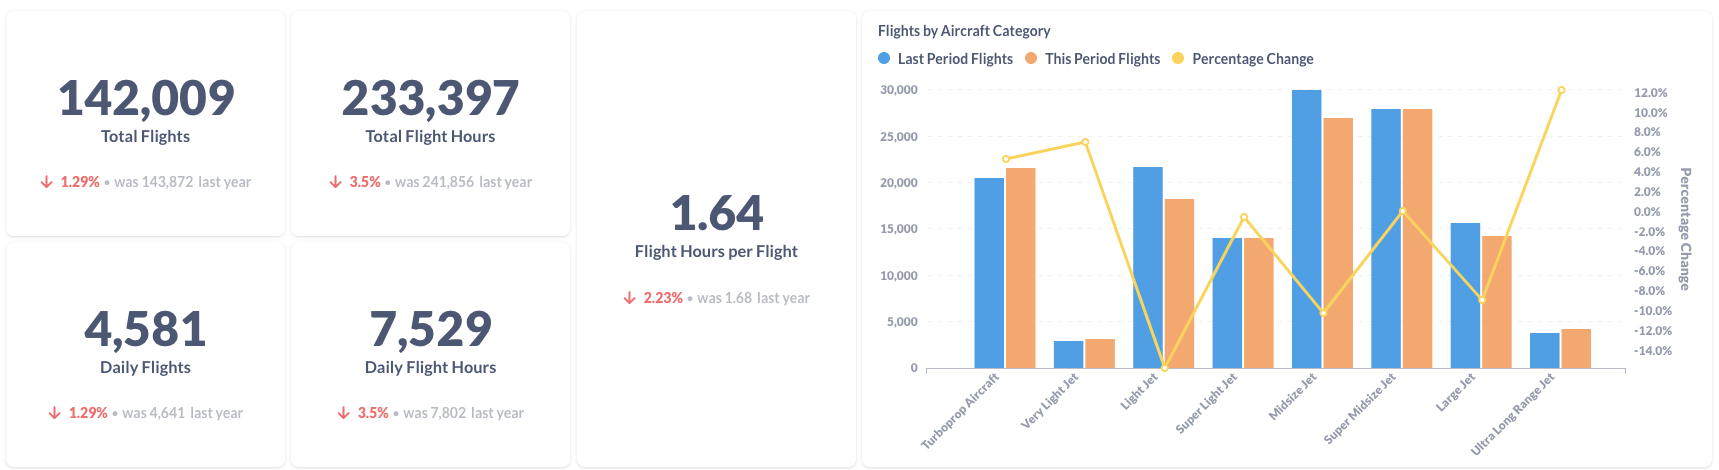
Figure 4: Comparison of the U.S. BizAv Flights This Year vs. Last Year
Compared to January 2022, total business flights in Jan 2023 decreased by 1.3%. Total flight hours dropped by 3.5% because the average flight hours per flight also shrank by 2.2%. Although Turboprop, Very Light Jets and Ultra Long Range Jet achieved positive growth, the aircraft categories with negative growth are bigger. However, the year-over-year decrease was mild compared with the previous quarter.
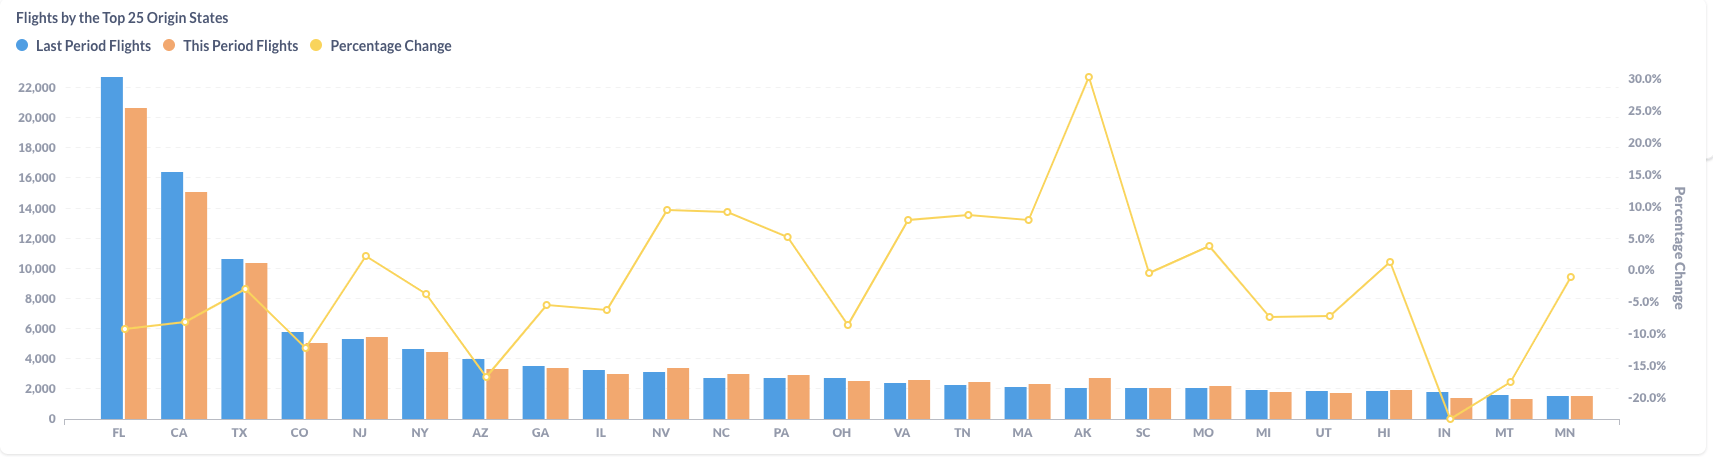
Figure 5: Comparison of the U.S. BizAv Flights by the Top 25 Origin States (This Year vs. Last Year)
The flight contraction happened in the large states including FL, CA, TX and CO. But many mid-size origin states, such as NJ, NV, NC and PA, generated more flights this year than in last year.