The US BizAv (Business Aviation) market has been booming since March 2021. This series of articles track the traffic trend of this market. We define the BizAv market as part-135 on-demand for-hire private flying by business jets or certain turboprop planes. The numbers in the following charts exclude part-91 private flights. If you are interested in all flights by business jets, or detailed flights by route and operator, please get in touch with us.
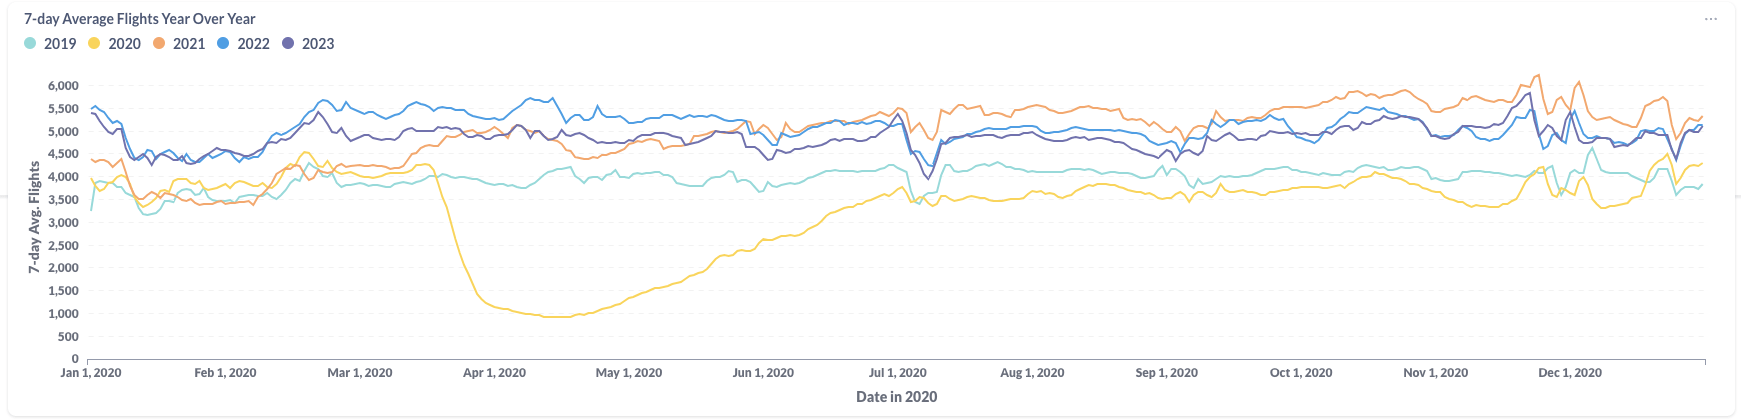
Figure 1: Year over Year Trend of the U.S. BizAv Market
Figure 1 presents a graphical representation of the trends in U.S. Business Aviation (BizAv) traffic from January 2019 through December 2023. As of December 2023, the volume of business flights closely mirrors that of the previous year. A noticeable decrease in flight activities is observed on Christmas Day, followed by a swift recovery towards the year’s end.
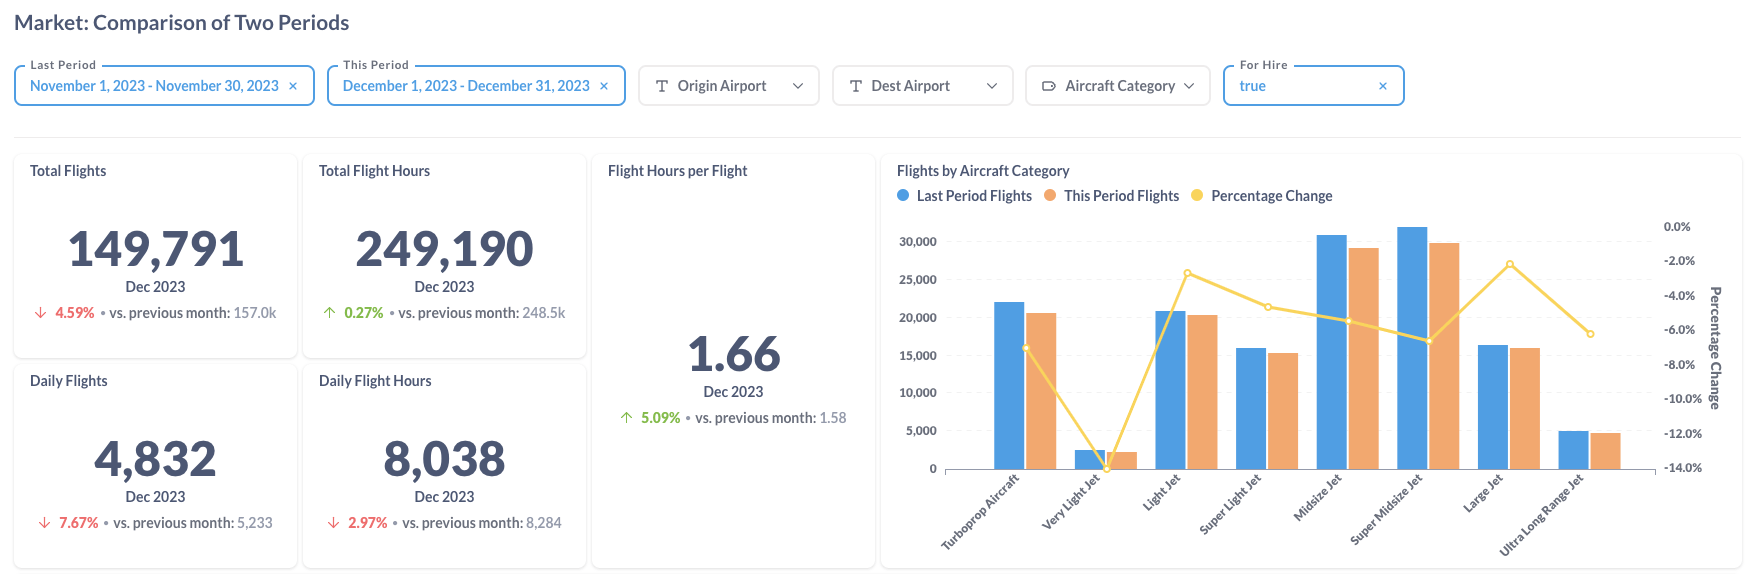
Figure 2: Comparison of the U.S. BizAv Flights This Month vs. Last Month
Figure 2 presents a comparative analysis of flight data between December 2023 and November 2023. This comparison reveals a significant 7.67% decline in daily flight frequency during December compared to November. However, the reduction in total daily flight hours was less pronounced, registering a 2.97% decrease. On a positive note, the average flight duration per departure saw a 5.09% increase. Across all aircraft categories, a general decrease in activity was observed, with the Very Light Jet segment experiencing the most substantial drop at 14%.
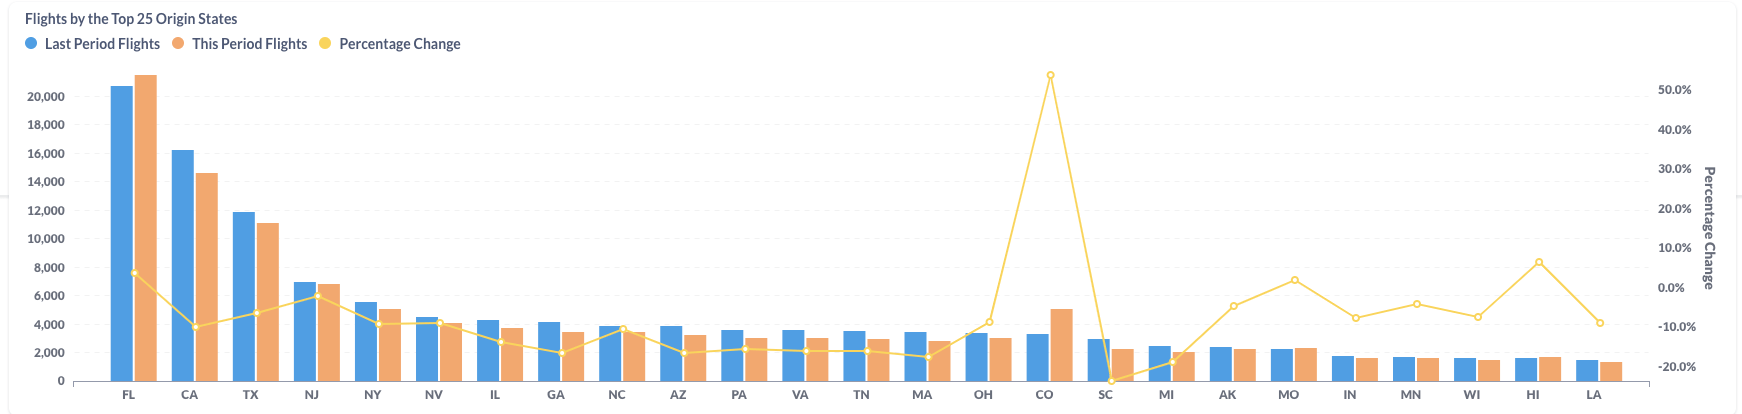
Figure 3: Comparison of the U.S. BizAv Flights by the Top 25 Origin States (This Month vs. Last Month)
Transitioning from November to December 2023, a majority of U.S. states experienced a downturn in aviation activity, with fewer states seeing an increase. Notably, Florida (FL) emerged as a standout exception, along with Colorado (CO), which recorded a significant 53.8% growth. This increase can be attributed to Florida’s appeal as a warm-weather destination and Colorado’s popularity for its skiing resorts.

Figure 4: Comparison of the U.S. BizAv Flights This Year vs. Last Year
Compared to December 2022, December 2023 saw a modest downturn in business aviation, with a 1.26% reduction in the total number of flights and a 1.4% decrease in cumulative flight hours. Within the spectrum of aircraft types, Very Light Jets were particularly impacted, showing a significant 34.1% decline, while Turboprop aircraft experienced an 11.3% decrease. In contrast, larger aircraft categories registered increases, with gains varying from 3.1% to 9.4%. This trend suggests a shift in customer preference towards larger aircraft compared to the previous year.
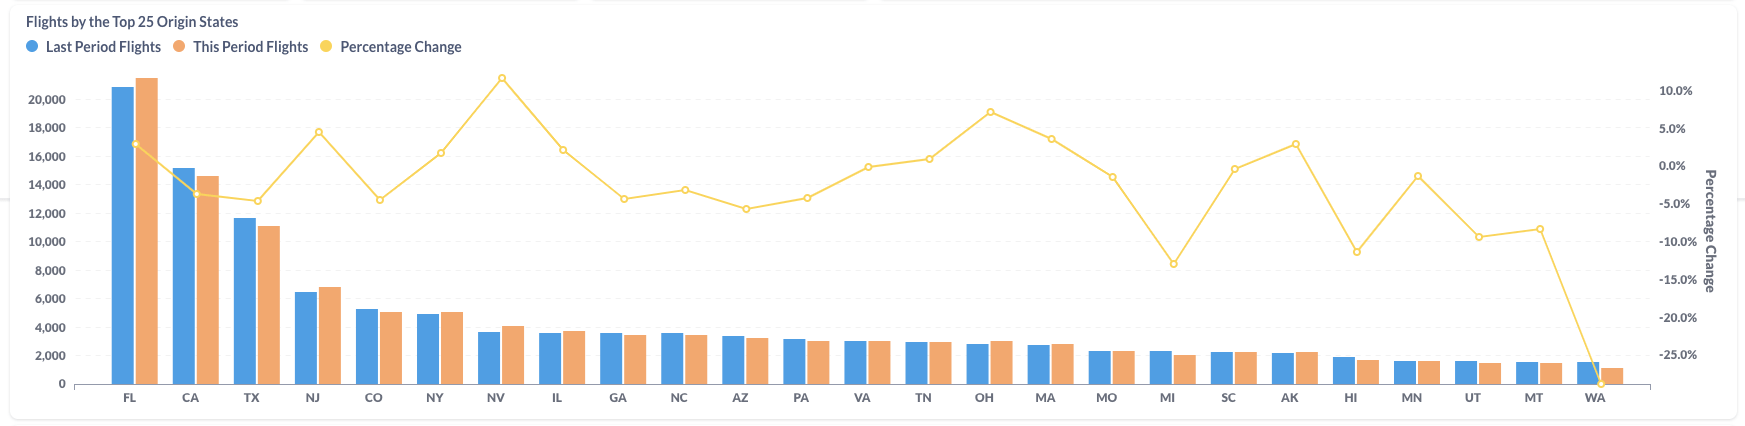
Figure 5: Comparison of the U.S. BizAv Flights by the Top 25 Origin States (This Year vs. Last Year)
In the comparison of flight data between December 2022 and December 2023, notable variations were observed across several large states. Florida (FL) and New Jersey (NJ) experienced an upturn in flight activity, with increases of 3.0% and 4.5%, respectively. Conversely, California (CA) and Texas (TX) saw a downturn, with declines of 3.7% and 4.6%, respectively.