The US BizAv (Business Aviation) market has been booming since March 2021. This series of articles track the traffic trend of this market. We define the BizAv market as part-135 on-demand for-hire private flying by business jets or certain turboprop planes. The numbers in the following charts exclude part-91 private flights. If you are interested in all flights by business jets, or detailed flights by route and operator, please get in touch with us.
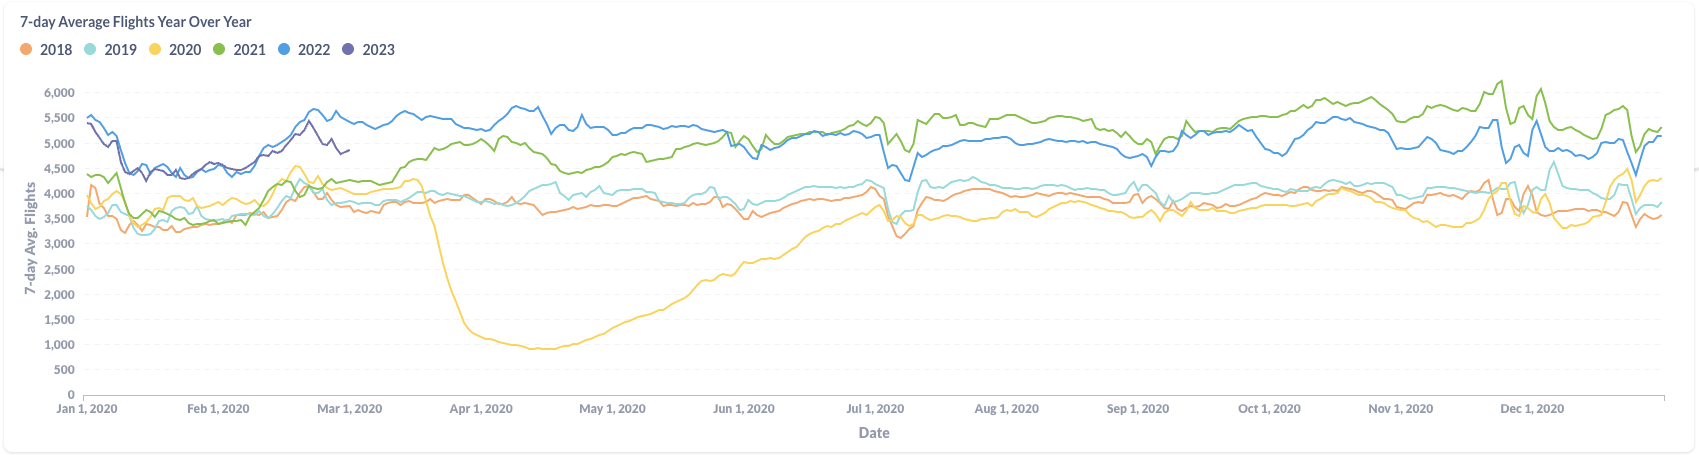
Figure 1: Year over Year Trend of the U.S. BizAv Market
As shown in Figure 1, the U.S. BizAv traffic in February 2023 has shown some slowdown compared with last year, especially in the end of the month. On average, there were 4,891 business flights per day in February, which is higher than the average of January 2023. The traffic was increasing before Feb. 20, similarly to last year. But the momentum was not held.
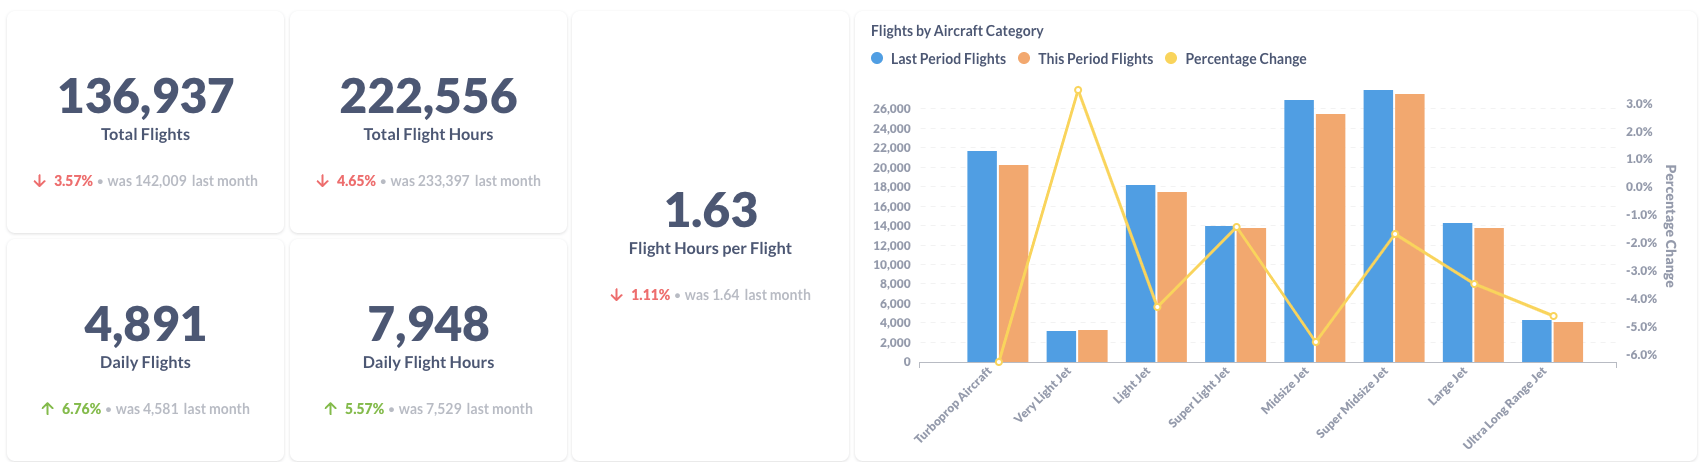
Figure 2: Comparison of the U.S. BizAv Flights This Month vs. Last Month
Figure 2 is a comparison between February 2023 and January 2023. The average daily flights and average daily flight hours increased by 6.76% and 5.57%, respectively. Total flights and flight hours decreased because there are only 28 days in this February. The number of flights decreased for all aircraft categories except for Very Light Jet, which had a 3.48% increase in the number of flights. The highest decrease was observed in the Turboprop Aircraft category, which experienced a 6.25% drop in the number of flights. The percentage change for the other categories ranged from -1.4% to -5.5%.
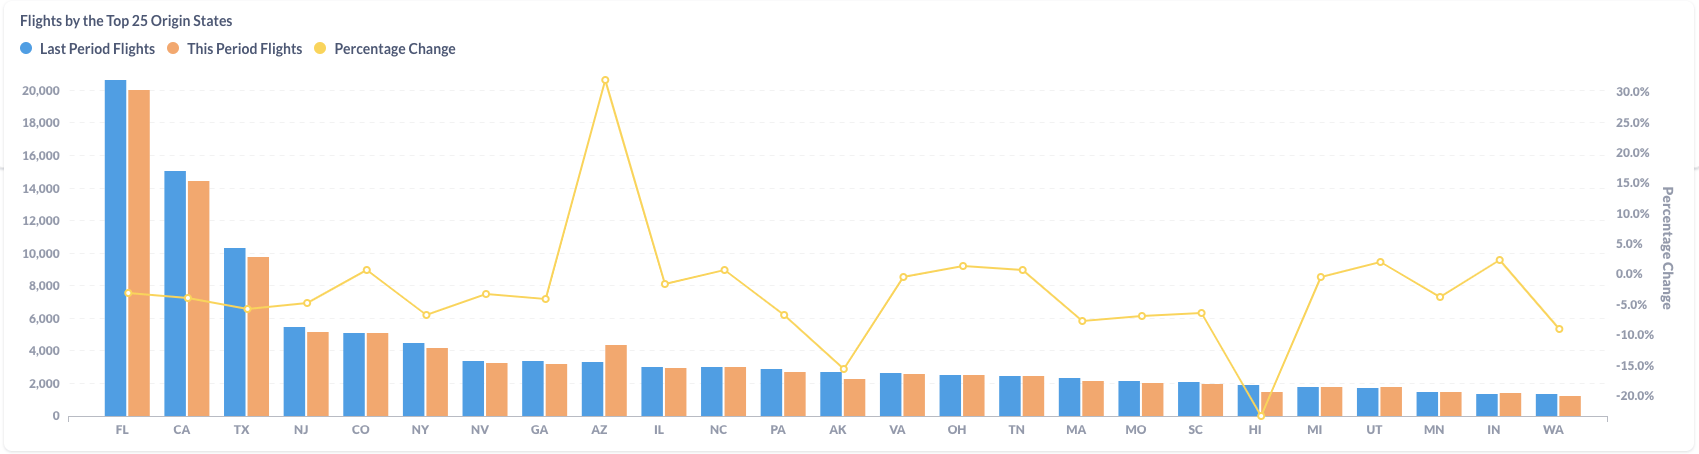
Figure 3: Comparison of the U.S. BizAv Flights by the Top 25 Origin States (This Month vs. Last Month)
There was a decrease in the total number of flights for most states, with the largest percentage changes occurring in Hawaii (-23.38%) and Alaska (-15.49%). Arizona was the only state that experienced an increase in the number of flights (+32.03%). Other notable changes in flight departures include Massachusetts (-7.67%), New York (-6.69%), Pennsylvania (-6.64%), and Texas (-5.72%), all of which saw a significant decrease in the number of flights departing. Colorado (+0.78%), Utah (+2.08%), Indiana (+2.36%), and Ohio (+1.47%) experienced slight increases.
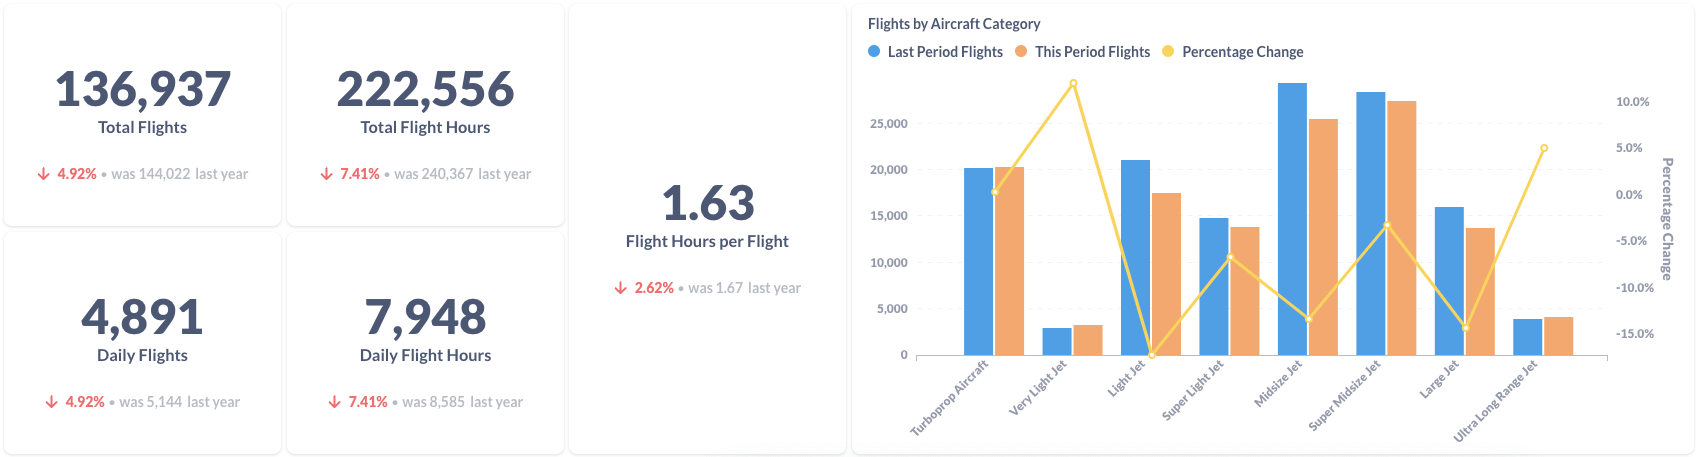
Figure 4: Comparison of the U.S. BizAv Flights This Year vs. Last Year
Compared to February 2022, total business flights in Feb 2023 decreased by 4.92%. Total flight hours dropped by 7.41% because the average flight hours per flight also shrank by 2.62%. The number of flights increased for Turboprop, Very Light Jet and Ultra Long Range Jet but decreased for other aircraft categories. Very Light Jet and Ultra Long Range Jet grew by 12.0% and 5.0%, respectively. The highest decrease was observed in the Light Jet category, which experienced a 17.28% drop in the number of flights. The percentage change in the number of flights for the other categories ranged from -3.2% to -14.3%.
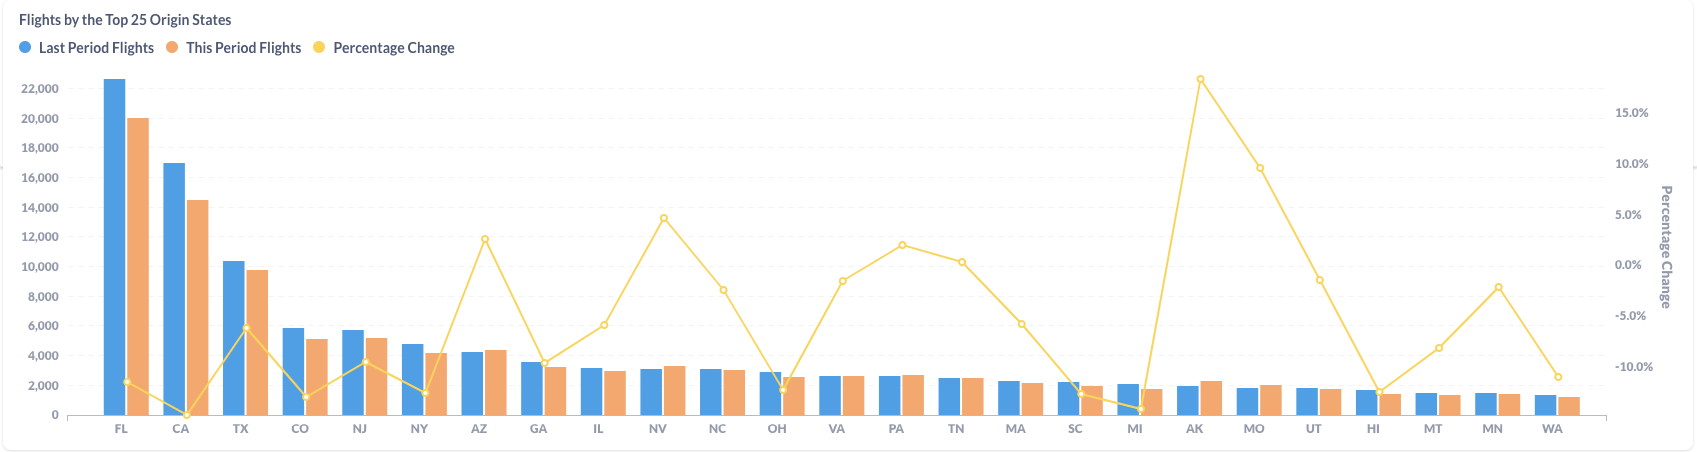
Figure 5: Comparison of the U.S. BizAv Flights by the Top 25 Origin States (This Year vs. Last Year)
In February 2023, Florida still had the highest number of flights, followed by California and Texas. Alaska had the largest increase in the number of flights, while California had the largest decrease. Overall, most states had a decrease in the number of flights between February 2022 and February 2023.