Traffic and fare data by airline and route can provide valuable insights into market trends, demand, and competition. By analyzing this data, airlines can optimize their pricing strategies, plan their capacity, and make informed decisions about their route network. The data can also be used for market and competitive analysis, helping airlines identify profitable routes and gain a competitive advantage.
According to preliminary true O&D level data released by FlightBI this week, the air traffic from December 2022 to January 2023 saw an increase, and the average airfare showed a slight decrease. Specifically, US domestic passenger volume increased by 1.6%, and the average domestic airfare decreased by 3.7%.
Volume Trend
According to the true O&D data, US domestic traffic witnessed an increase from 44.8 million passengers in December to 45.5 million in January 2023, which is higher than the pre-pandemic level of 44.6 million in January 2020. Additionally, US international traffic also increased from 14.5 million in December to 17.2 million in January.
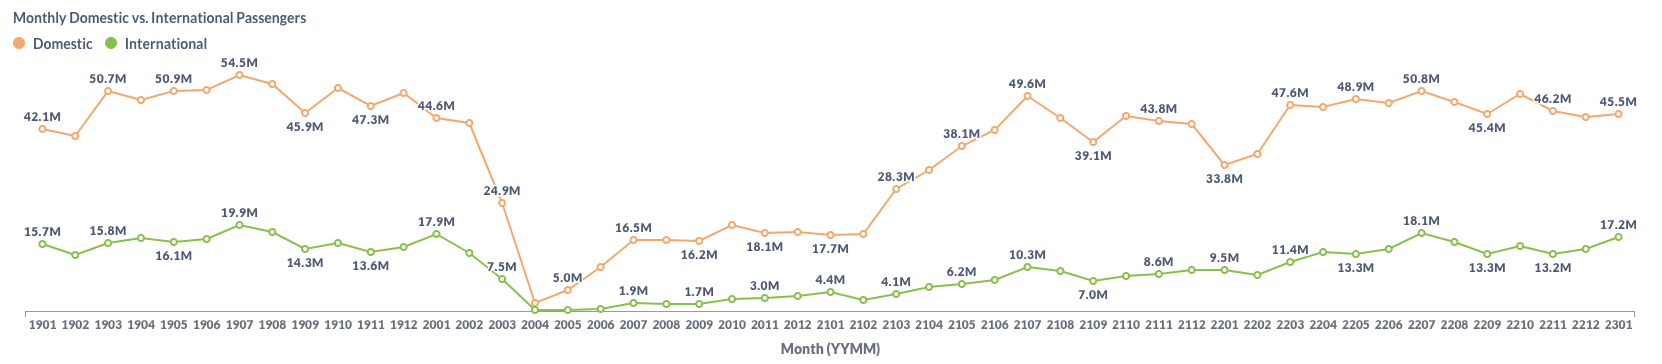
Figure 1: US Domestic and International Air Traffic by Month
Airfare Trend
The average domestic gross fare for air travel decreased from $214 in December to $206 in January, and the average net fare also decreased from $185 to $178 over the same period.
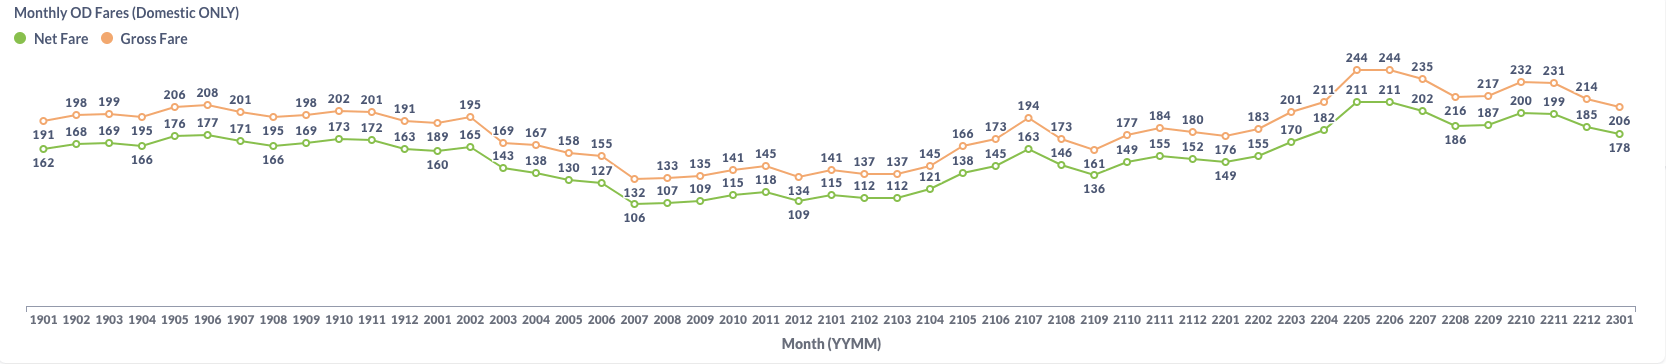
Figure 2: US Domestic Average Airfare by Month
The correlation relationship between airfare and jet fuel price in this period is not strong. As depicted in the chart below provided by EIA, the price of jet fuel increased from December 2022 to January 2023, but it saw a significant drop towards the end of January,
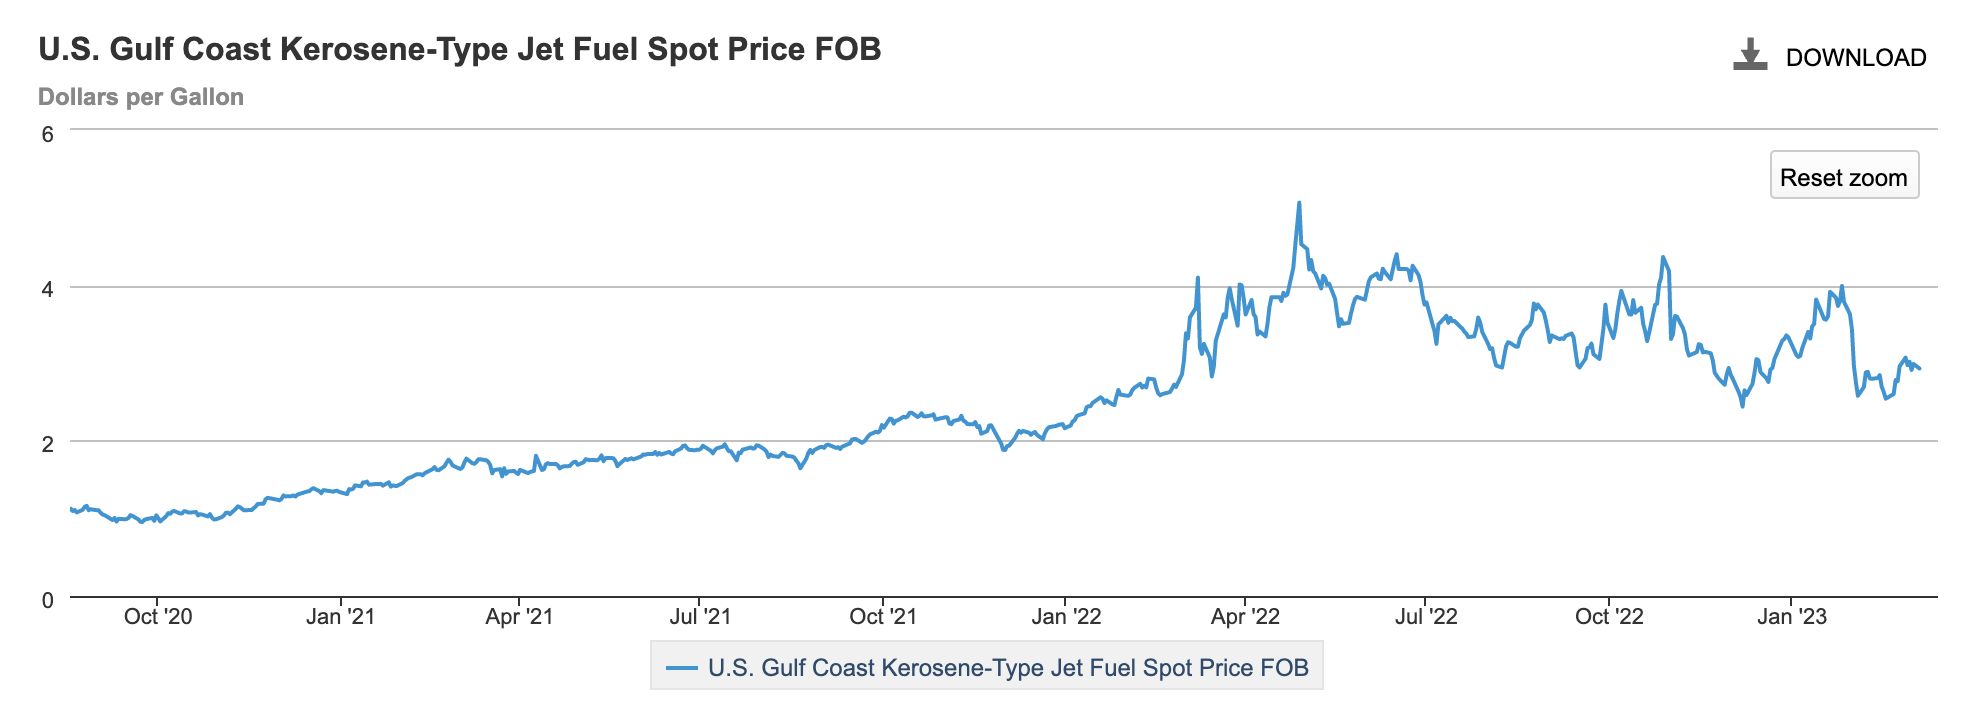
Figure 3: US Jet Fuel Price
Load Factor Trend
In January, the average load factor dropped to 75.1%, indicating a decline in the number of passengers per flight. As depicted in Figure 4 below, this decrease in the load factor was primarily due to traffic slowdown. Southwest Airlines continues to face challenges due to the scheduling crisis in December 2022, as many travelers have been hesitant to book flights with the airline.
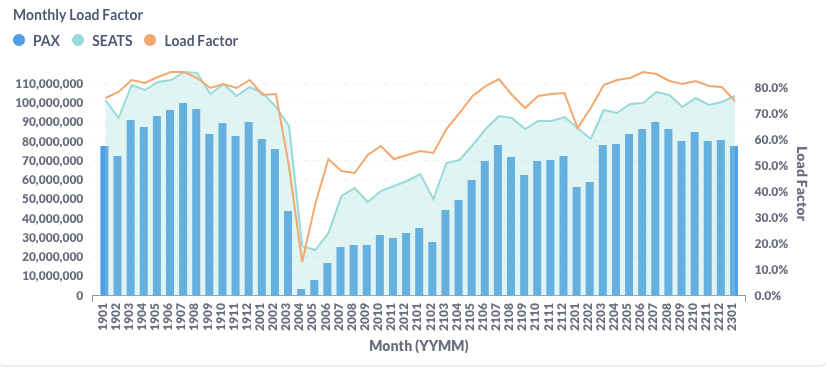
Figure 4: US Airlines’ Average Load Factor by Month
Month Over Month Comparison
During the period from December 2022 to January 2023, Allegiant (G4) witnessed a significant drop in traffic. Meanwhile, Southwest’s traffic was recovered with a 9.9% growth from December to January. Two other LCCs – Spirit (NK) and Frontier (F9) – also experienced a healthy growth at 11.2% and 12.4%, respectively.
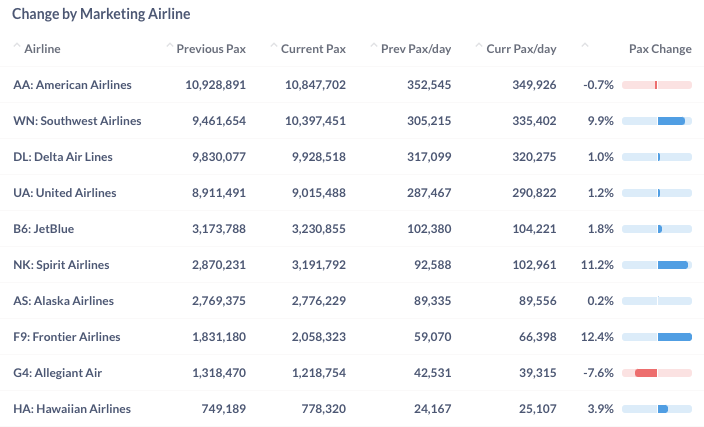
Figure 5: Air Traffic by Dominant Marketing Airlines in January 2023 (Current) vs. December 2022 (Previous)
In January 2023, some top airports saw an increase in traffic compared to December 2022 while others saw the opposite. Ft. Lauderdale (FLL), Miami (MIA) and Phoenix (PHX) experienced above 10% growth in traffic during this period. Conversely, San Francisco (SFO), Seattle (SEA) and Dallas/Fort Worth (DFW) had 4-6% decrease in traffic.
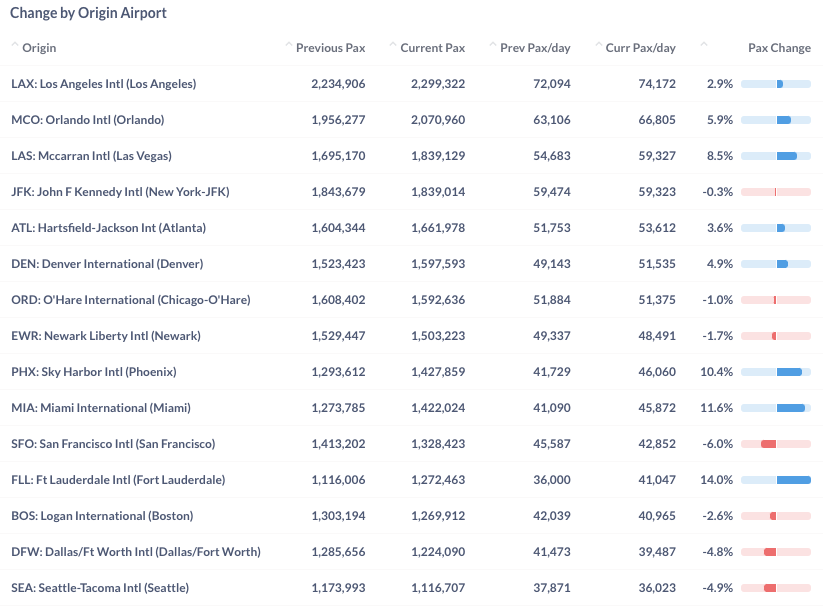
Figure 6: Air Traffic by Top Origin Airports in January 2023 (Current) vs. December 2022 (Previous)
Year Over Year Comparison
Compared to the same month last year, all major US airlines witnessed positive growth in January 2023. Among them, JetBlue (B6), Hawaiian (HA) and United (UA) achieved the highest year-over-year growth rate of 48.7%, 47.1%, and 46.2%, respectively, leading the growth among major US airlines.
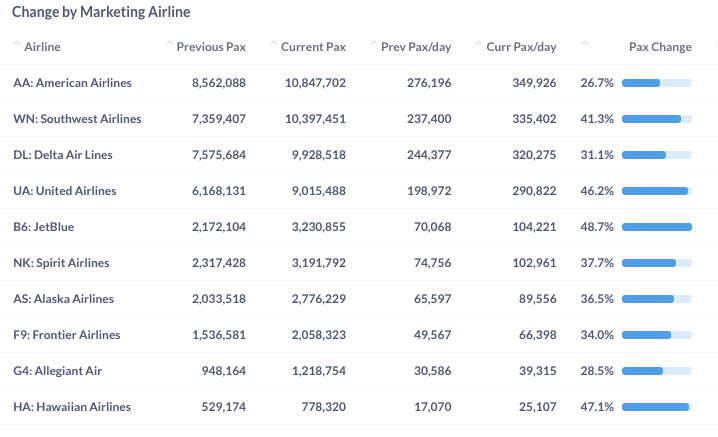
Figure 7: Air Traffic by Dominant Marketing Airlines in January 2023 (Current) vs. January 2022 (Previous)
The growth of top airports from January 2022 to January 2023 has been very impressive, with all top airports achieving double-digit growth. Among them, San Francisco (SFO), Boston (BOS), and New York (JFK) airports led the year-over-year growth, with 78.7%, 68.6%, and 68.2%, respectively.
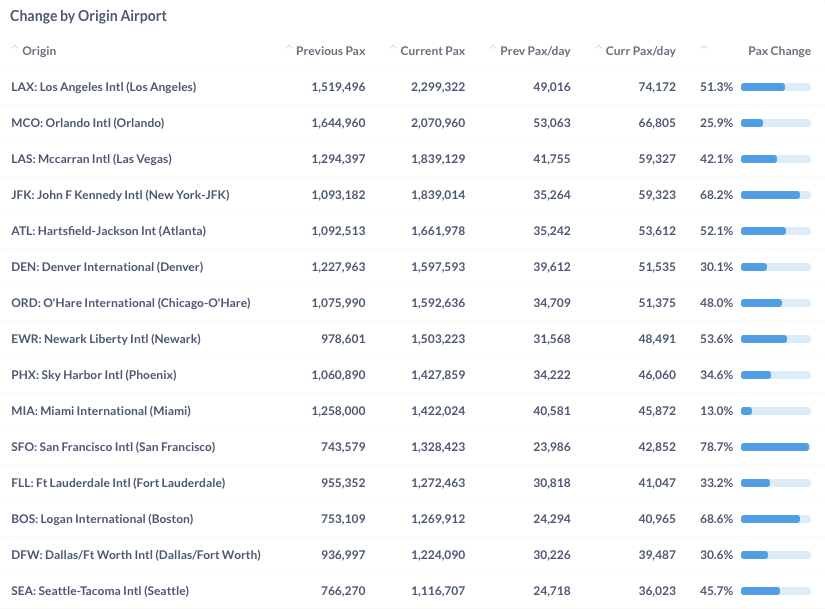
Figure 8: Air Traffic by Top Origin Airport in January 2023 (Current) vs. January 2022 (Previous)
For more detailed information on traffic and fares by route and airline, please contact service@flightbi.com or request a demo of Fligence USOD. They will be able to provide you with customized information to meet your specific needs and requirements.