US airlines had a very good month in March 2022! The preliminary true O&D level data released by FlightBI today shows that both pax volume and average fare were increased significantly from February 2022 to March 2022.
Volume Trend
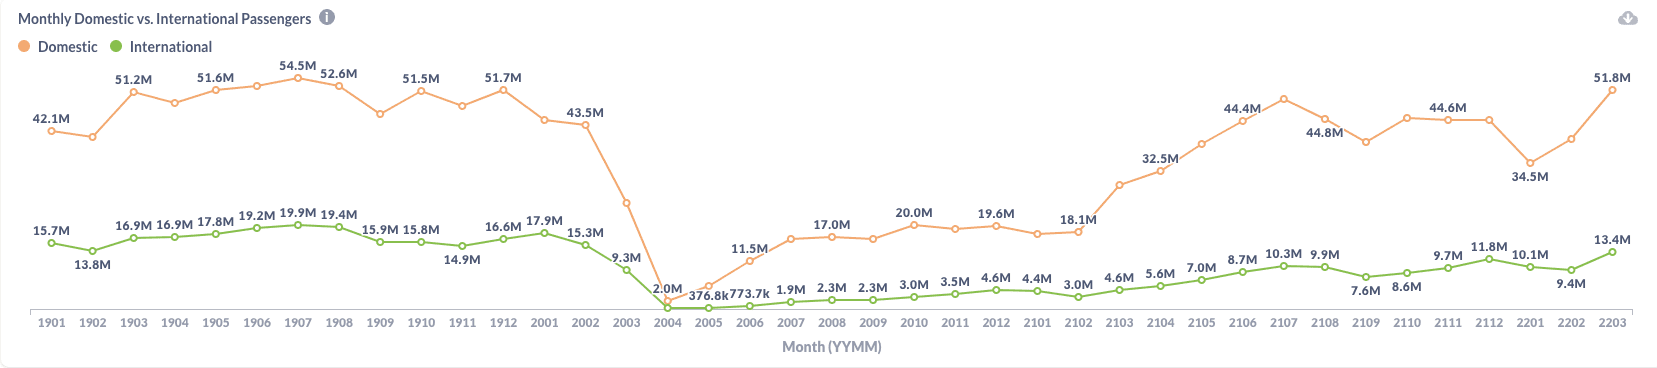
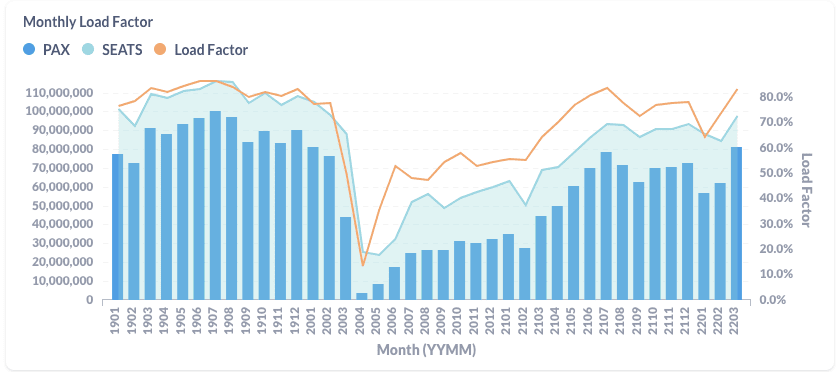
US domestic traffic jumped from 40.1 million passengers by true O&D in February to 51.8 million in March. That’s a 29% increase! This value is not only much higher than the same month in 2020 and 2021, but also exceeds the pre-pandemic level. The US international traffic was also increased from 9.4 million to 13.4 million. Although the international traffic has not yet reached the pre-pandemic level, it is a dramatic boost from the previous month too.
Fare Trend
Both gross fare and net fare climbed up. The domestic average gross fare increased from $184 in February to $203 in March by 10%. Similarly, the average net fare grew from $155 to $171.
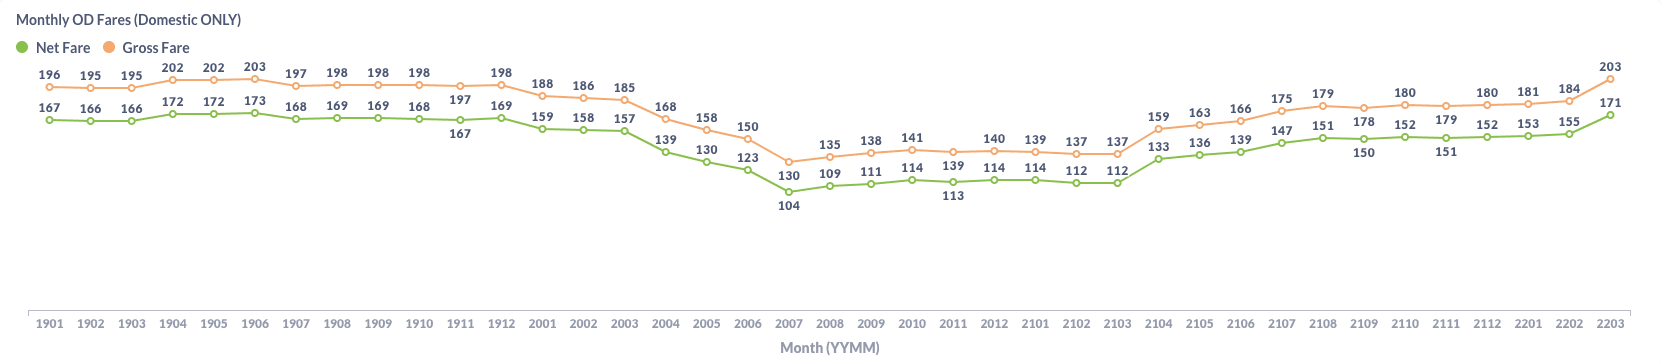
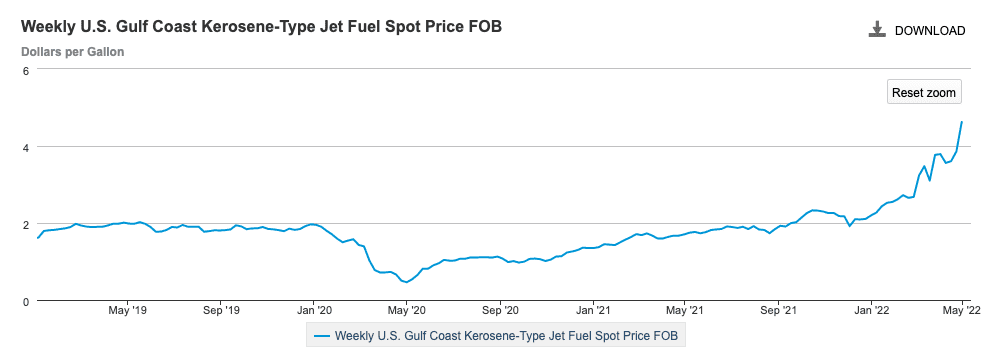
The fare increase is partially because of the inflation of jet fuel price, as shown in the chart below provided by EIA. In fact, the average air fare in April escalated too. Not a good news for air travelers!
Load Factor Trend
US airlines have added more capacity in March. But traffic grew faster, leading to an improvement of the load factor. On average, the load factor of US carriers has increased from 73.6% in February to 83.2% in March, very close to the load factor level in 2019.
Month Over Month Comparison
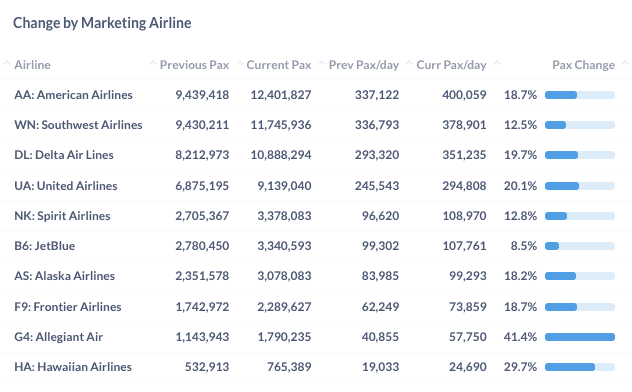
All large US airlines carried more passengers in March than in February. The leisure airline Allegiant Air had the highest growth of 41.4%, followed by Hawaiian Airlines. The big four – AA, WN, DL and UA all achieved a two digit volume growth. Interestingly, legacy carriers such as AA, DL and UA had higher growth than LCCs like WN, NK, F9 and B6.
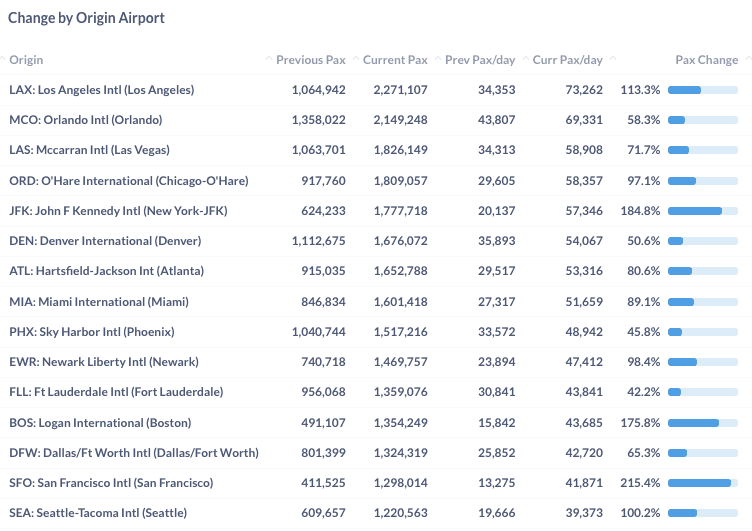
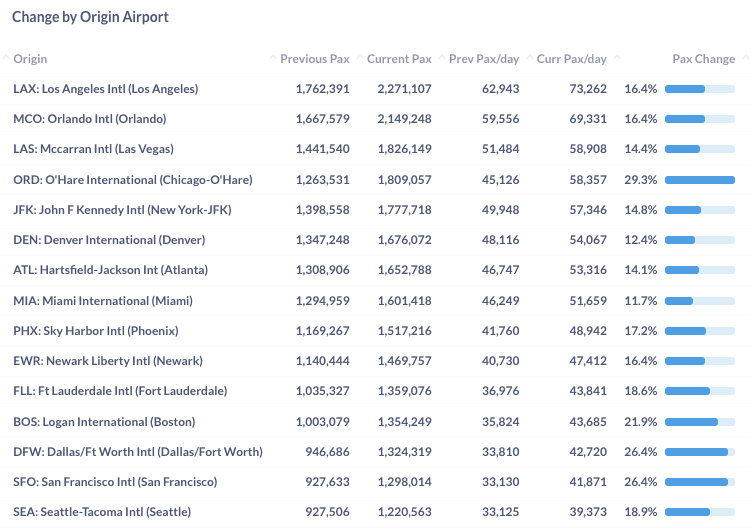
Among top 15 airports, ORD (Chicago), DFW (Dallas) and SFO (San Francisco) grew traffic by 29.3%, 26.4% and 26.4%, respectively, from February. MIA (Miami) and DEN (Denver) had the least growth, albeit also above 10%.
Year Over Year Comparison
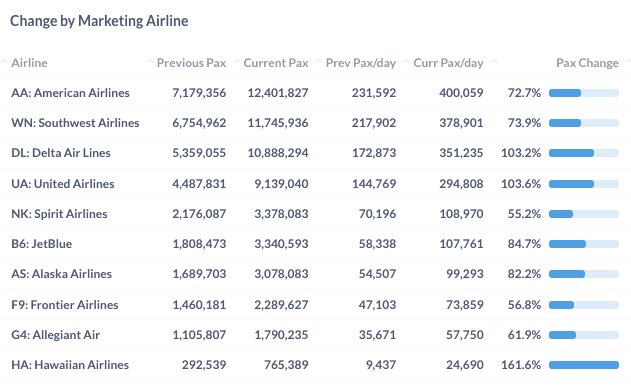
Compared to the same month last year, all airlines had fantastic performance. Hawaiian Airlines increased volume by 161.6%. DL and UA also doubled passengers carried. There is no doubt that the industry is moving to a good direction!
Three airports with the highest traffic growth from last year are SFO (San Francisco), JFK (New York) and BOS (Boston). All those airports have a good portion of international traffic and business travelers. That’s another good news for airlines because those passengers usually bring more profit to the carriers.