Daily and hourly airport traffic is crucial for businesses related to airports, including airport authorities, airlines, retailers, ground handlers, rental car companies, and hotels. If you belong to any of these industries, utilizing daily airport traffic data can help you plan your operations, schedule your resources, forecast revenue, and plan budgets more accurately. Additionally, this data can help you target your marketing and promotional efforts more specifically, leading to more effective business strategies.
FlightBI collects and normalizes the airport passenger throughput data from US Transportation Security Administration (TSA). In addition, it has developed a product called Fligence TSA, which features a wide variety of data visualizations. FlightBI is currently offering a two-week, no-obligation trial of Fligence TSA for you to explore valuable insights from the airport traffic data.
This article summarizes US air traffic using the aforementioned tool, utilizing actual airport-level data as of Jun 30, 2024. Our analysis will examine trends in different segments of air travel, such as domestic versus international flights and leisure versus business travel. To learn more about the specific airports chosen to represent these markets, please refer to this article.
US Overall Airport Traffic Status
In 2024, US airport traffic showed robust growth, with daily passenger numbers consistently exceeding previous years’ figures by 5-10% throughout June, as shown in Figure 1. Starting from mid-February 2024, US air traffic surged to its highest levels in five years. Forecasts indicate this growth momentum is expected to continue through the summer.
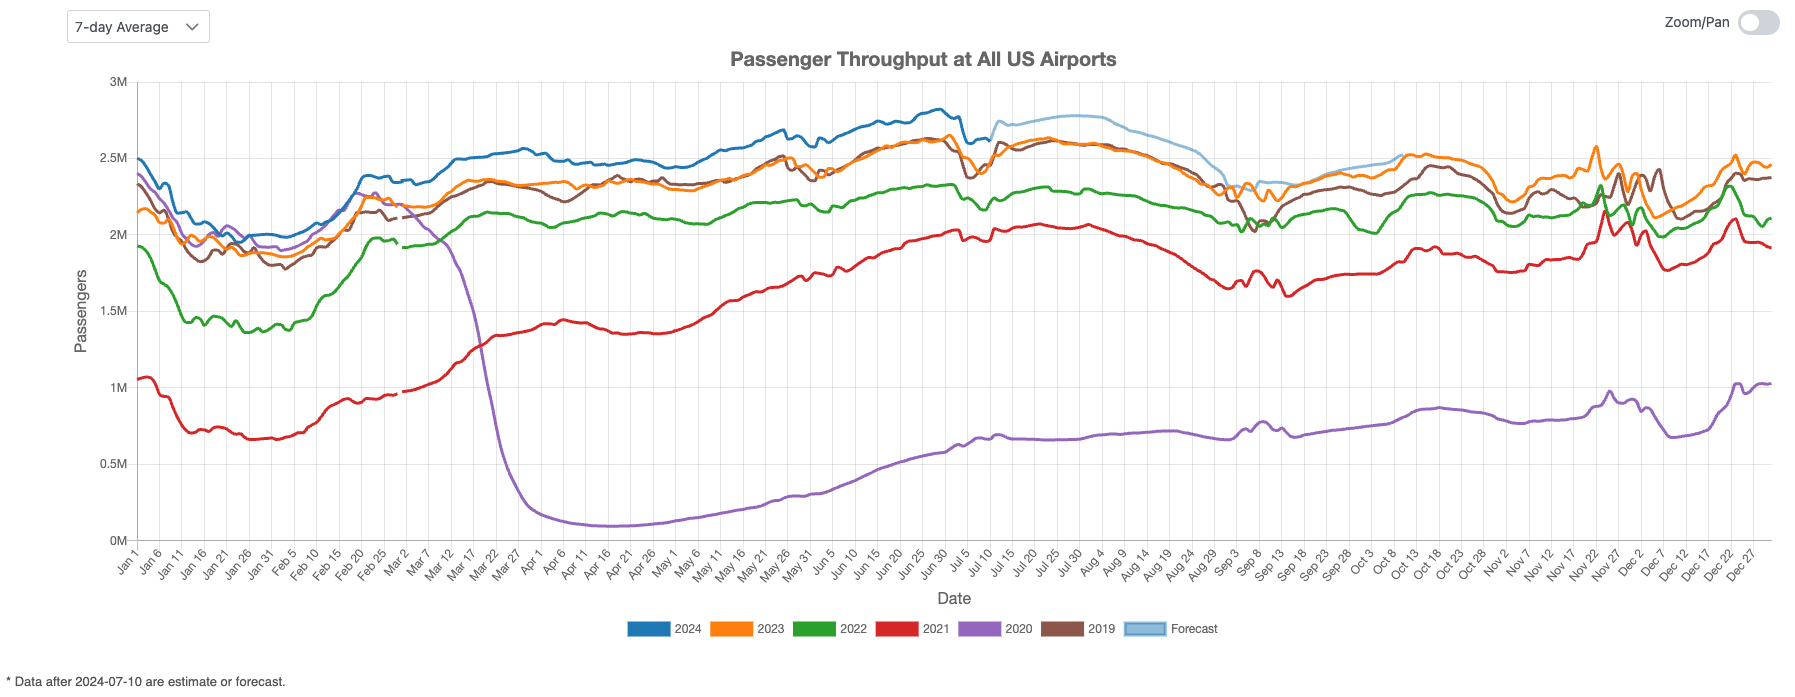
Figure 1: US Overall Air Traffic Trend
Domestic Airport Traffic Indicator
Figure 2 shows a consistent increase in U.S. domestic air travel throughout June, with traffic slightly lower in the middle compared to the ends. Following the July 4th holiday, traffic is anticipated to slow down briefly before peaking towards the end of July. Forecasts predict that domestic air traffic will exceed previous years’ levels by 10% during the summer season.
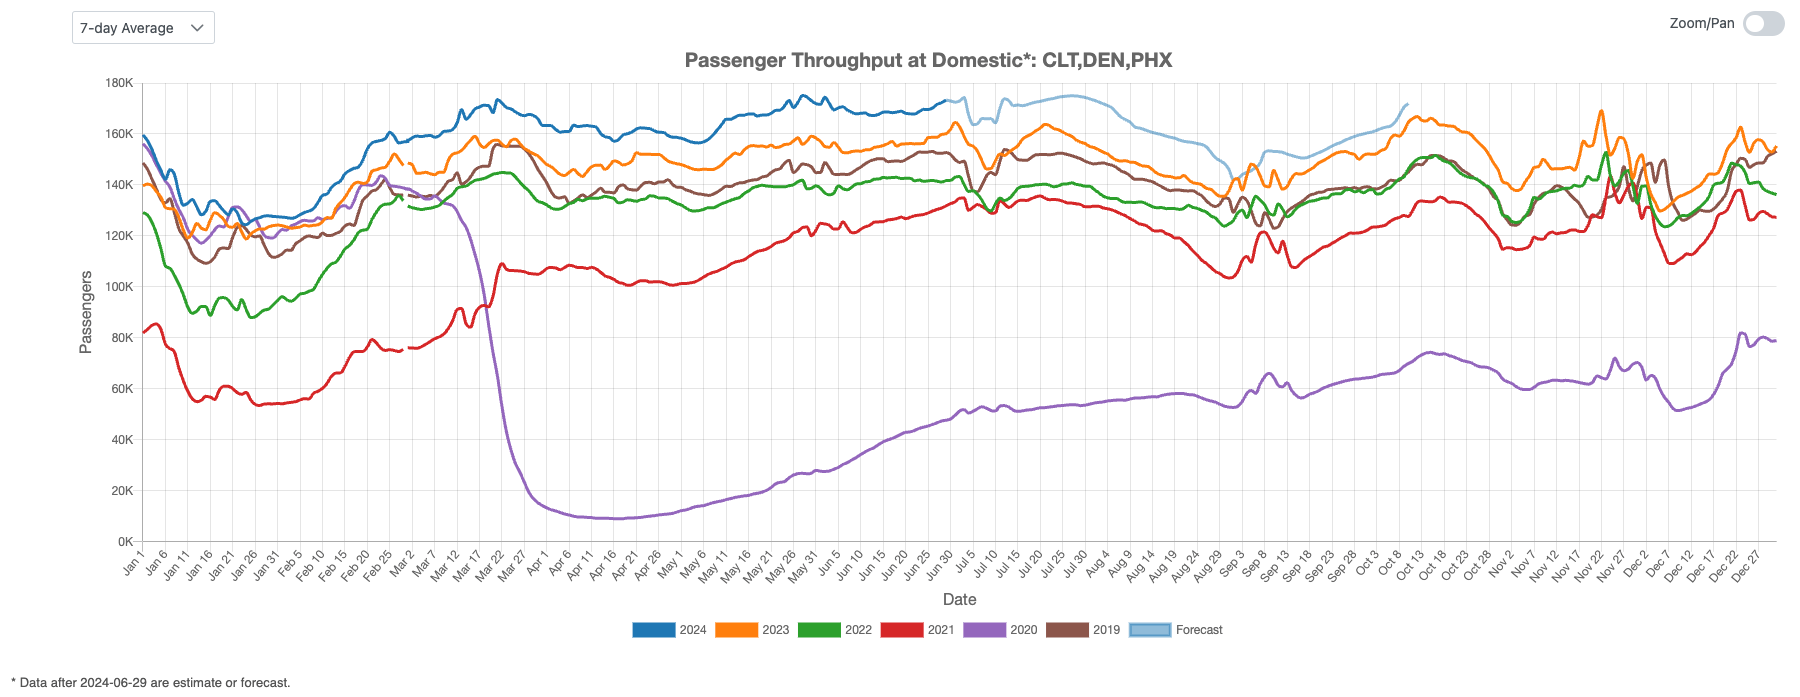
Figure 2: US Domestic Air Traffic Indicator
International Airport Traffic Indicator
Figure 3 illustrates the U.S. international air traffic index for June 2024, showing a return to 2019 levels throughout the month. International traffic has now fully recovered to pre-COVID levels. Projections indicate that U.S. international air traffic will surpass 2019 levels within the next three months.
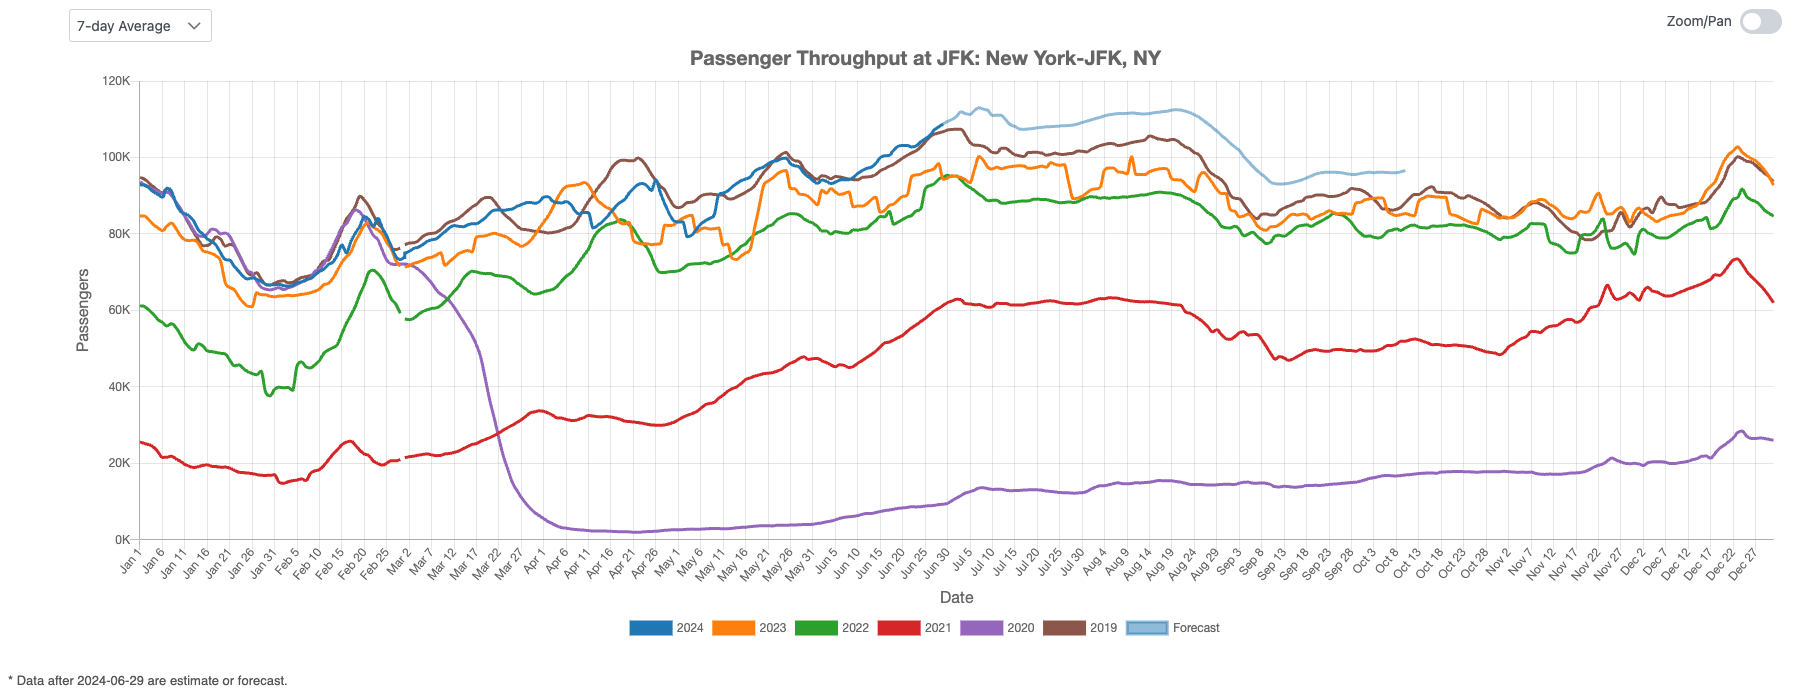
Figure 3: US International Air Traffic Indicator
Leisure Air Traffic Indicator
Figure 4 highlights the current state of the U.S. leisure air travel market. In June 2024, leisure traffic shows signs of cooling down, though remaining above last year’s levels. Forecasts suggest a slight rebound during the summer followed by a decline in September.
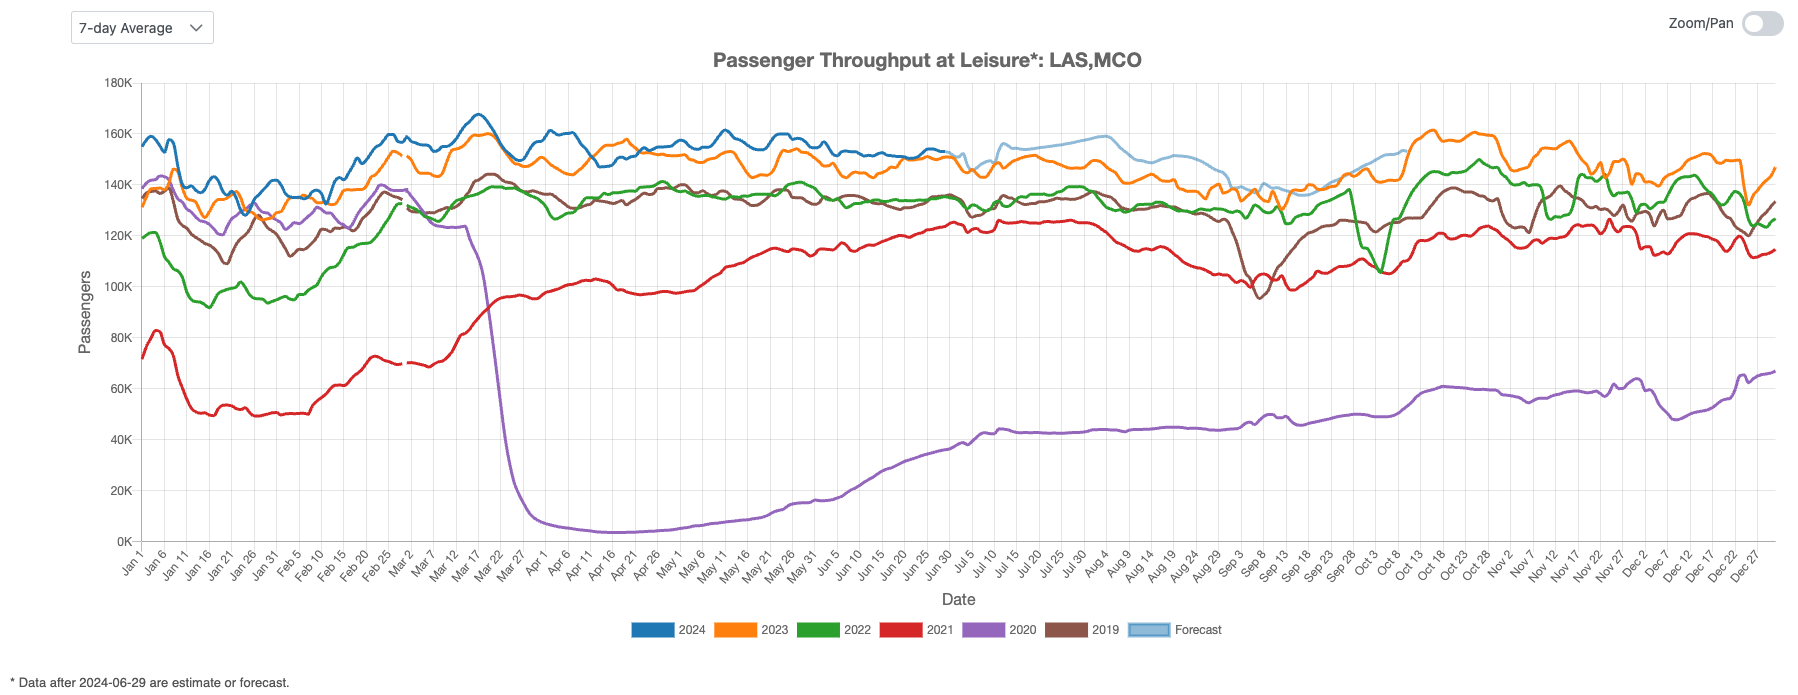
Figure 4: US Leisure Air Traffic Indicator
Business Air Traffic Indicator
Figure 5 depicts the resurgence of business travel in June 2024, showing a gradual increase leading into the summer. Projections suggest that within the next three months, business travel will reach levels not seen in recent years, although momentum may taper off after the summer.
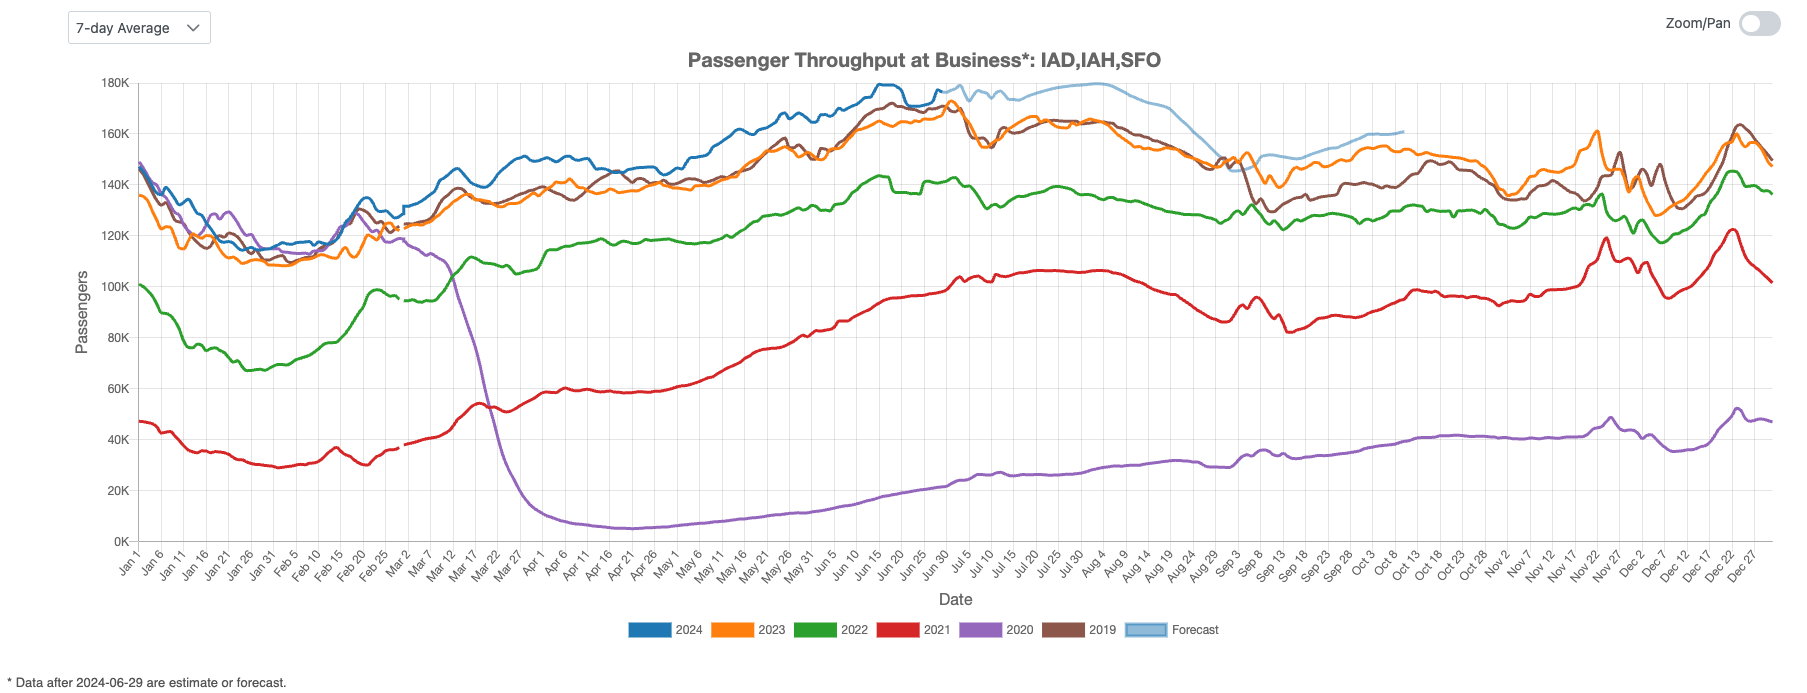
Figure 5: US Business Air Traffic Indicator
In 2024, US air traffic exhibited robust growth with domestic and international sectors returning to pre-COVID levels. Leisure travel, while cooling in June, remained above previous year levels. Business travel showed a steady increase, poised to reach new highs in the coming months but may decline after summer.