Traffic and fare data by airline and route can provide valuable insights into market trends, demand, and competition. By analyzing this data, airlines can optimize their pricing strategies, plan their capacity, and make informed decisions about their route network. The data can also be used for market and competitive analysis, helping airlines identify profitable routes and gain a competitive advantage.
Based on initial true O&D level data from FlightBI released this week, there has been a notable surge in US domestic air travel in March 2024 compared to the previous month. While the growth in US international air travel was not as rapid as domestic travel, it still showed promise. Additionally, there was a slight uptick in average airfares during this timeframe.
Volume Trend
In March 2024, domestic passenger numbers rose from 46.1 million in February to 54.1 million, showing a 6.7% increase compared to March 2023’s figure of 50.7 million passengers. Meanwhile, the international sector also saw a growth, with passenger numbers increasing from 17.5 million in February to 21.4M in March 2024.
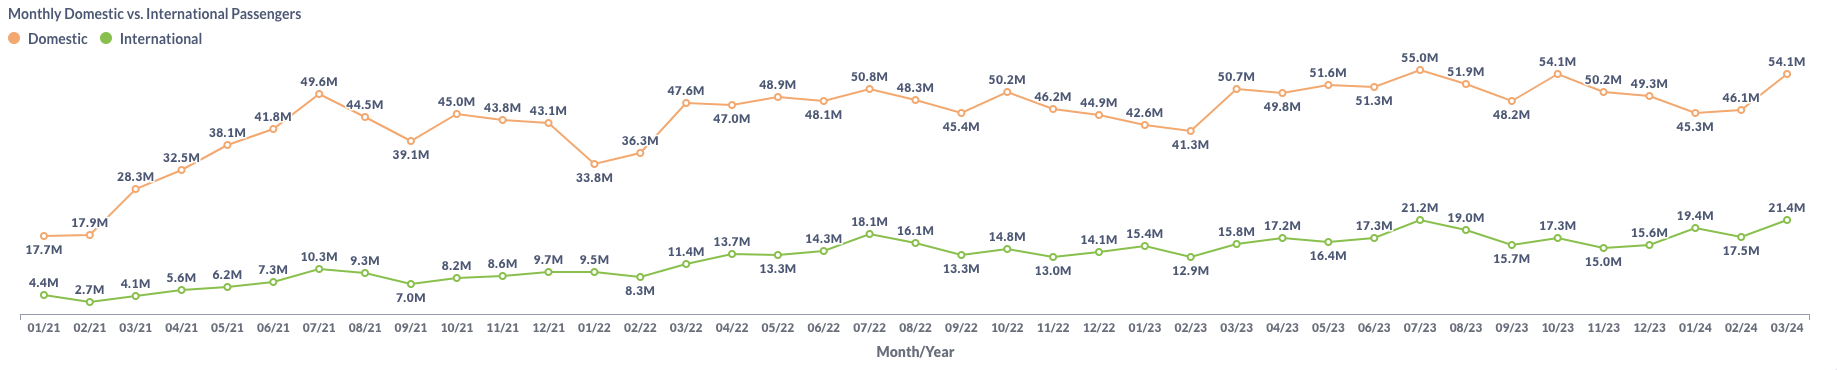
Figure 1: US Domestic and International Air Traffic by Month
Airfare Trend
The most recent data shows a slightly increase in airfare trends. The average gross fare for flights rose to $213 from $211 in February. Similarly, the average net fare increased from $181 to $183 during the same period.
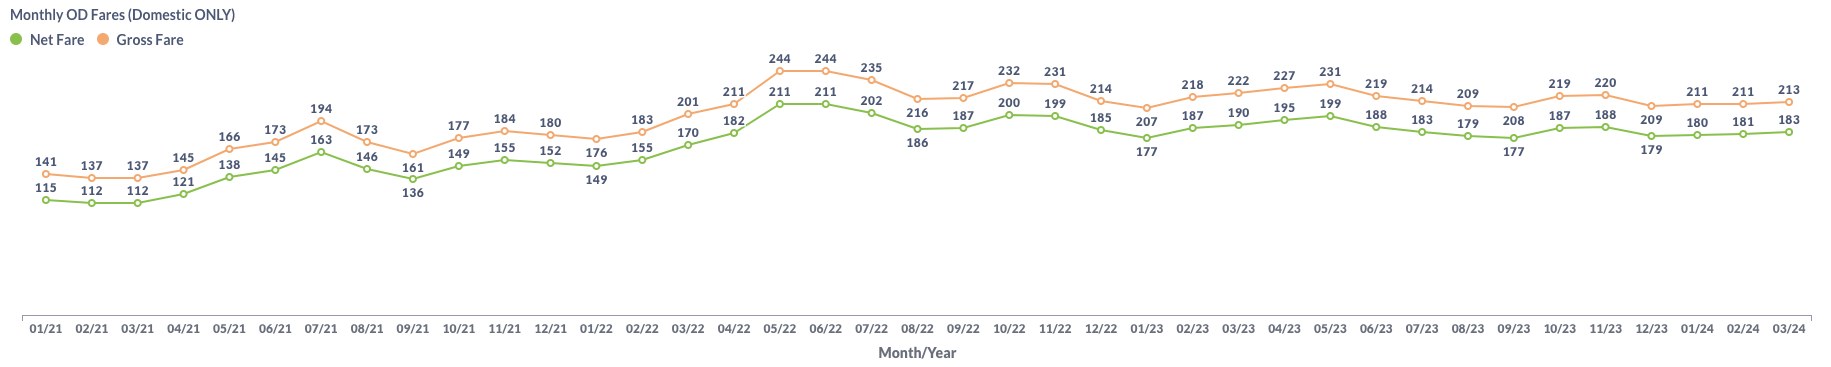
Figure 2: US Domestic Average Airfare by Month
Load Factor Trend
In March 2024, both Available Seat Miles (ASM) and Revenue Passenger Miles (RPM) saw significant increases compared to February 2024. The resulted in a higher average load factor for major US airlines, rising from 78.0% in February to 81.8% in March, as illustrated in Figure 3. This increase still places the average load factor below the load factor of 83.1% recorded in March 2023.
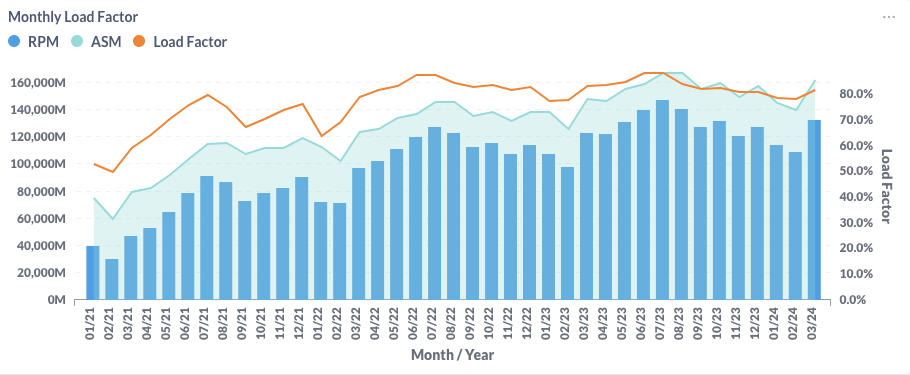
Figure 3: US Airlines’ Average Load Factor by Month
Month Over Month Comparison
In March 2024, all major US airlines except Hawaiian (HA) experienced a rise in daily traffic compared to February 2024. Allegiant Air (G4) and Southwest Airlines (WN) notably led this increase, showing impressive growth rates of 19.3% and 15.1%, respectively.
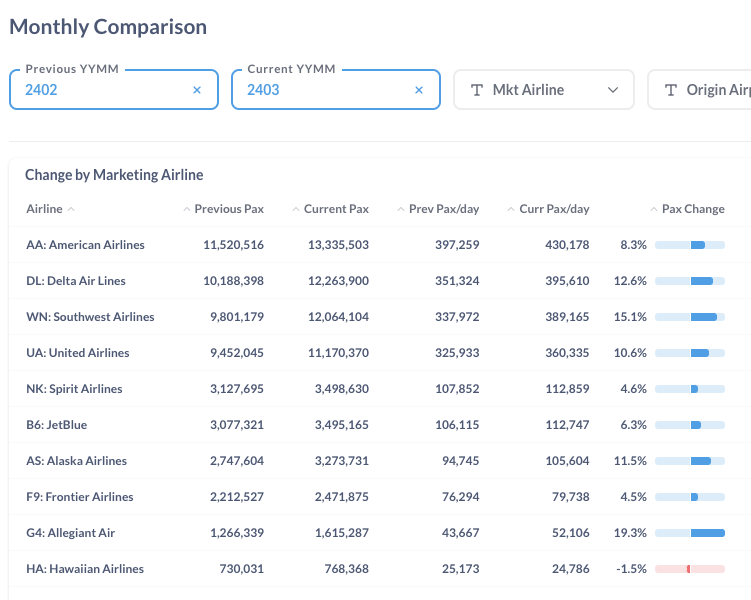
Figure 4: Air Traffic by Dominant Marketing Airlines in February 2024 (Previous) vs. March 2024 (Current)
In that timeframe, most major airports experienced an increase in daily traffic. Chicago (ORD), Phoenix (PHX), and Denver (DEN) stood out with month-to-month growth rates of 16.9%, 14.3%, and 13.0%, respectively.
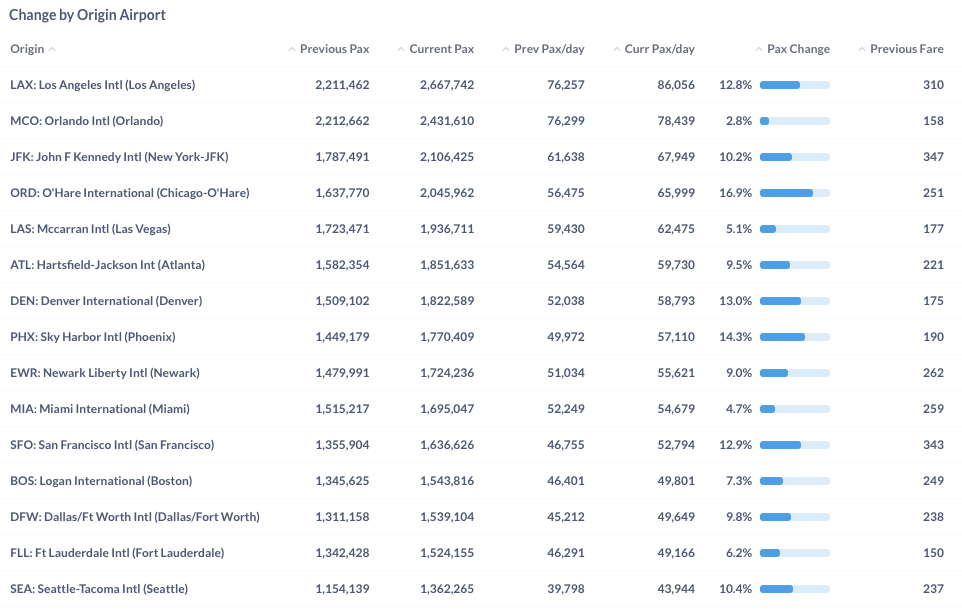
Figure 5: Air Traffic by Top Origin Airports in February 2024 (Previous) vs. March 2024 (Current)
Year Over Year Comparison
The year-over-year comparison from March 2023 to March 2024 demonstrates a generally positive growth trend across major US airlines. United Airlines (UA), American Airlines (AA), and Delta Air Lines (DL) spearheaded this upward trajectory with strong growth rates of 16.1%, 10.5%, and 9.7%, respectively, highlighting their substantial impact on the industry’s positive momentum. Conversely, JetBlue (B6) and Hawaiian Airlines (HA) recorded a slight loss (-0.4% and -0.2%, respectively), compared to the previous year.
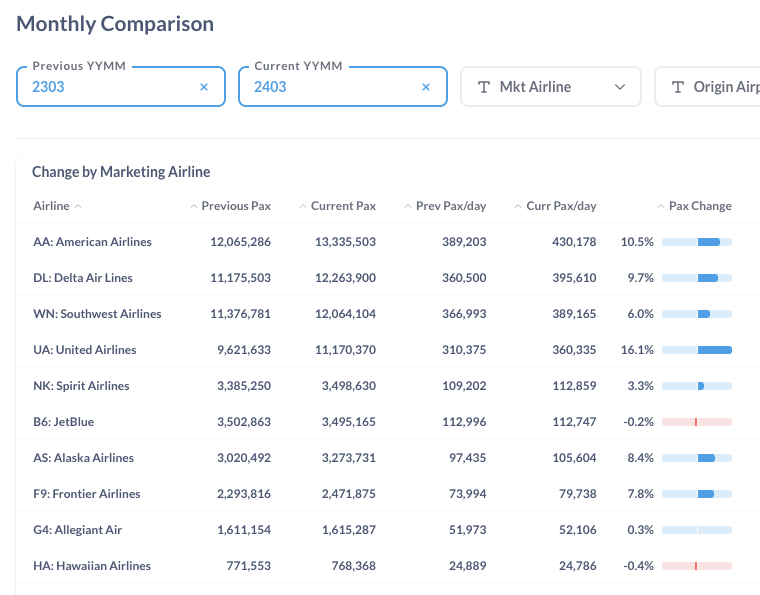
Figure 6: Air Traffic by Dominant Marketing Airlines in March 2024 (Current) vs. March 2023 (Previous)
From March 2023 to March 2024, most major airports experienced an increase in traffic. Miami (MIA), John F. Kennedy (JFK) in New York, and Dallas/Fort Worth (DFW) led this year-over-year growth, with notable expansions and traffic increases of 22.2%, 20.1%, and 18.1%, respectively. In contrast, Denver (DEN) and Las Vegas (LAS) saw more moderate growth rates of 4.2% and 2.2%, respectively.
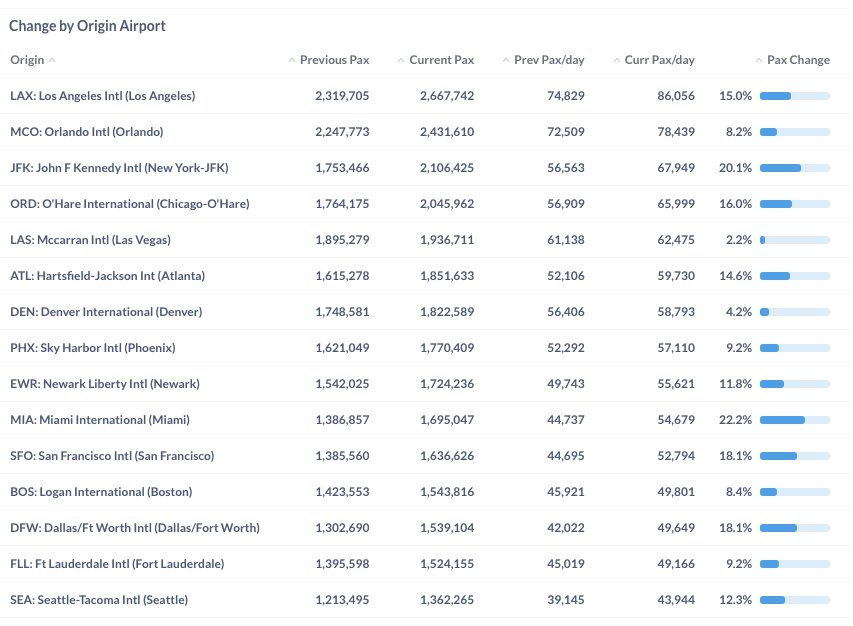
Figure 7: Air Traffic by Top Origin Airport in March 2024 (Current) vs. March 2023 (Previous)
For more detailed information on traffic and fares by route and airline, please contact service@flightbi.com or request a demo of Fligence USOD. They will be able to provide you with customized information to meet your specific needs and requirements.