Traffic and fare data by airline and route can provide valuable insights into market trends, demand, and competition. By analyzing this data, airlines can optimize their pricing strategies, plan their capacity, and make informed decisions about their route network. The data can also be used for market and competitive analysis, helping airlines identify profitable routes and gain a competitive advantage.
According to preliminary true O&D level data released by FlightBI this week, the air traffic increased significantly from February 2023 to March 2023 because March has 3 days more than February and there is a healthy growth year over year. Specifically, US domestic passenger volume increased by 19%, and the average domestic airfare increased by 7%.
Volume Trend
The US air market displayed an upward trend in passenger volume according to the latest Origin and Destination (O&D) data. In March 2023, US domestic air travel registered 51.3 million passengers, a notable rise from 43.2 million in February. This not only signifies a significant month-on-month increase but also surpasses the pre-pandemic passenger count of 50.7 million recorded in March 2019. Concurrently, the international sector of the US air market experienced an upward trajectory, with passenger volume growing from 14.4 million in February to 18.6 million in March 2023.
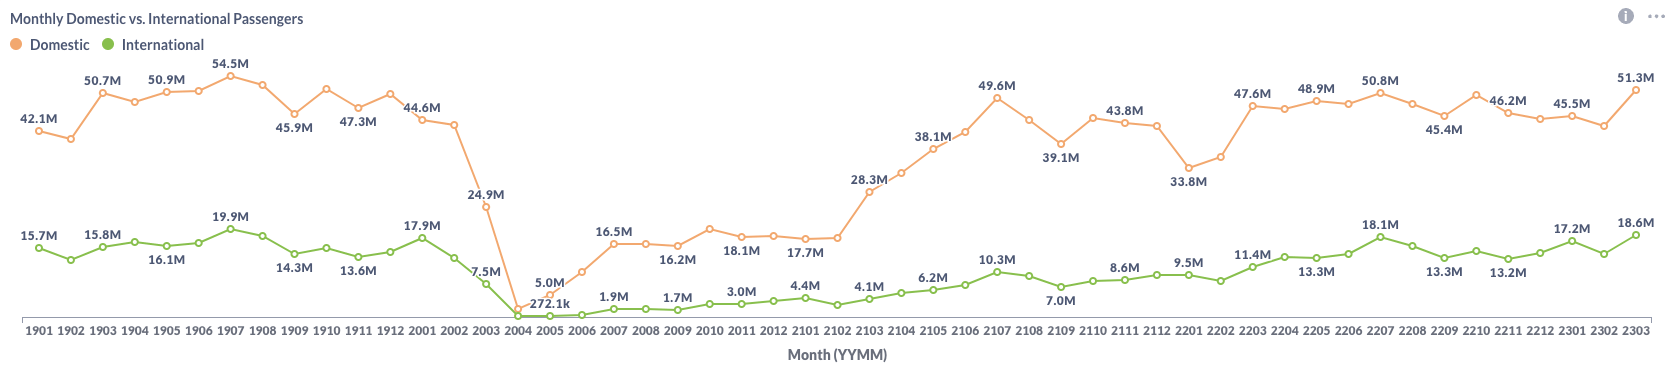
Figure 1: US Domestic and International Air Traffic by Month
Airfare Trend
Airfare trends in the domestic market have shown an increase, as evidenced by the average gross fare for air travel, which rose from $209 in February to $223 in March. Simultaneously, the average net fare demonstrated a similar upward trend, escalating from $180 to $192 during the same time frame.
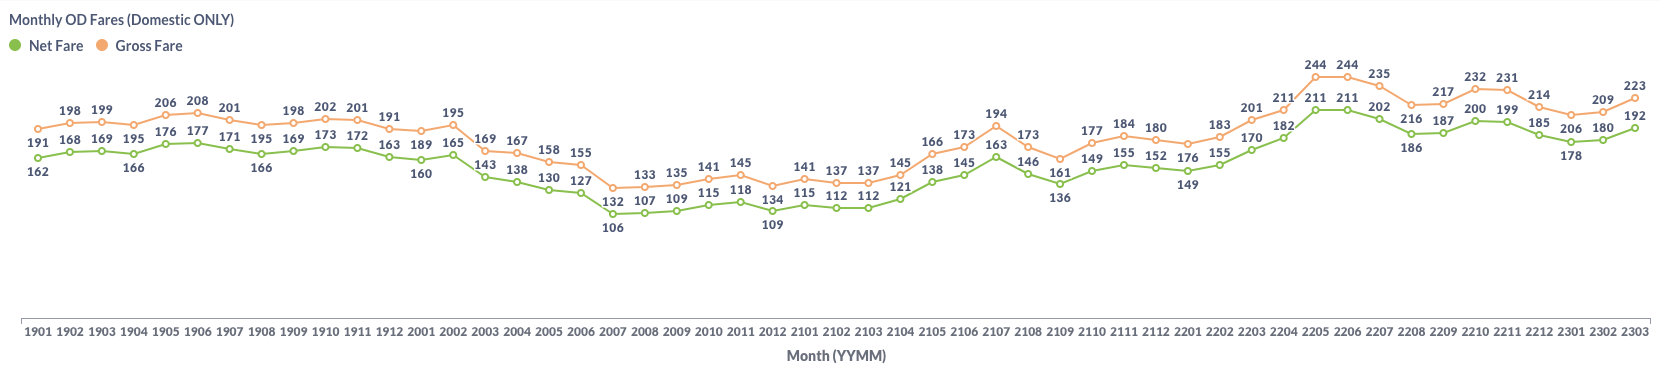
Figure 2: US Domestic Average Airfare by Month
The primary factors influencing the surge in airfare prices have been increasing demand coupled with limited capacity, as opposed to fluctuations in jet fuel prices. This is highlighted by data from the Energy Information Administration (EIA), which indicates a decrease in jet fuel prices from February to March 2023, as shown in the chart below.
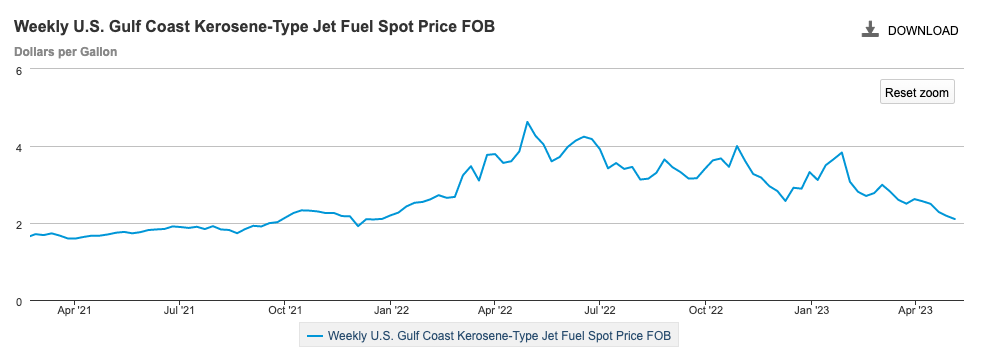
Figure 3: US Jet Fuel Price
Load Factor Trend
The average load factor in March witnessed a rebound, rising to 78.3% from 74.8% recorded in February. As illustrated in Figure 4 below, this recovery can be attributed to a substantial increase in both demand and supply within the period. Southwest Airlines continues to record the lowest load factor among major US airlines. This is largely a residual effect of the system meltdown experienced during the previous holiday season.
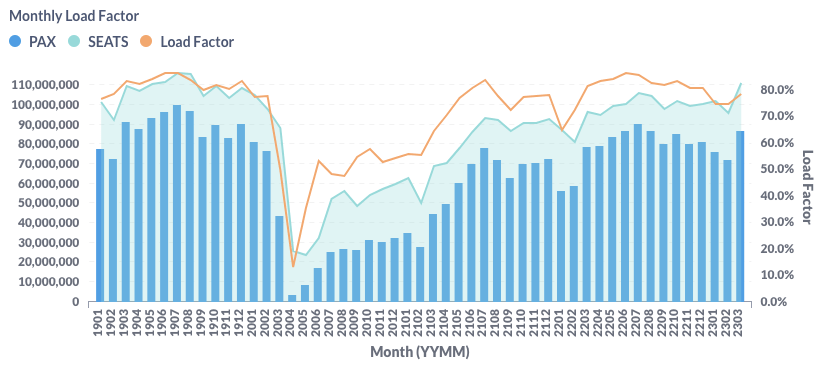
Figure 4: US Airlines’ Average Load Factor by Month
Month Over Month Comparison
Between February and March 2023, the majority of airlines recorded an uptick in daily passenger traffic, with the exception of Hawaiian Airlines (HA) and Spirit Airlines (NK). Allegiant Air (G4) was at the forefront of this growth, registering a substantial 20.3% increase in daily traffic. Both Delta Air Lines (DL) and United Airlines (UA) also saw significant growth, posting double-digit expansion rates. Contrarily, Hawaiian Airlines (HA) observed a dip in daily traffic, experiencing a 7.6% decrease during this period.
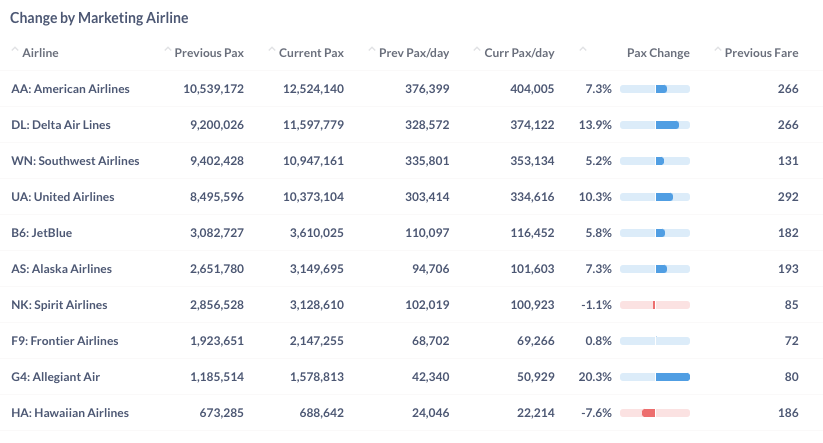
Figure 5: Air Traffic by Dominant Marketing Airlines in February 2023 (Previous) vs. March 2023 (Current)
In March 2023, all leading airports registered an increase in daily passenger traffic compared to the previous month. Notably, Chicago O’Hare International Airport (ORD), San Francisco International Airport (SFO), and Fort Lauderdale-Hollywood International Airport (FLL) experienced significant growth. ORD led the way with a 17.7% surge in daily traffic, closely followed by SFO and FLL, which reported increases of 12.4% and 12.3% respectively.
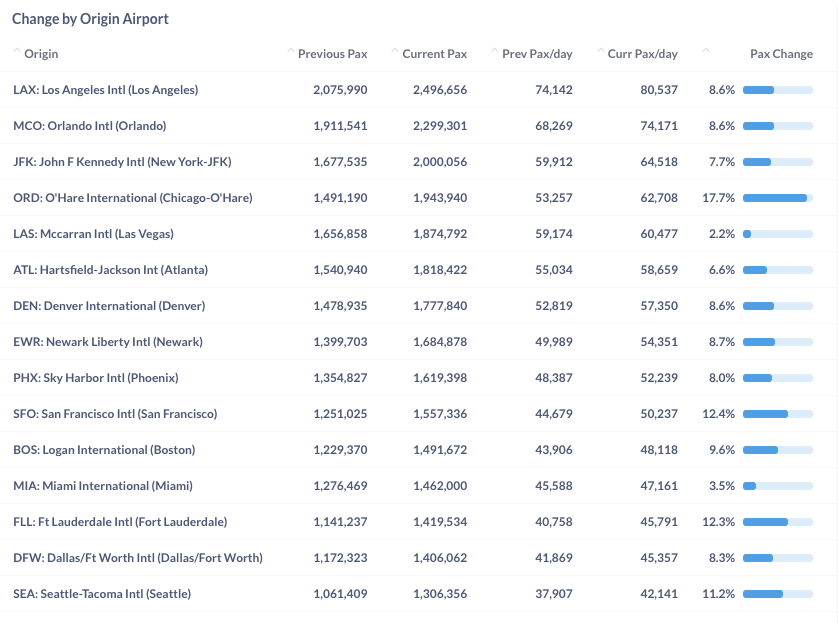
Figure 6: Air Traffic by Top Origin Airports in February 2023 (Previous) vs. March 2023 (Current)
Year Over Year Comparison
In a year-over-year comparison with March 2022, all prominent US airlines recorded positive growth in March 2023. Notably, United Airlines (UA), JetBlue Airways (B6), and Frontier Airlines (F9) emerged as the leaders in year-over-year growth rates. United led the pack with a substantial 23.1% growth, followed by JetBlue and Frontier with robust increases of 14.5% and 13.9%, respectively, thereby leading the growth trajectory among the major US airlines.
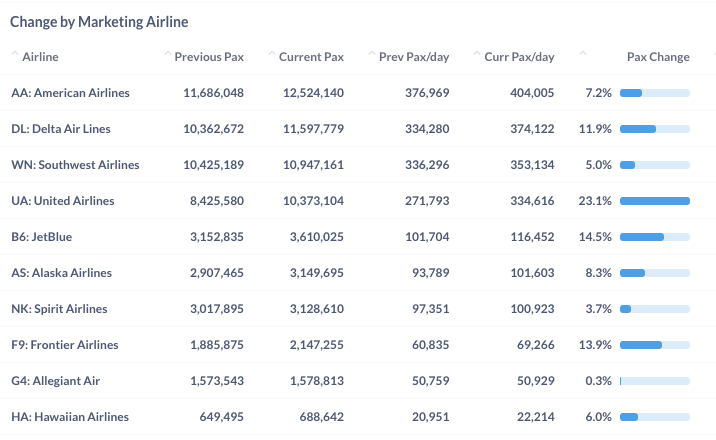
Figure 7: Air Traffic by Dominant Marketing Airlines in March 2023 (Current) vs. March 2022 (Previous)
Between March 2022 and March 2023, the top airports exhibited impressive growth, with all except Miami International Airport (MIA) recording an increase in the range of 7.5% to 34.7%. Particularly, San Francisco International Airport (SFO) and John F. Kennedy International Airport in New York (JFK) spearheaded the year-over-year growth, boasting substantial increases of 34.5% and 34.7% respectively.
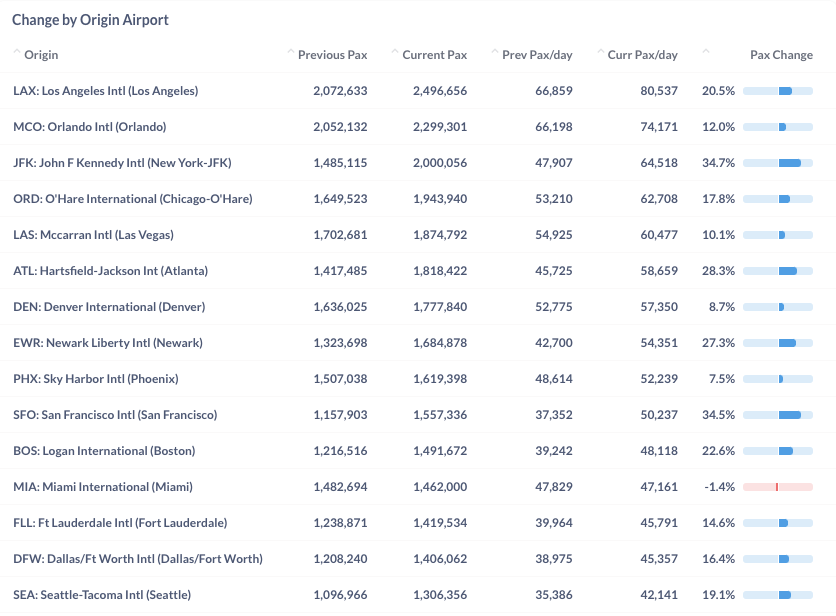
Figure 8: Air Traffic by Top Origin Airport in March 2023 (Current) vs. March 2022 (Previous)
For more detailed information on traffic and fares by route and airline, please contact service@flightbi.com or request a demo of Fligence USOD. They will be able to provide you with customized information to meet your specific needs and requirements.