Traffic and fare data by airline and route can provide valuable insights into market trends, demand, and competition. By analyzing this data, airlines can optimize their pricing strategies, plan their capacity, and make informed decisions about their route network. The data can also be used for market and competitive analysis, helping airlines identify profitable routes and gain a competitive advantage.
According to initial true O&D level data released this week by FlightBI, total U.S. domestic air travel declined in January 2026. International travel volumes also decreased during the same period, while average airfares increased.
Volume Trend
U.S. domestic passenger traffic declined to 45.4 million in January 2026, down from 53.3 million in December 2025, but remained 2.5% higher than the 44.3 million recorded in January 2025. International volumes also fell during the same period, decreasing from 22.3 million to 20.4 million.
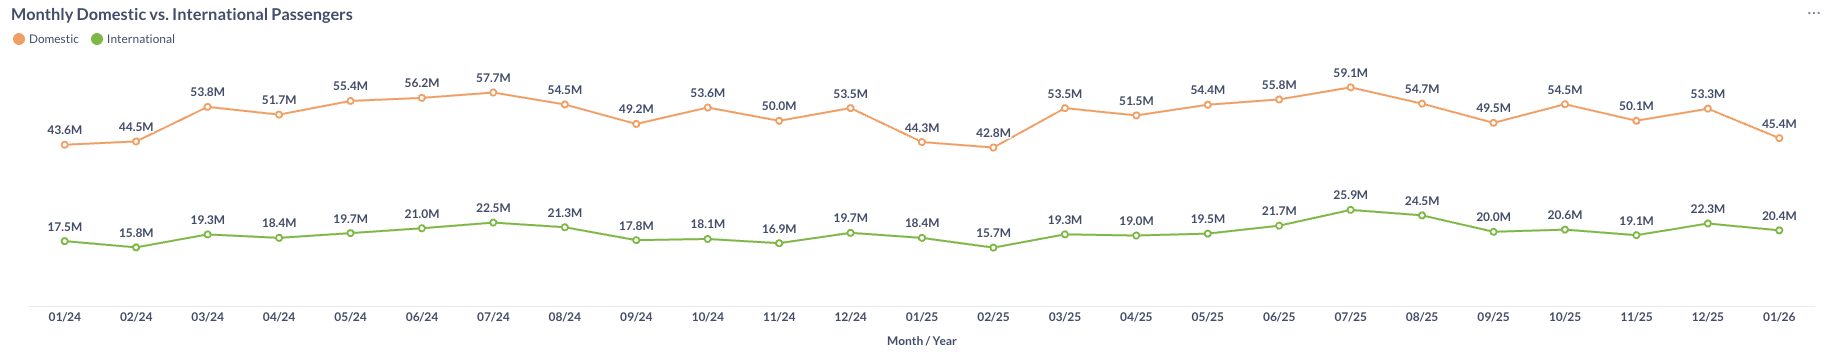
Figure 1: US Domestic and International Air Traffic by Month
Airfare Trend
Domestic airfares increased modestly in January 2026, with the average gross fare rising from $216 in December to $218, while the average net fare climbed from $185 to $188.
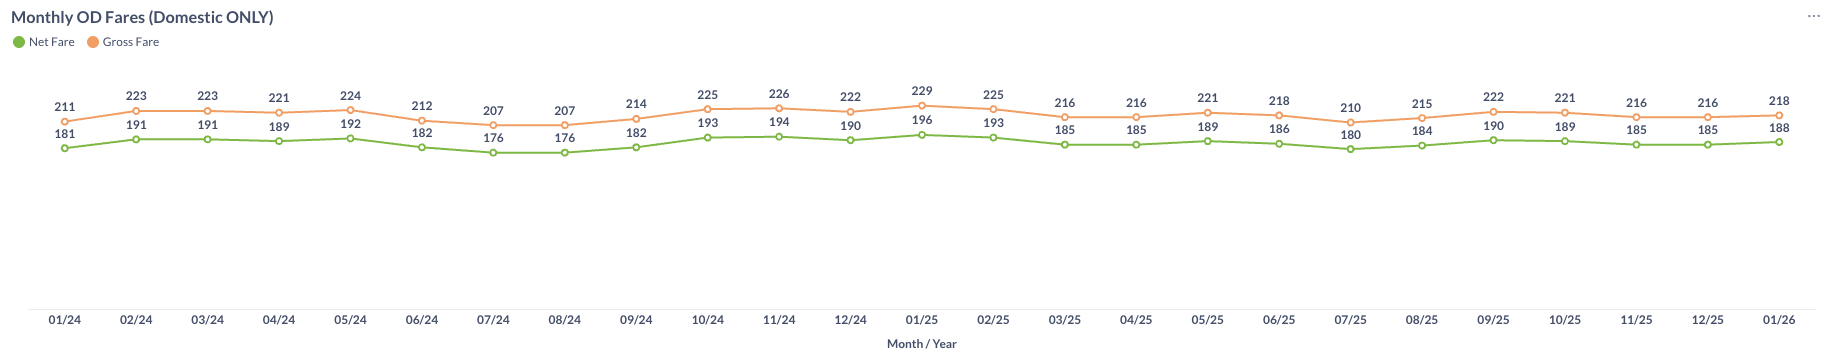
Figure 2: US Domestic Average Airfare by Month
Load Factor Trend
In January 2026, both Available Seat Miles (ASM) and Revenue Passenger Miles (RPM) declined month over month. The average load factor for major U.S. airlines retreated to 78.1%, below the 80.0% recorded in January 2025 (see Figure 3).
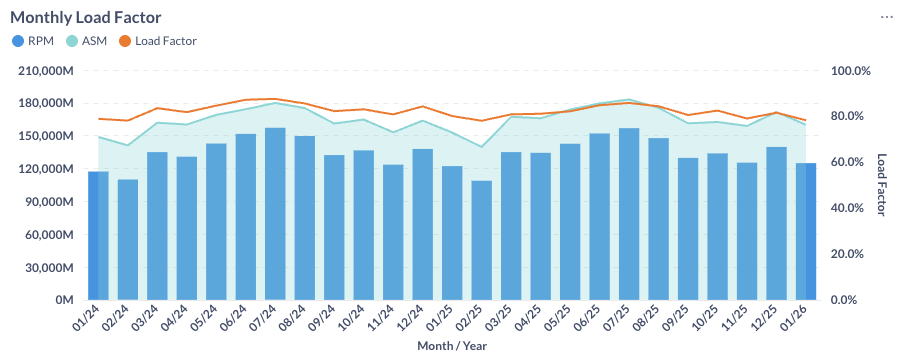
Figure 3: US Airlines’ Average Load Factor by Month
Month Over Month Comparison
Most U.S. airlines saw month-over-month loss in average daily domestic traffic in January 2026, partly caused by the winter storm and partly by seasonal travel demand. Allegiant (G4) and Southwest (WN) underperformed the industry, with traffic declining 22.9% and 20.1%, respectively, while United (UA), Hawaiian (HA) and Spirit (NK) had the least slowdown.
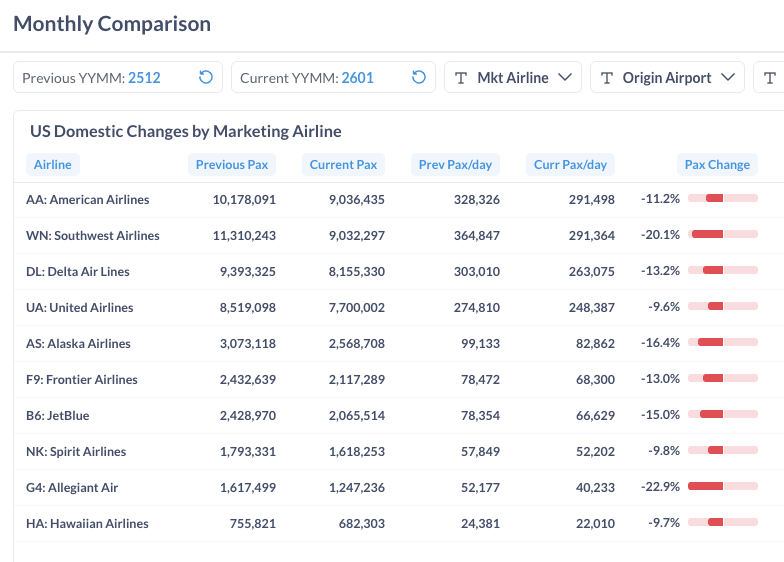
Figure 4: Domestic Air Traffic by Marketing Airlines in December 2025(Previous) vs. January 2026 (Current)
Most U.S. airports reported passenger declines in January 2026. New York–LaGuardia (LGA) and Boston (BOS) each posted losses exceeding 20%. In contrast, Miami (MIA) and Las Vegas (LAS) were the only major airports to record growth during the month.
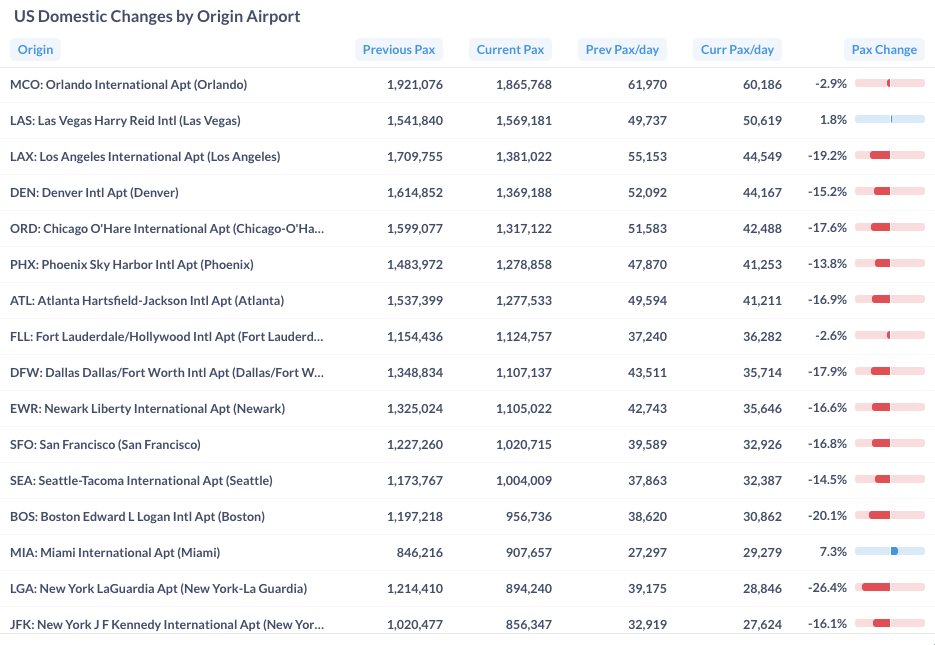
Figure 5: Domestic Air Trafficby Top Airports in December 2025 (Previous) vs. January 2026 (Current)
Year Over Year Comparison
From January 2025 to January 2026, most U.S. airlines recorded year-over-year growth. American (AA) and United (UA) led the industry with gains of approximately 8%. In contrast, Spirit (NK) was the most notable decliner, with traffic down 28.8% compared with the same month last year.
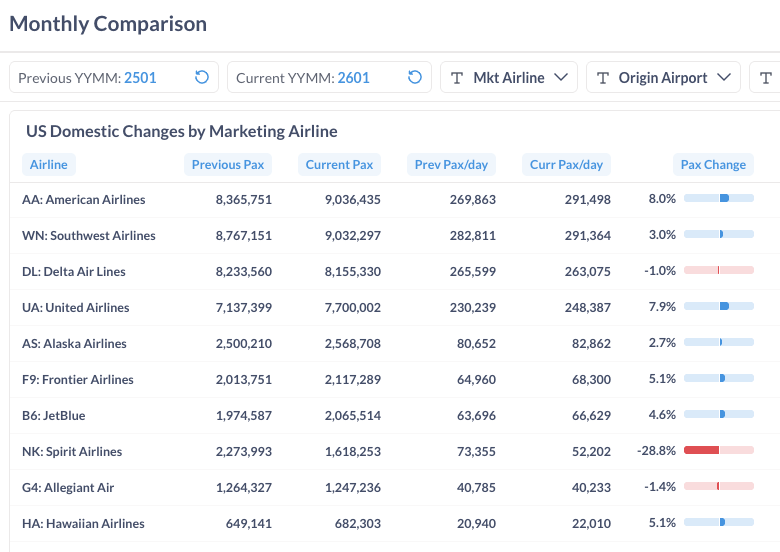
Figure 6: Domestic Air Traffic by Marketing Airlines in January 2026 (Current) vs. January 2025 (Previous)
From January 2025 to January 2026, most major U.S. airports recorded year-over-year increases in domestic traffic. Chicago O’Hare (ORD) led growth with a 13.7% increase. New York JFK also rose 10.4%, though much of that gain appears to reflect traffic shifted from New York–LaGuardia (LGA). Other airports posting solid growth included Atlanta (ATL) at 8.1%, Seattle (SEA) at 6.8%, and Orlando (MCO) at 6.2%.
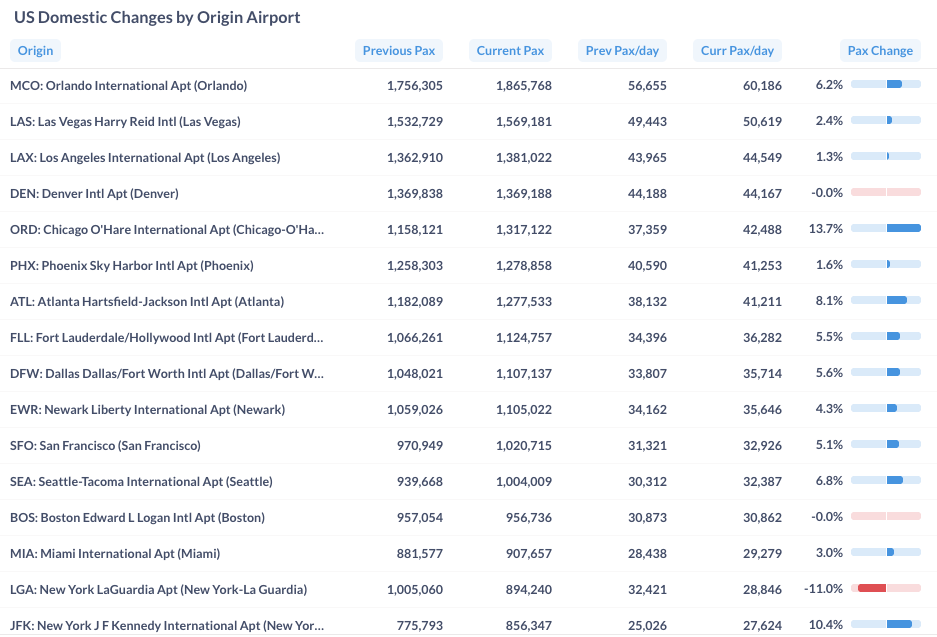
Figure 7: Domestic Air Traffic by Top Origin Airport in January 2026 (Current) vs. January 2025 (Previous)
For more detailed information on traffic and fares by route and airline, please contact service@flightbi.com or request a demo of Fligence USOD. They will be able to provide you with customized information to meet your specific needs and requirements.