Traffic and fare data by airline and route can provide valuable insights into market trends, demand, and competition. By analyzing this data, airlines can optimize their pricing strategies, plan their capacity, and make informed decisions about their route network. The data can also be used for market and competitive analysis, helping airlines identify profitable routes and gain a competitive advantage.
Based on initial true O&D level data from FlightBI released this week, both domestic and international air traffic in the United States witnessed a decline from October to November. Concurrently, there was a modest increase in average airfares during the same period.
Volume Trend
In December 2023, domestic air travel in the US saw a modest uptick, with 51.4 million passengers, slightly up from November’s 51.3 million. This represents a 2% increase over the pre-pandemic level, surpassing December 2019’s figure of 50.3 million passengers. Meanwhile, international flights experienced a notable rise, with passenger numbers growing from 17.5 million to 19.9 million.
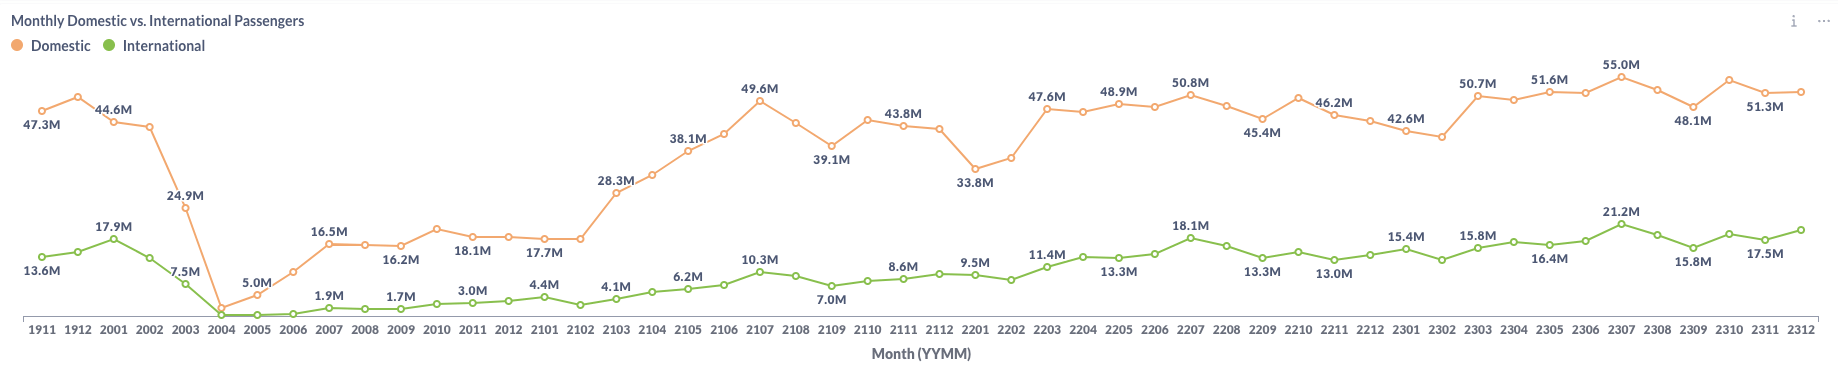
Figure 1: US Domestic and International Air Traffic by Month
Airfare Trend
Recent data indicates minor adjustments in airfare trends, with the average gross fare for flights slightly rising from $216 in November to $218 in December. Simultaneously, the average net fare also saw a modest increase, moving up from $184 to $186 over the same period.
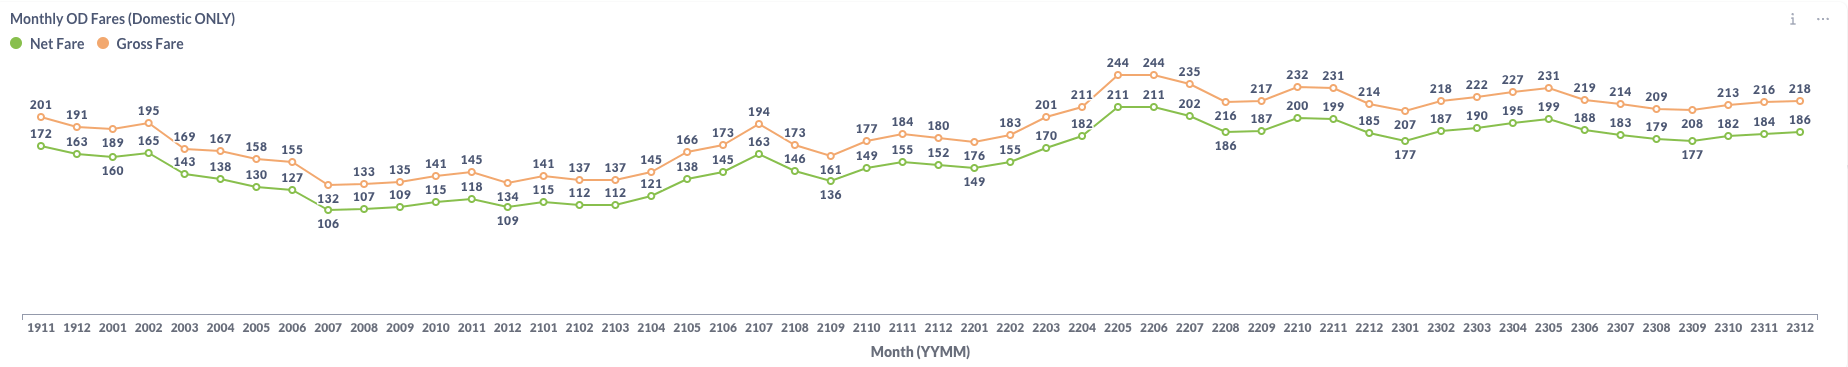
Figure 2: US Domestic Average Airfare by Month
Load Factor Trend
In December, there was a slight decrease in the average load factor for major US airlines, dropping to 79.4% from November’s 81.0%, as illustrated in Figure 4. Notably, the average load factor was below the pre-COVID benchmark of 84.6% recorded in December 2019.
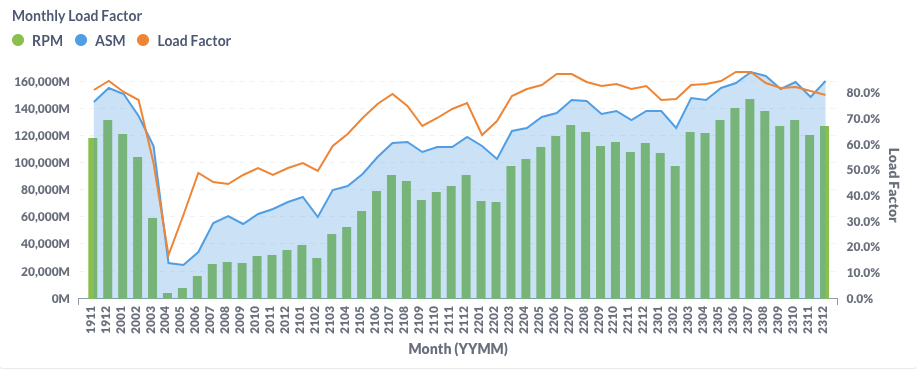
Figure 3: US Airlines’ Average Load Factor by Month
Month Over Month Comparison
From November to December 2023, American Airlines (AA) and Delta Airlines (DL) experienced a decrease in daily traffic, falling between 3.3% and 3.5%. Spirit Airlines (NK) saw a more significant drop of 8.3%, whereas Hawaiian Airlines (HA) reported a 7.4% increase in their daily traffic.
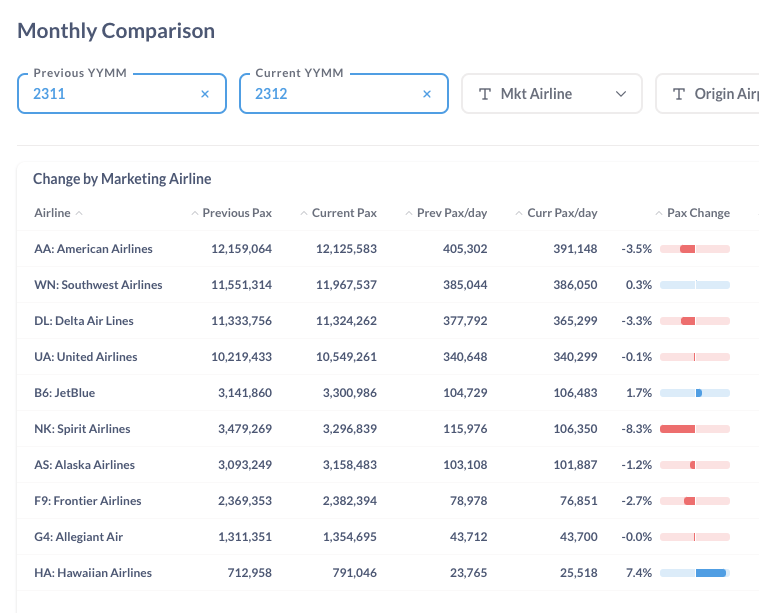
Figure 4: Air Traffic by Dominant Marketing Airlines in November 2023 (Previous) vs. December 2023 (Current)
During the same period, prominent airports like Miami (MIA), Fort Lauderdale (FLL), and John F. Kennedy (JFK) saw daily passenger volumes increase by 11.3%, 7.2%, and 7.0%, respectively, compared to the previous month. On the other hand, Boston (BOS) and Seattle (SEA) experienced reductions in daily passenger traffic, with decreases of 5.5% and 4%, respectively.
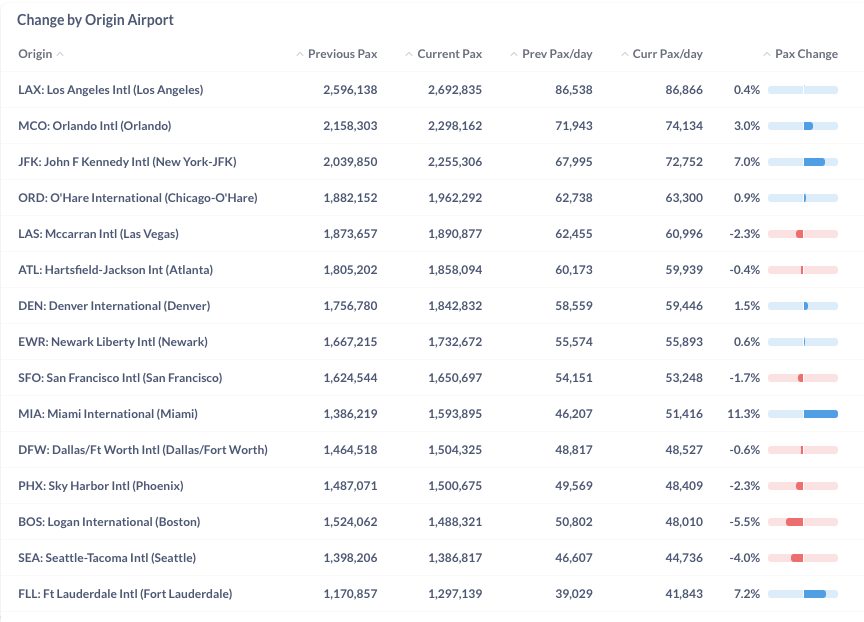
Figure 5: Air Traffic by Top Origin Airports in November 2023 (Previous) vs. December 2023 (Current)
Year Over Year Comparison
The year-over-year comparison from December 2023 to December 2022 shows a positive growth trend across all major US airlines. Frontier Airlines (F9), Southwest Airlines (WN), and United Airlines (UA) led the charge with significant growth, posting increases of 29.1%, 26.5%, and 18.8%, respectively, highlighting their strong performance in the upward trend.
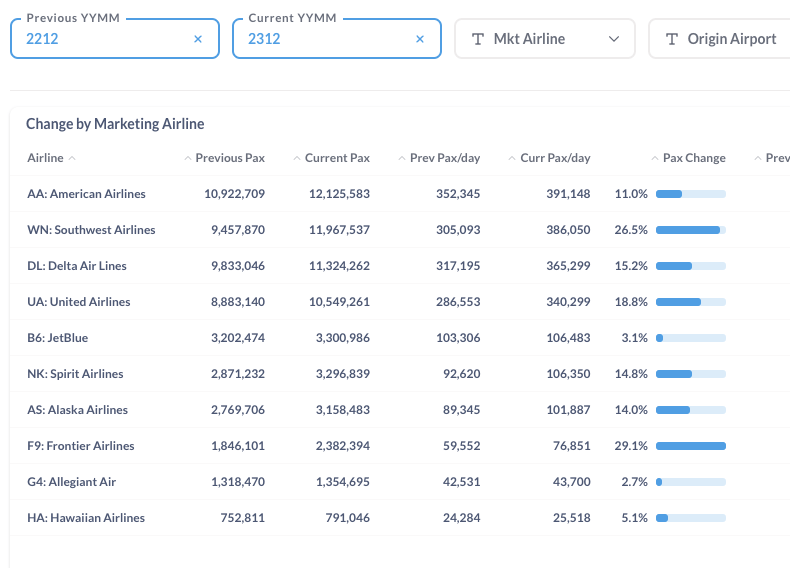
Figure 6: Air Traffic by Dominant Marketing Airlines in December 2023 (Current) vs. December 2022 (Previous)
Between December 2022 and December 2023, all major airports experienced growth of over 10%. Notably, Miami (MIA), John F. Kennedy (JFK) in New York, and O’Hare International (ORD) in Chicago led this year-over-year expansion, with increases of 27.9%, 23.7%, and 21.8%, respectively.
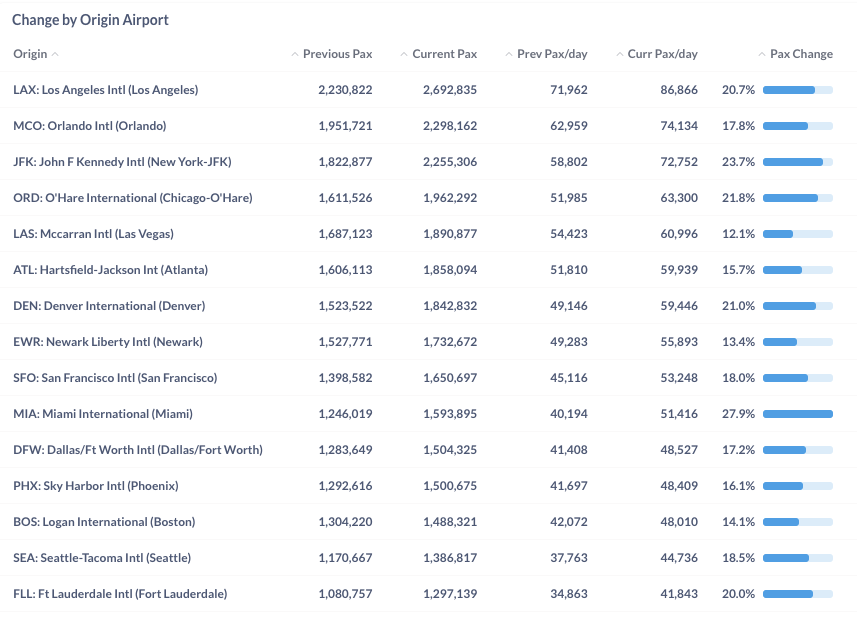
Figure 7: Air Traffic by Top Origin Airport in December 2023 (Current) vs. December 2022 (Previous)
For more detailed information on traffic and fares by route and airline, please contact service@flightbi.com or request a demo of Fligence USOD. They will be able to provide you with customized information to meet your specific needs and requirements.