The US BizAv (Business Aviation) market has gone through a booming period since March 2021. This series of articles track the traffic trend of this market.
We define the BizAv market as part-135 on-demand for-hire private flying by business jets or certain turboprop planes. The numbers in the following charts exclude part-91 private flights. If you are interested in all flights by business jets, please contact support@flightbi.com.
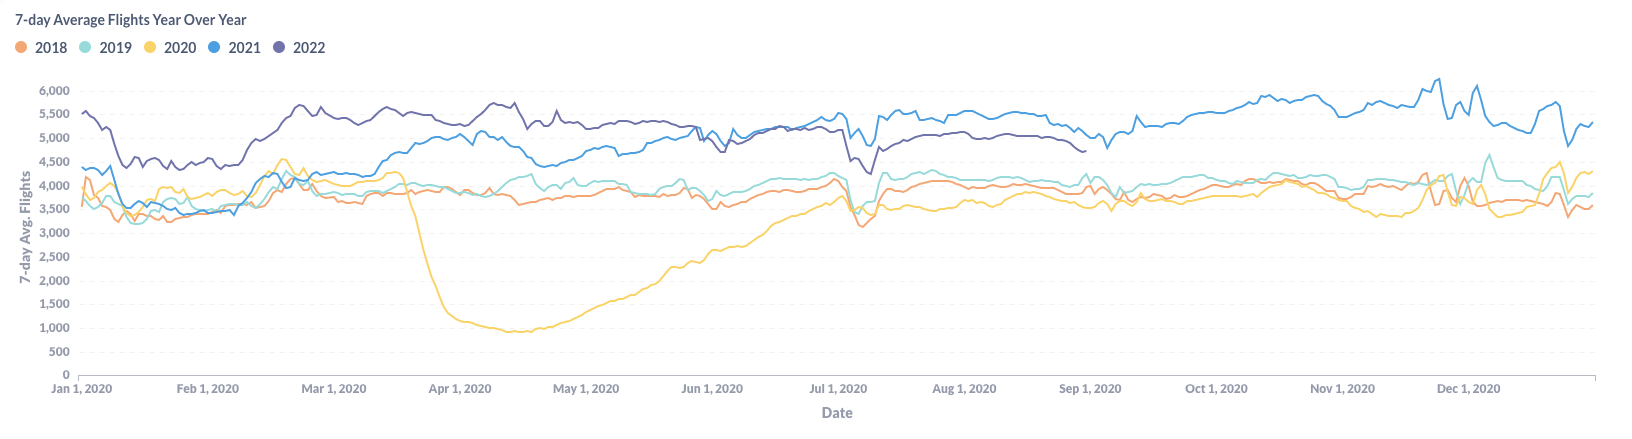
Figure 1: Year over Year Trend of the U.S. BizAv Market
As shown in Figure 1, the U.S. BizAv traffic in August 2022 basically followed the same trendline in 2021. It was relatively flat in August and started decreasing in the last week. However, the gap between 2022 and 2021 is smaller at the end of August than at the end of July.
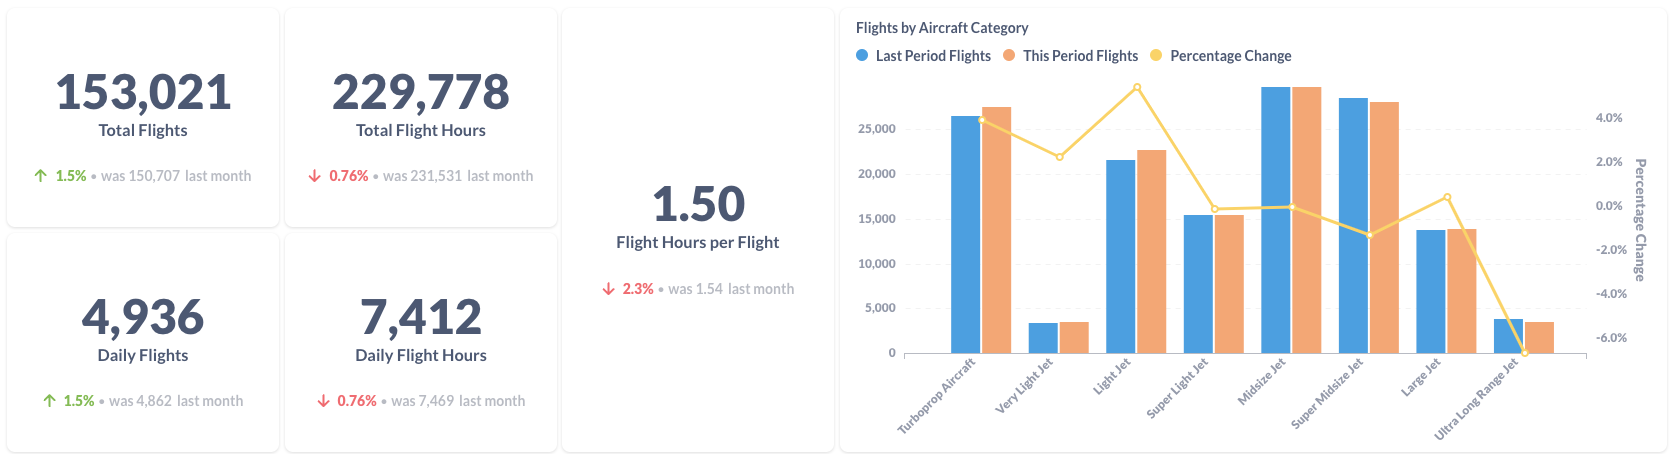
Figure 2: Comparison of the U.S. BizAv Flights This Month vs. Last Month
Figure 2 is a comparison between August 2022 and July 2022. The good news is that the overall decline from March 2022 has stopped. Both total flights and flight hours have increased by 1.5% from July to August. The contribution primarily comes from smaller aircraft, including Turboprop, Very Light Jet, and Light Jet. The Ultra Long Range Jet dragged down the growth, but all other aircraft types are almost unchanged. As a result, the average flight length slightly dropped to 1.5 hours per flight.
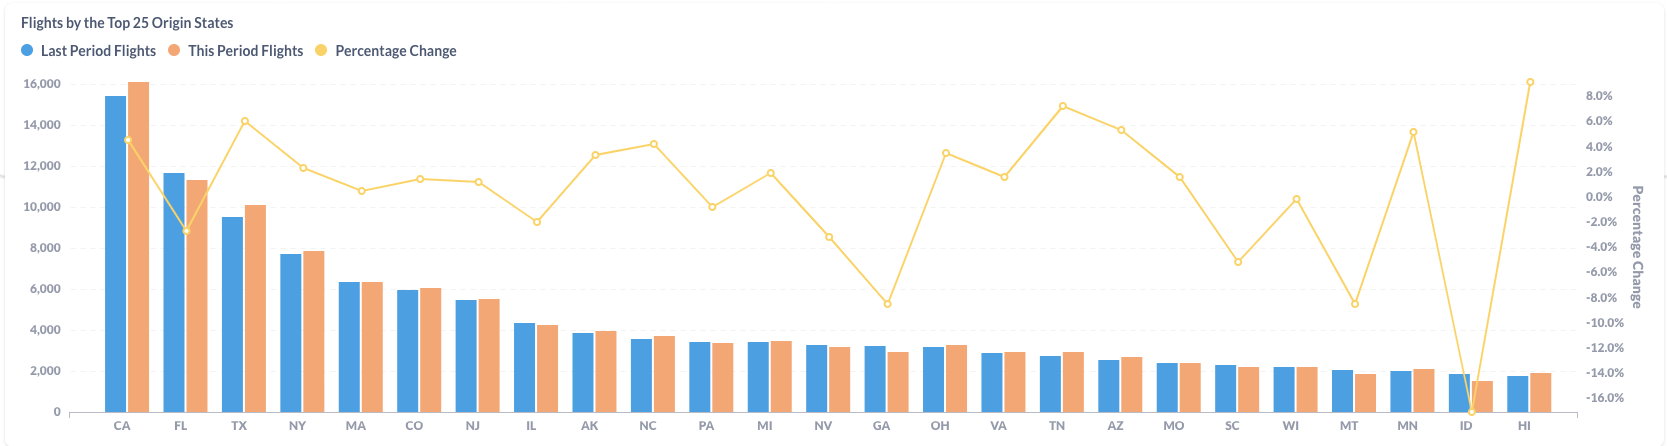
Figure 3: Comparison of the U.S. BizAv Flights by the Top 25 Origin States (This Month vs. Last Month)
Among the top 3 states – California(CA), Florida(FL), and Texas(TX), Florida is still on the downturn with a 2.7% decrease from July to August, but California and Texas have reversed their decline. In fact, California increased the number of flights by 4.5%, and Texas(TX) increased 6.0%. The month-to-month changes for most other states are small.
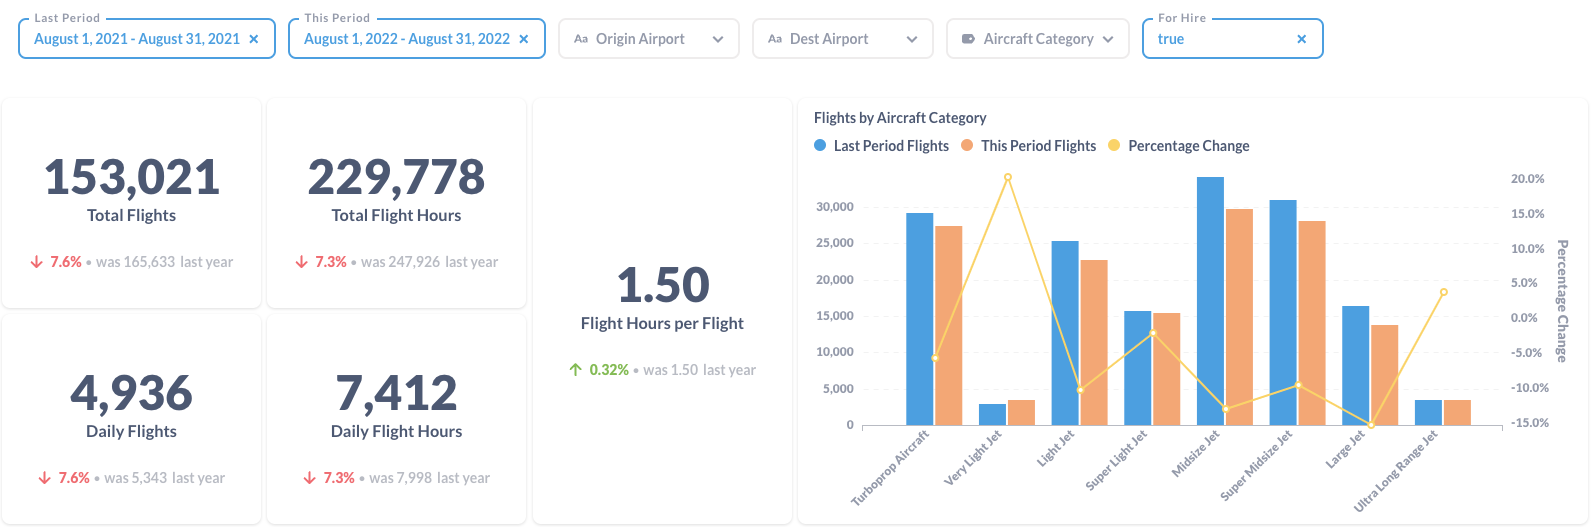
Figure 4: Comparison of the U.S. BizAv Flights This Year vs. Last Year
Compared to August last year, the number of total business flights decreased by 7.6%. The average flight hours per flight increased by 0.3%. Therefore the total flight hours decreased by 7.3% from last year. Only Very Light Jet and Ultra Long Range Jet have more flights than last year, but the total size of those two categories is very small. The number of flights by all other aircraft categories is lower than last year.
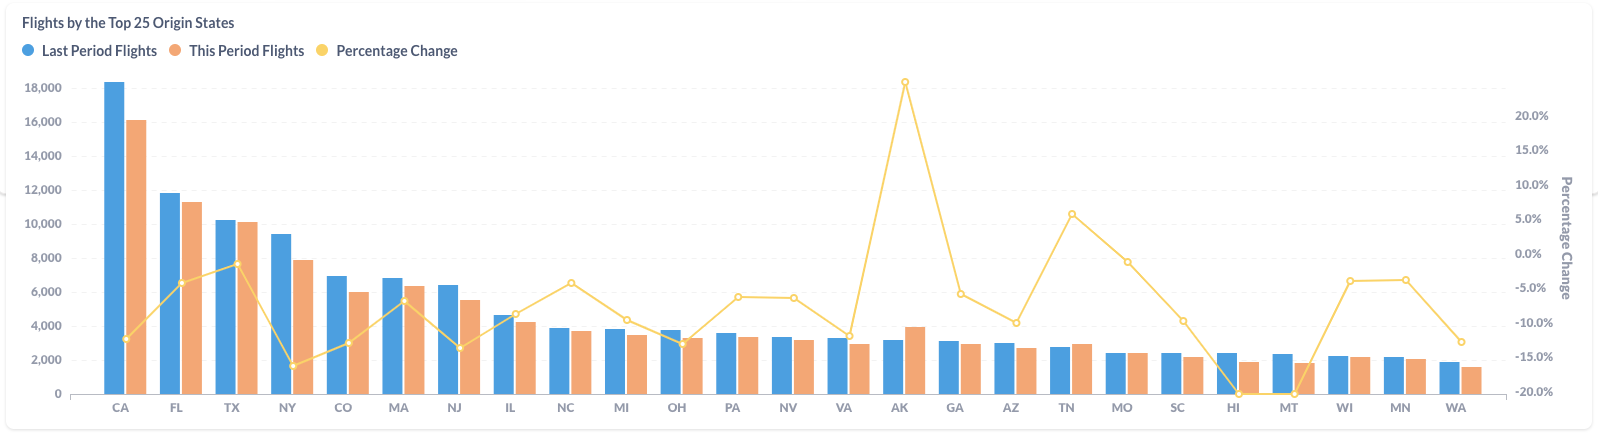
Figure 5: Comparison of the U.S. BizAv Flights by the Top 25 Origin States (This Year vs. Last Year)
Most origin states had a decrease in business flights from last year. California (CA) decreased by 12.3%. The biggest exception is Alaska (AK), which achieved a 24.9% growth, but the majority of those new flights are by Turboprop.