It’s time again to check the US Air Market status! The preliminary true O&D level data released by FlightBI today shows that pax volume decreased moderately from May 2022 to June, but the average fare has stabilized.
Volume Trend
US domestic traffic by true O&D decreased from 52.0 million passengers in May to 50.1 million in June, which is below the pre-pandemic level of 51.1 million in June 2019. The decrease was led by low-cost carriers. The mainline business of legacy carriers grew moderately, although the routes by regional airlines such as SkyWest and Republic Airways dragged down the growth. However, the US international traffic has improved further, from 16.2 million in May to 17.8 million in June.
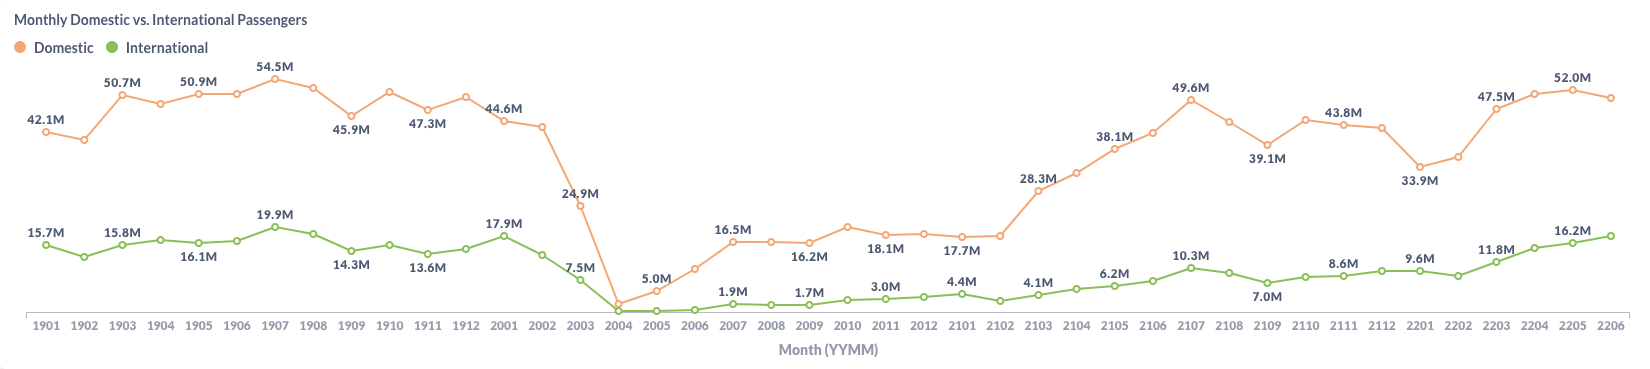
Figure 1: US Domestic and International Air Traffic by Month
Fare Trend
Both gross fare and net fare are flatted from May. The domestic average gross fare increased by only 1%, from $280 in May to $283 in June. Similarly, the average net fare climbed from $237 to $240.
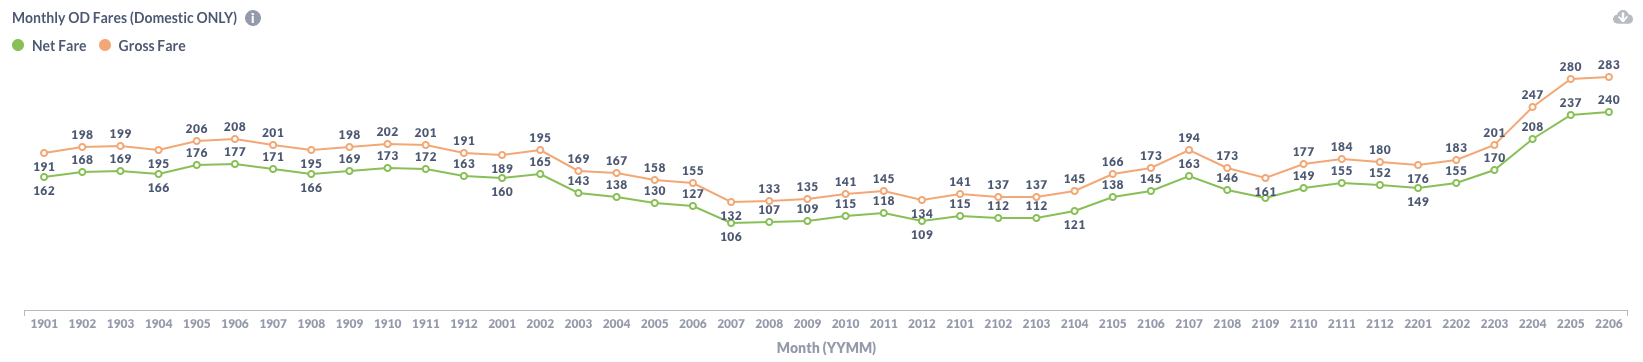
Figure 2: US Domestic Average Airfare by Month
Jet fuel price is still the wind vane of the airfare. As shown in the chart below provided by EIA, the US jet fuel price has ebbed from its peaked in May. We expect to see a lower average fare next month.
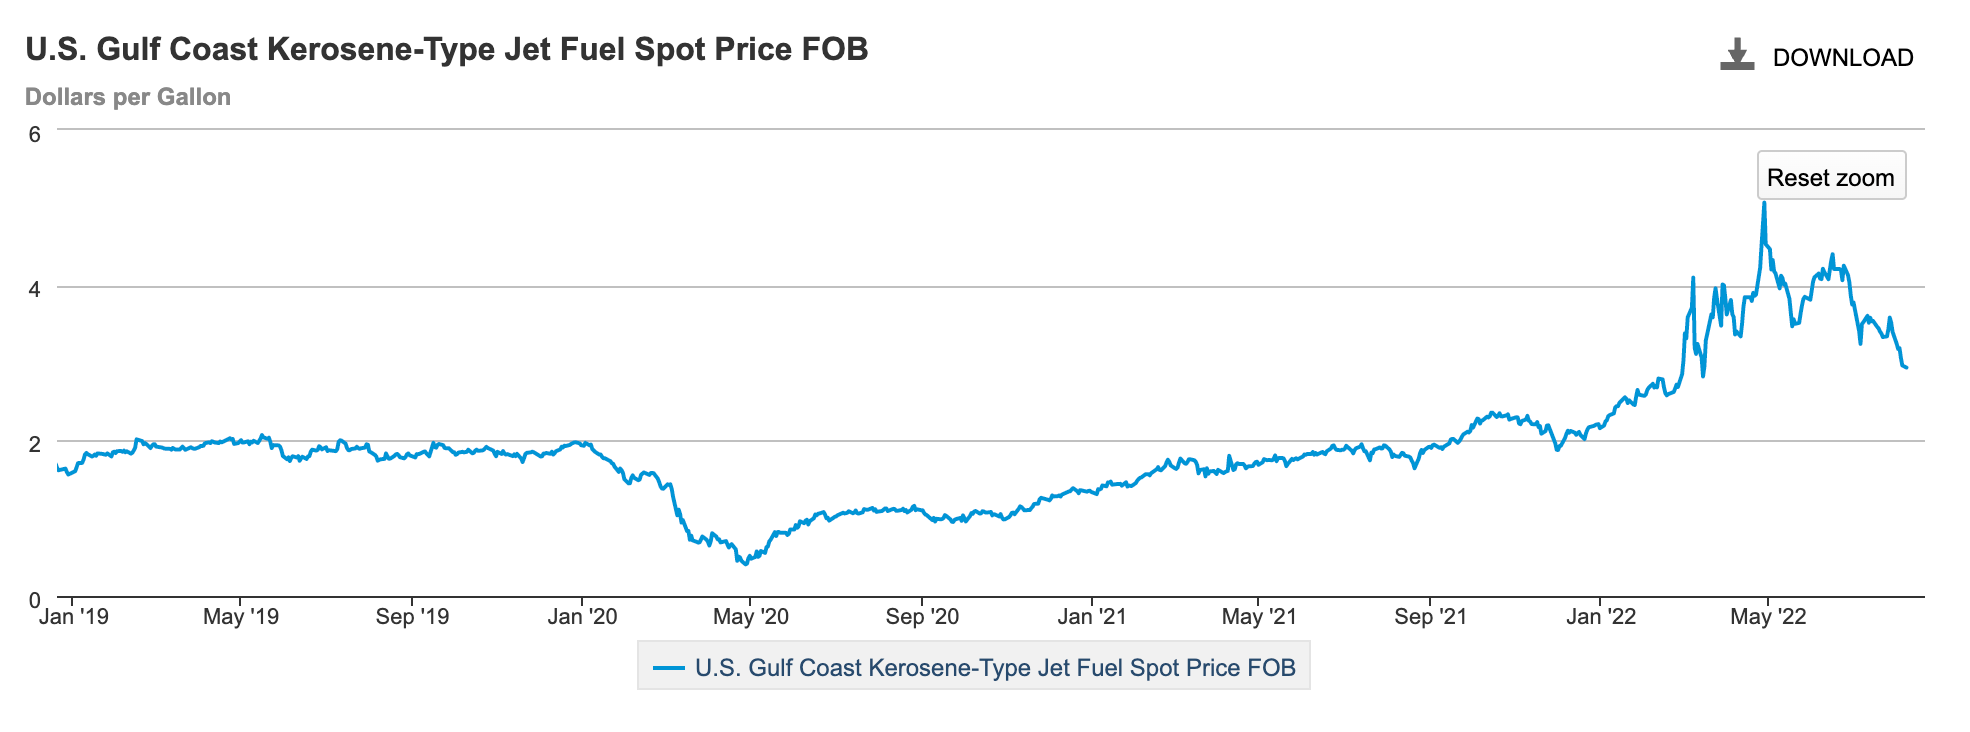
Figure 3: US Jet Fuel Price
Load Factor Trend
The average load factor in June is 81.9%, which is lower than that in May because more capacity was added, but traffic didn’t catch up. In June, the constraints of air traffic are factors other than flight capacity, e.g. airport passenger handling capability.
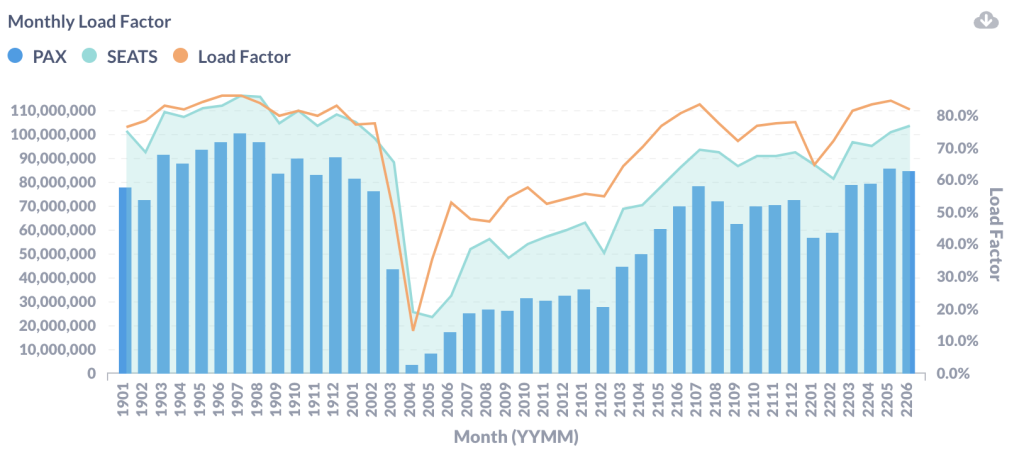
Figure 4: US Airlines’ Average Load Factor by Month
Month Over Month Comparison
The total passenger traffic in June decreased slightly from May. However, because there is one day less in June than in May, more than half of U.S. airlines actually carried more passengers per day in June. All legacy carriers, including American(AA), United(UA), Delta(DL), Alaska Airlines(AS), and Hawaiian(HA), had a slight gain, while low-cost carriers, including Southwest(WN), Jet Blue(B6), Sprint(NK) and Frontier(F9) had a small loss, in terms of average pax per day. Nevertheless, the leisure carrier Allegiant(G4) performed well in June.
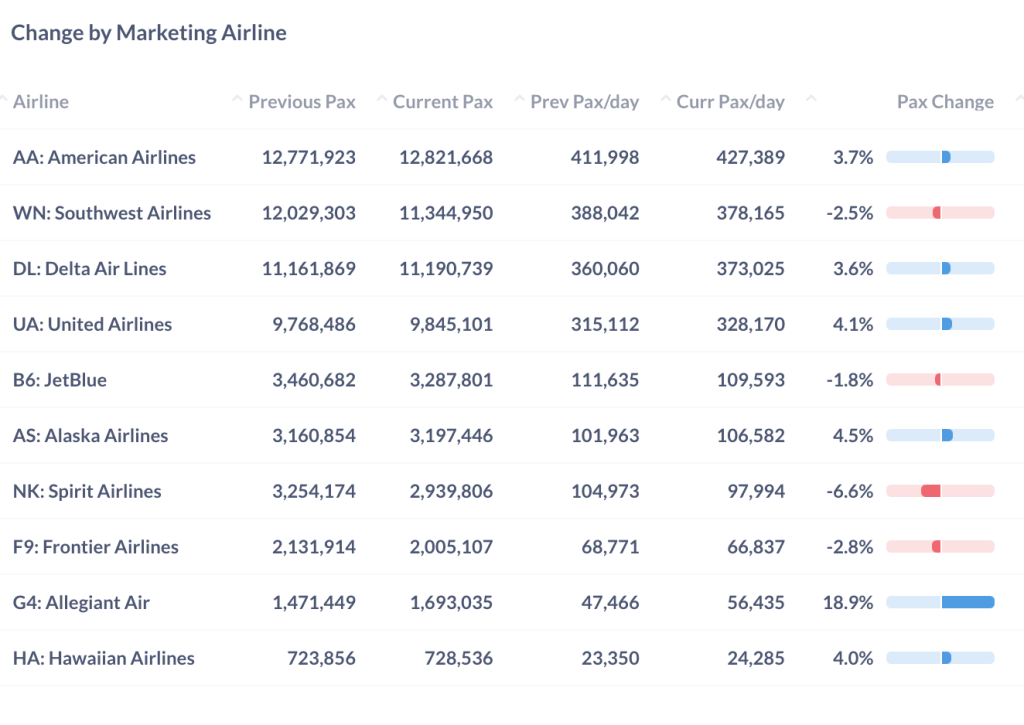
Figure 5: Pax by Dominant Marketing Airlines in June 2022 (Current) vs. May 2022 (Previous)
Among the top airports, San Francisco(SFO) achieved the highest growth of 16.4% from May. The top three origin airports – Los Angeles(LAX), New York(JFK), and Chicago(ORD) all generated more daily traffic in June. The Florida cities, including Orlando(MCO) and Miami(MIA), are losing more traffic from previous months.
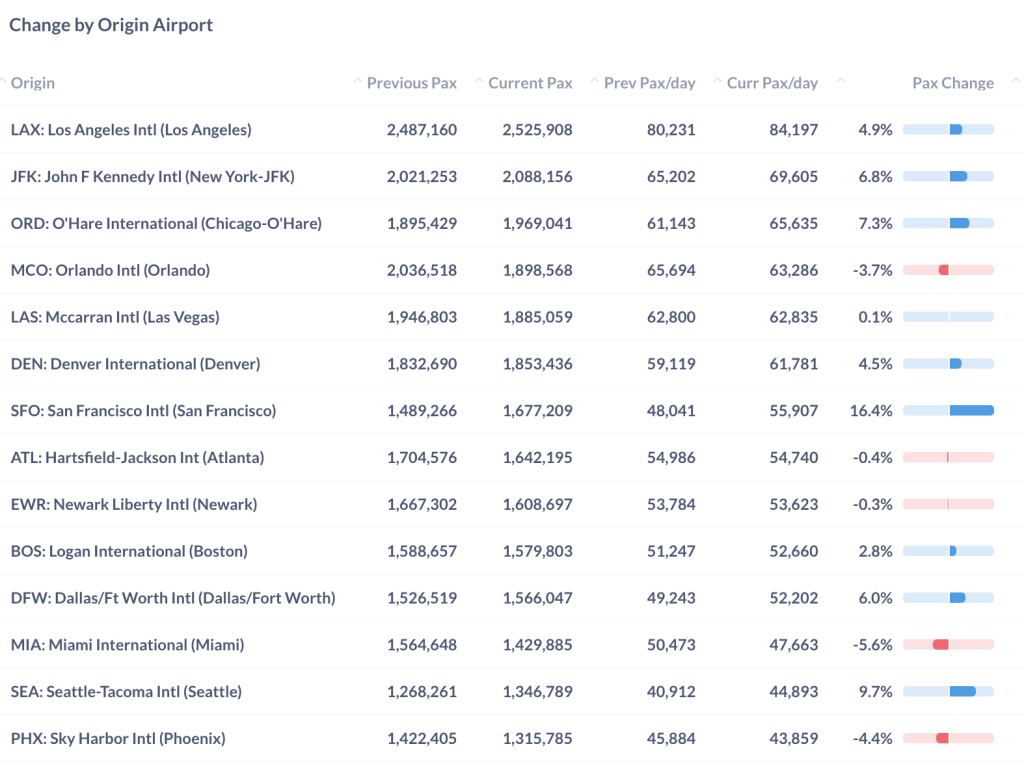
Figure 6: Pax by Top Origin Airports in June 2022 (Current) vs. May 2022 (Previous)
Year Over Year Comparison
Compared to the same month last year, all airlines had achieved a two-digit growth. United(UA) led with a year-over-year growth rate of 56.6%. The growth rates of other airlines are relatively close to each other.
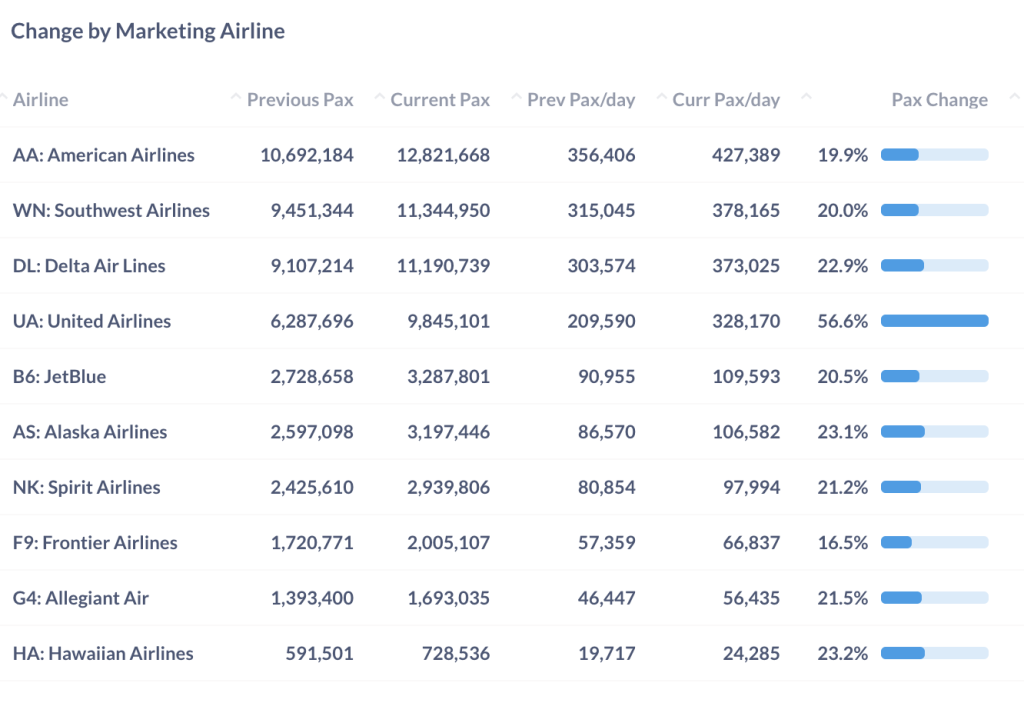
Figure 7: Pax by Dominant Marketing Airlines in June 2022 (Current) vs. June 2021 (Previous)
Similar to the previous two months, the three airports with the highest traffic growth from last year are still New York (JFK), Boston (BOS), and San Francisco (SFO). All those airports have a good portion of international traffic and business travelers, indicating healthy growth for the airline industry.
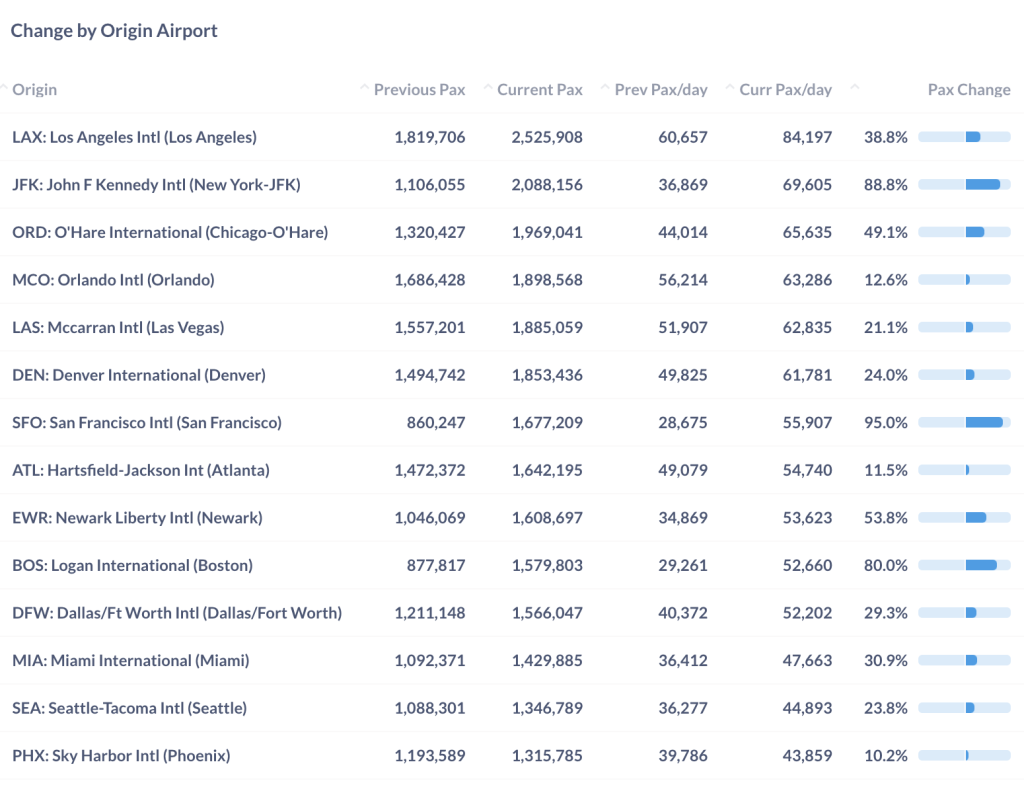
Figure 8: Pax by Top Origin Airport in June 2022 (Current) vs. June 2021 (Previous)
For more granular traffic and fare information by route and airline, please contact service@flightbi.com or request a demo of Fligence USOD.