The Business Aviation industry is booming, thanks to the COVID pandemic. 2021 ended with a spread of the Omicron variant. It dragged commercial aviation down but did not stop the momentum of private flying. The US business aviation industry has achieved significant growth from the pre-pandemic level.

Year over Year Growth
The level of business aviation activities was flat for many years in the US. The COVID-19 pandemic hit the world in March 2020, leading to a big drop in the number of flights. Compared to commercial flights, business aviation had a relatively quick recovery (a comparison is available here). It has basically reached the pre-pandemic level in July 2020 but kept at that level until spring 2021. From March 2021, business aviation flights were boosted. After one year, many passengers who took private flying first time have accepted the fact that the pandemic would not go away soon. They began to add private flying into their regular plans and budget. From then on, the business aviation industry started its best time in history.
Utilization Growth
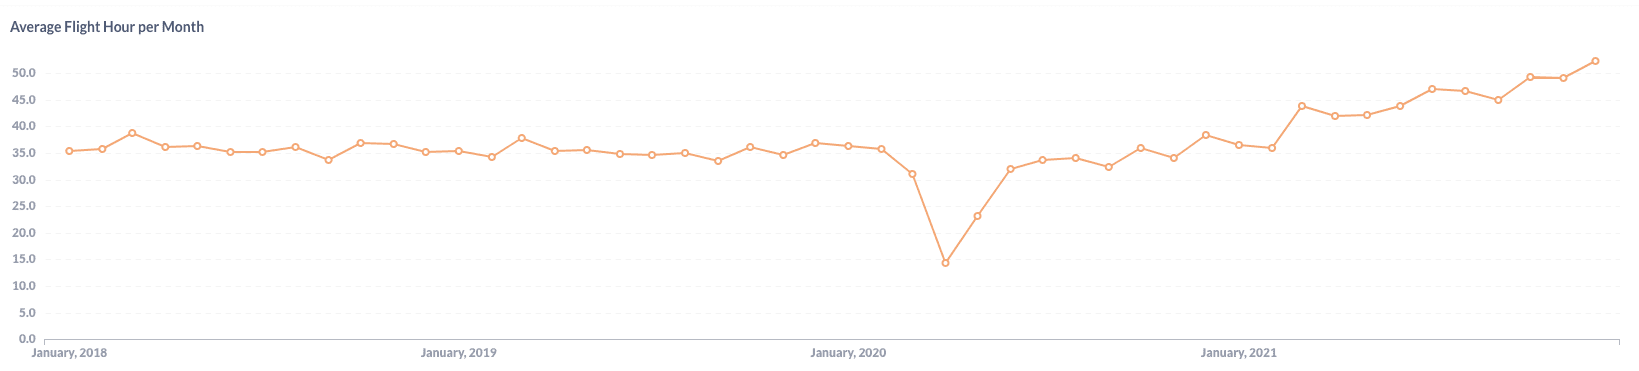
The demand for private flying arose. So is the aircraft utilization, measured by the number of flight hours per month by each aircraft. Since the fixed aircraft cost is a significant part of the total cost, operators had lower hourly costs when the fixed cost is spread over more flights. Therefore, more profit is generated. The demand grew so much that many part 135 carriers are not able to take more reservations. Several operators, including NetJets, stopped selling jet cards to make sure they maintain good services to existing customers.
Growing flight demand also led to higher demand for aircraft and pilots. OEMs received more orders but they cannot increase their manufacturing capacity overnight. There is a negative impact of COVID on the supply chains of OEMs. At some point, they were struggled to keep the regular capacity. All those created a thriving second-hand business jet market. It’s hard to find a young pre-owned business jet even with a price higher than the pre-pandemic level. A shortage of pilots has become the biggest headache of most operators. On one hand, more flights demand more pilots. On the other hand, infection of COVID increased the sick leaves of pilots and operational staff.
Growth by Aircraft Category
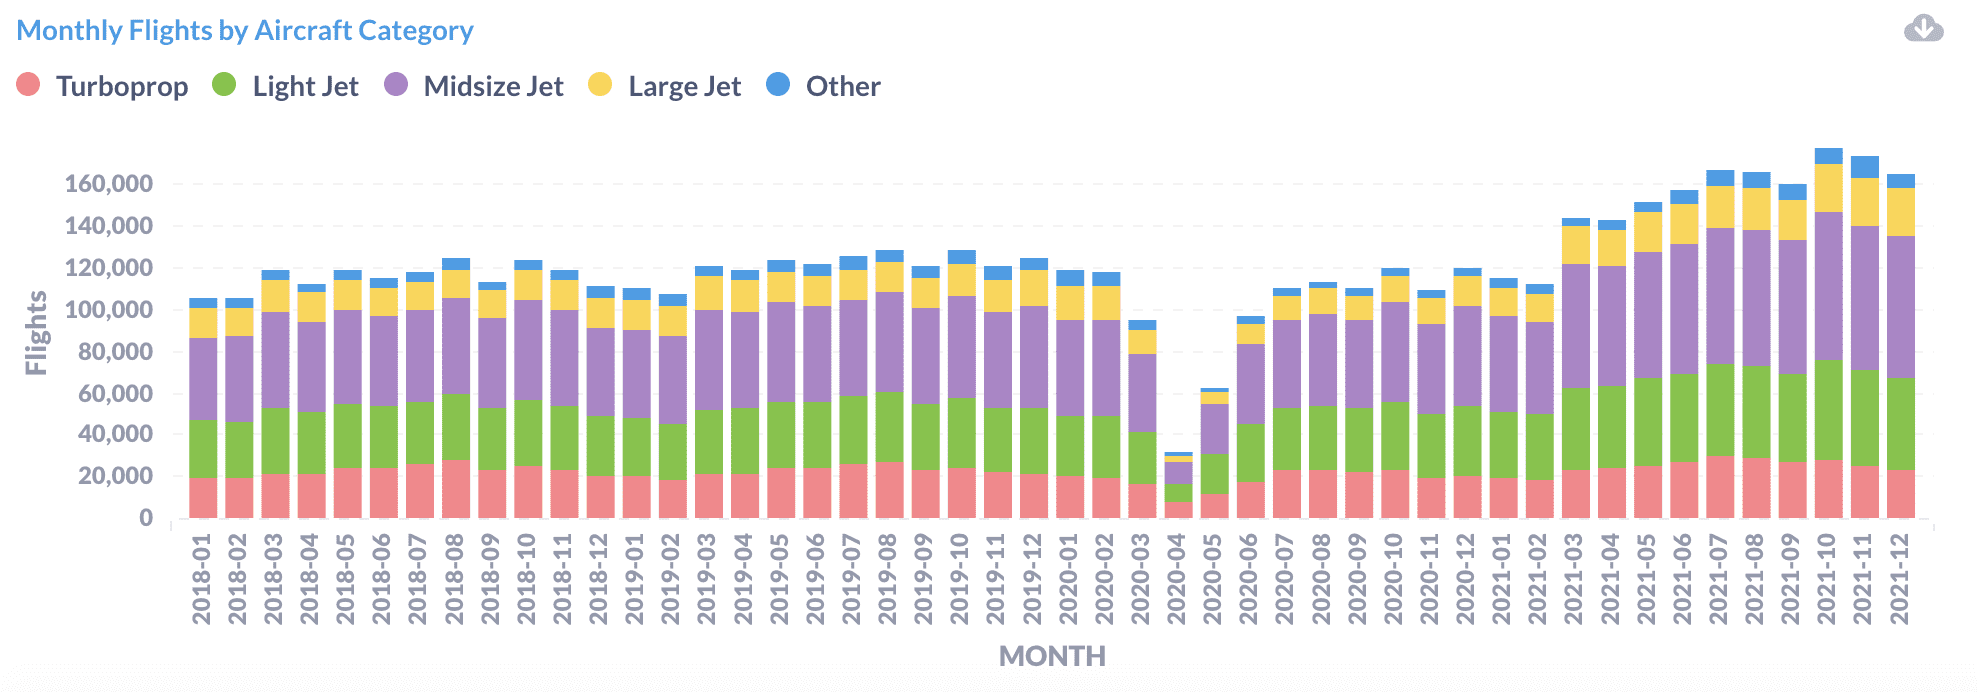
In 2021, there are 1,828,569 business aviation flights tracked in, from, and to the US with 2,864,279 flight hours. That is 5,010 flights every day on average. The number of daily flights grow 26% from 3,976 flights per day in 2019. Compared to 3,294 daily flights in 2021, total traffic in 2022 grew at a fantastic rate of 52%.
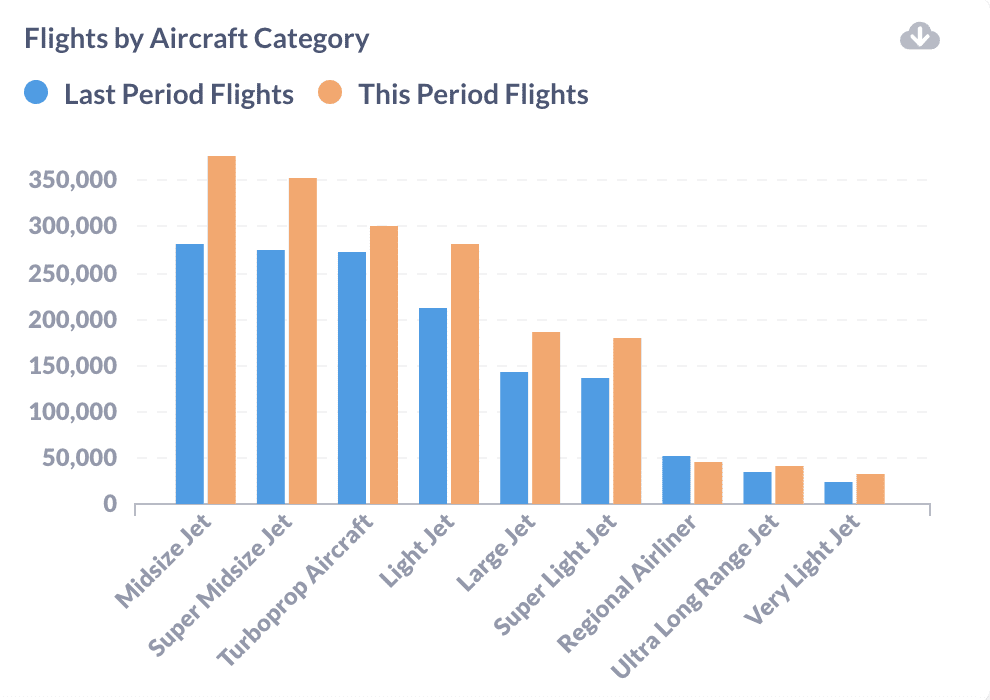
The chart on the right is a comparison of 2021 (This Period) and 2019 (Last Period). Business jets, from Super Light Jet to Large Jet, contributed to the majority of the overall activity growth. The number of flights by those jets is above 30% higher than the normal level. The growth by Turboprop Aircraft is moderate (9.8%) because many of those PC12 flights are on regular routes such as Honolulu (PHNL) – Lanai (PHNY). Demand on those routes shares the same misfortune as commercial airlines. Growth from Ultra Long Range Jet is in the middle at 18.4% because many of those are long-distance international flights. A lot of international flights were suspended by different governments to minimize the spread of the COVID virus, although business aviation faced fewer restrictions than commercial flights.
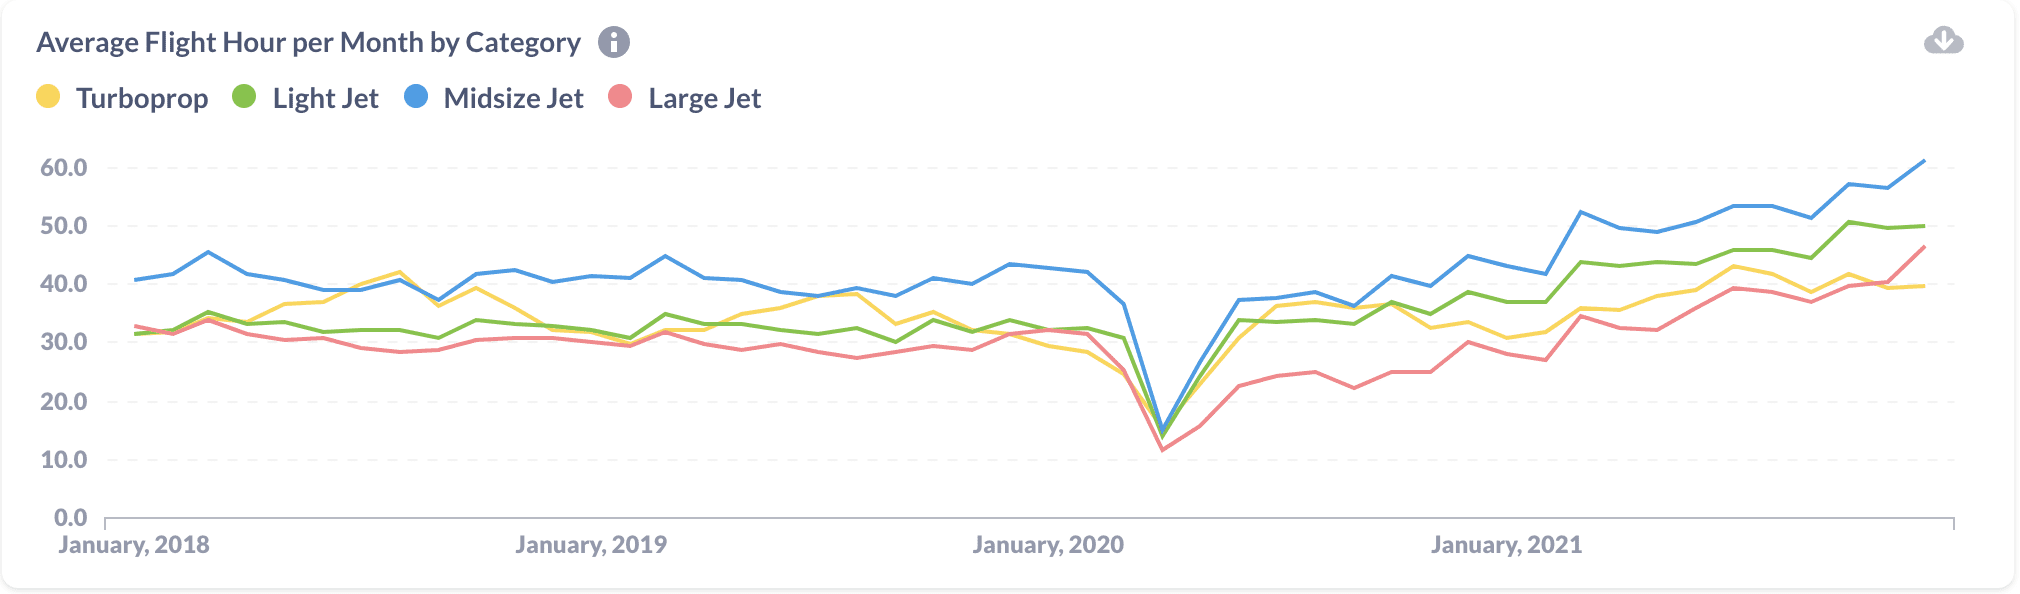
The utilization of Midsize Jets is always the highest among all business aviation aircraft. In 2021, the overall utilization of Midsize Jets grew from about 40 hours per month at the beginning of the year to 60 hours per month at the end of the year. The utilization of Light Jet and Large Jet also reached a new high level. Only the utilization of Turboprop is relatively flat after it recovered from the first COVID hit.
Growth by Origin
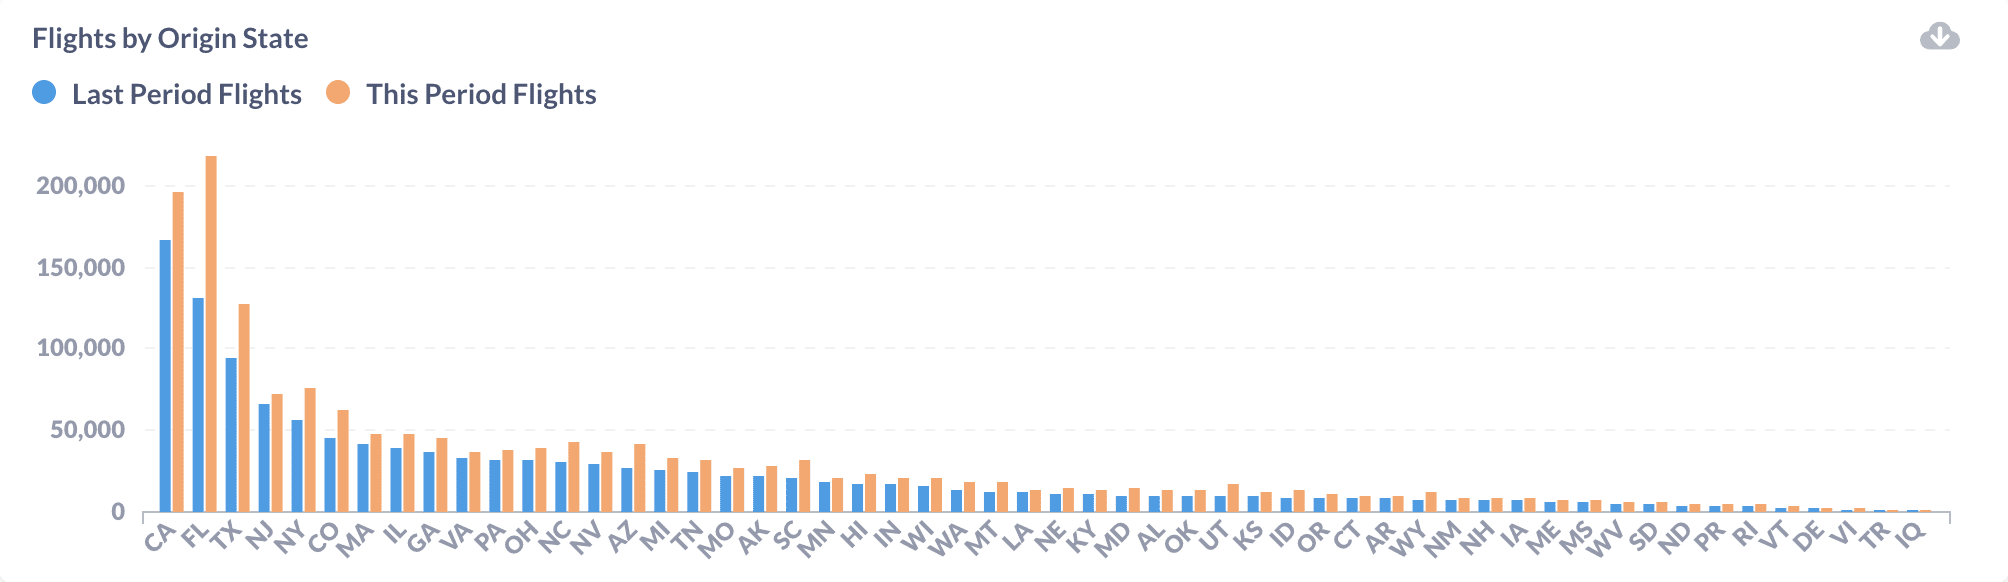
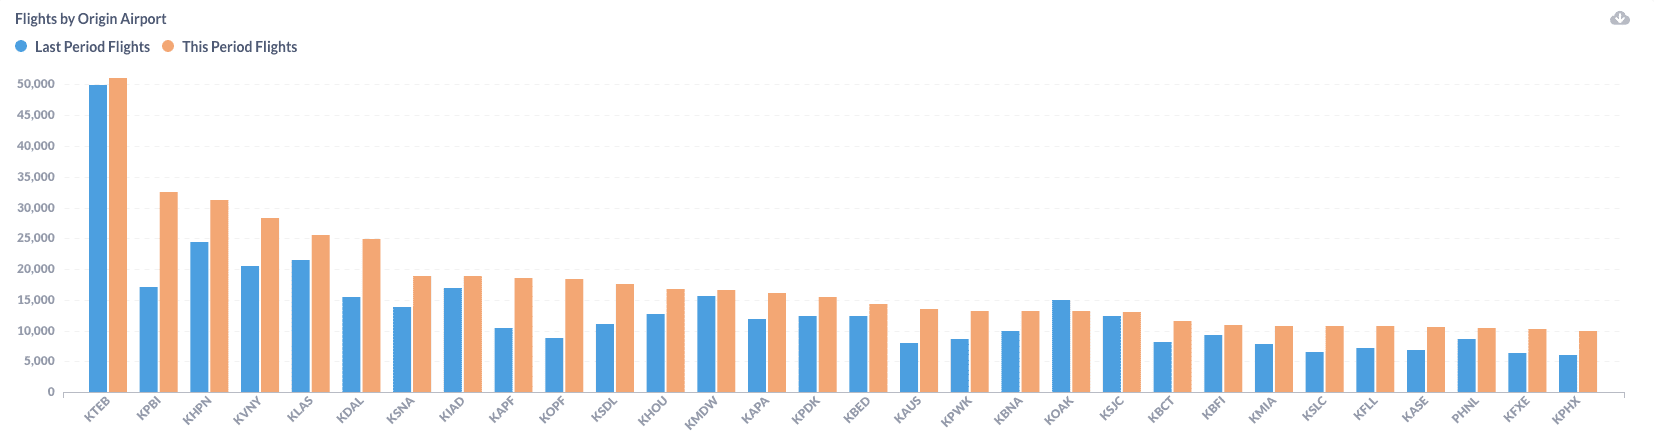
In terms of flights by origin, almost all states achieved significant growth. Florida is the largest winner: the number of total flights increased from 131,507 in 2019 to 217,914 in 2021. This amazing 65.7% growth put Florida ahead of California as the state with the most business aviation flights in the year. West Palm Beach Airport (KPBI) in Florida saw a 91% growth from 2019, making it the second-largest airport with business aviation flights in 2021. Teterboro Airport (KTEB) is still number one. But it only gained 2.4% more flights from 2019 to 2021. Another airport serving the New York city KHPN had a better performance, with a growth rate of 28% from 2019 to 2021.
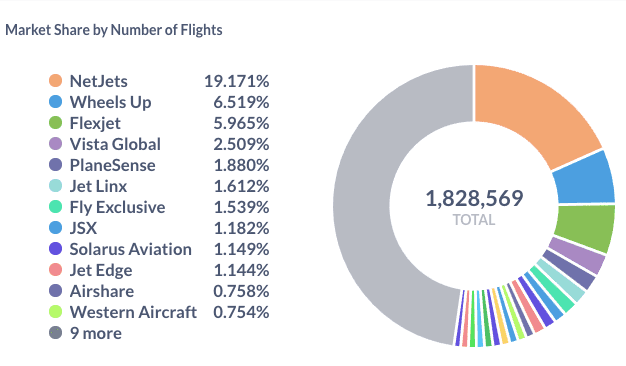
Changes by Operator
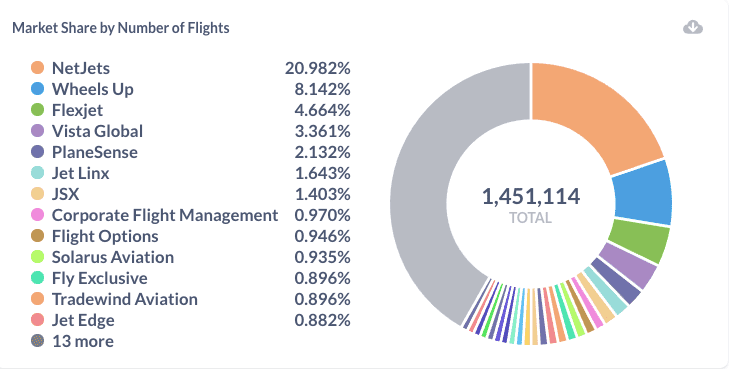
From 2019 to 2021, there are some share changes among top players in the US business aviation market. NetJets is still the 800-pound gorilla with around 1/5 of the total market. But some smaller players, such as Fly Exclusive, are growing faster and gaining market share. The only large player with a significant decrease is Corporate Flight Management, also known as Contour. It has a mixed business of private jet charter and regional airline. The regional airline business was obviously impacted more negatively by the COVID.
What the great year of 2021 for business aviation! We think 2022 will be a good year too. If the pandemic lingers around, people will prefer private flying over commercial flights. If the pandemic stops early, some passengers will stay with private flying, some people will increase travel frequency, and there will be fewer interruptions by infected pilots and staff. All those factors will keep the business aviation demand high, at least in 2022.