
Fligence Catchment – EU
Understand where your passengers truly come from—and where they are going instead.
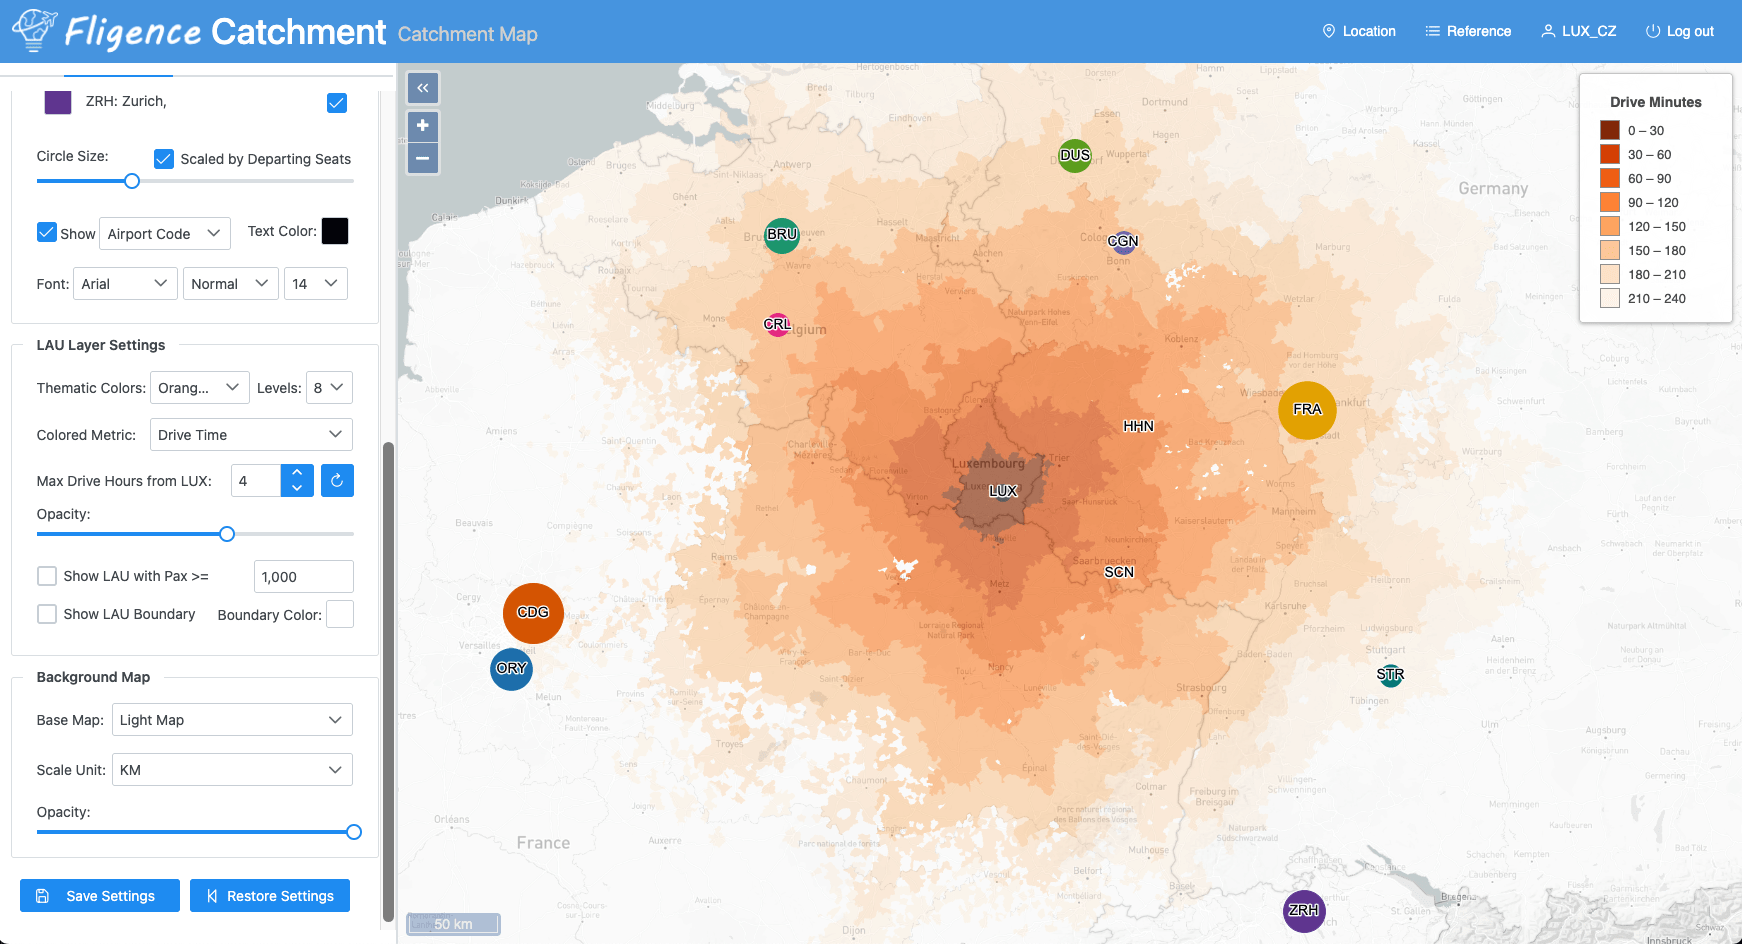
Fligence Catchment (EU) delivers a granular, behavior-based view of air travel demand across Europe using LAU-level geography, enabling smarter route development, marketing, and network decisions.
🌍 Why LAU-Level Matters
Traditional data sources (ticketing, surveys, model-based estimates) often mask local dynamics.
Fligence Catchment uses LAU (Local Administrative Units) to reveal:
- Fine-grained origin–destination patterns from/to your airport
- Leakage and competitive airport dynamics
- Micro-market demand pockets invisible in national or NUTS-level data
👉 See demand where it actually lives—not where aggregated data suggests.
🔍 What You Get
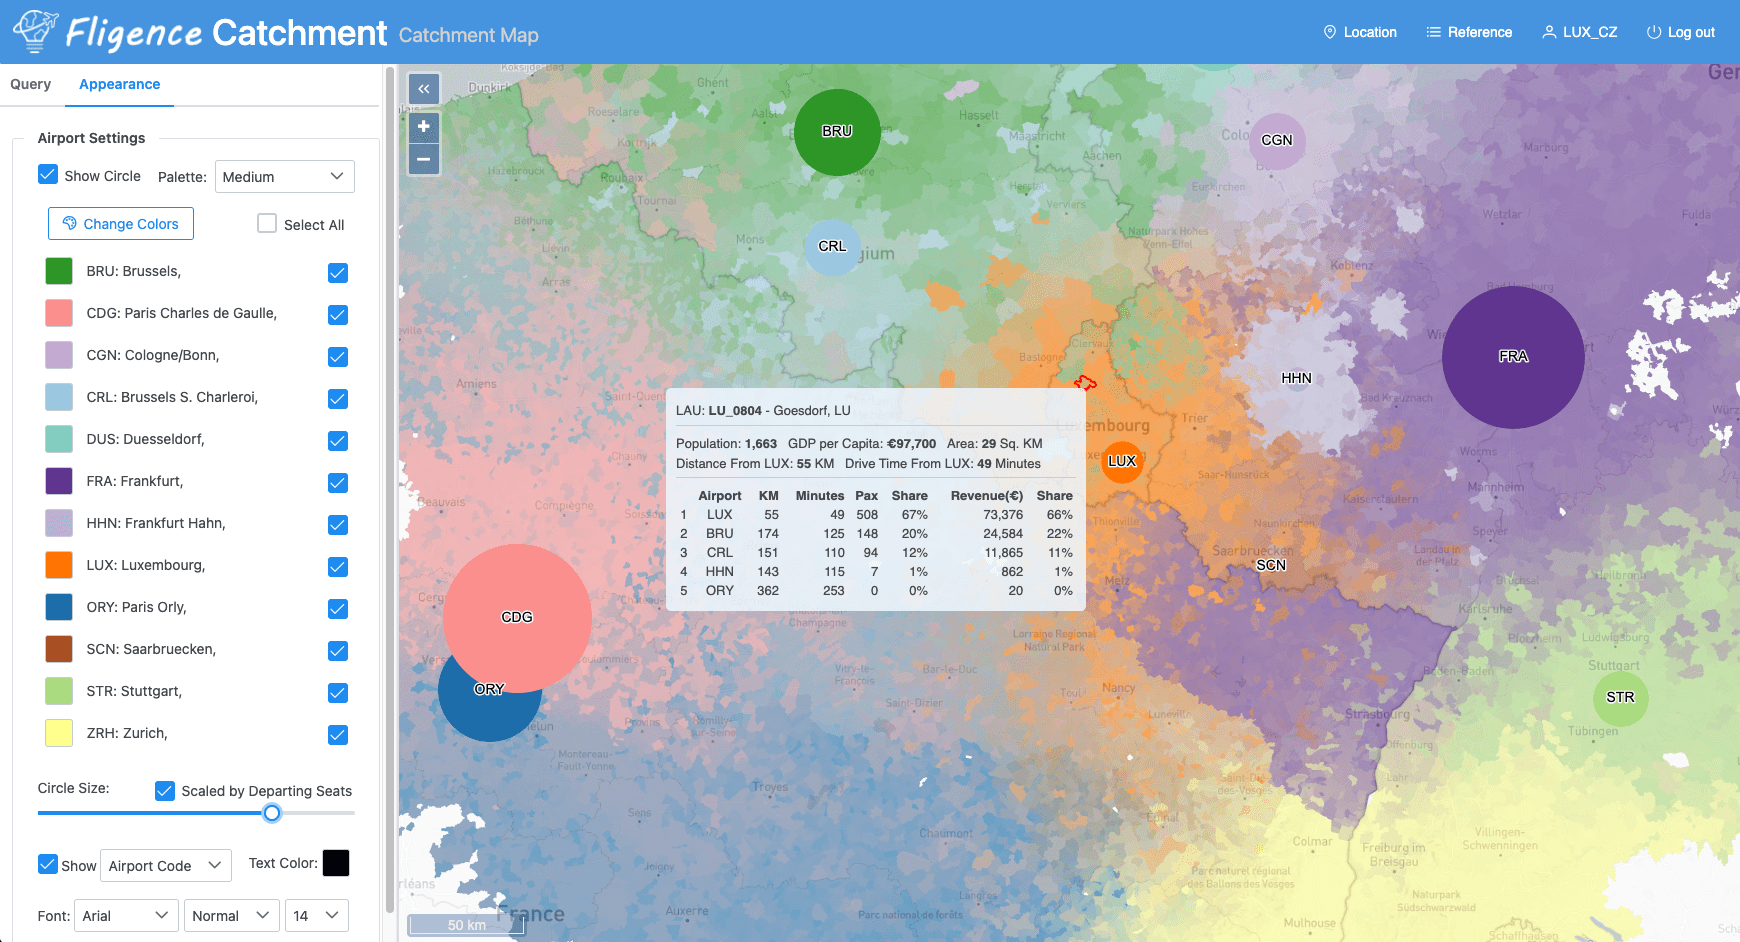
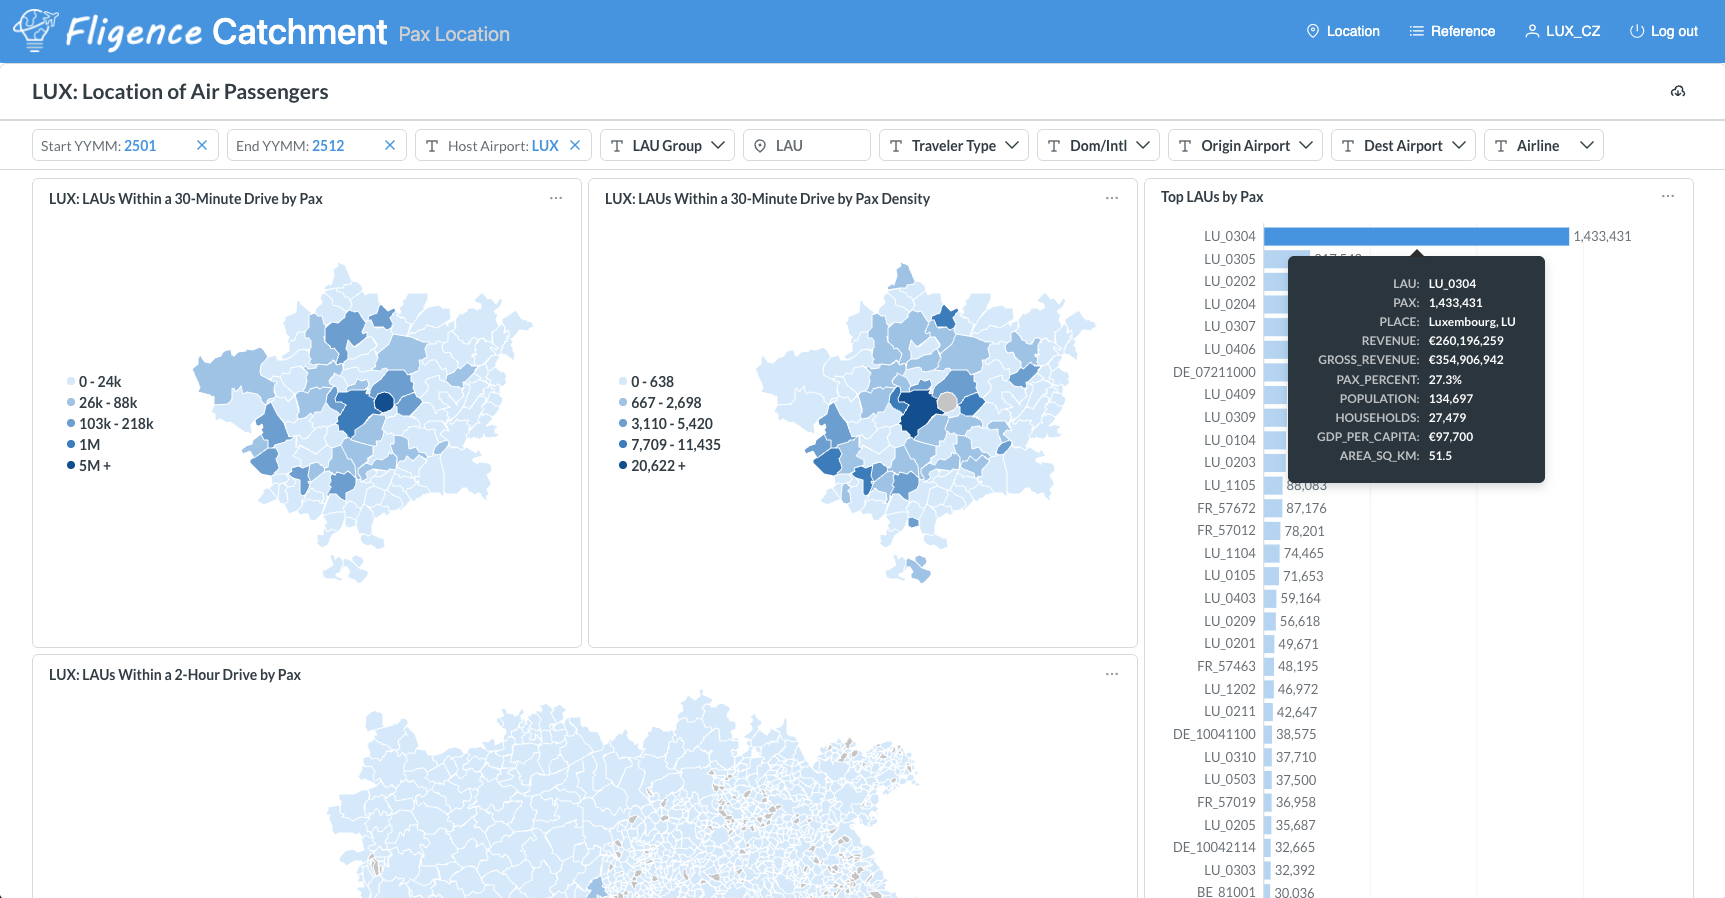
1. True Passenger Catchment
- LAU-level origin or destination breakdown for any route from/to your airport
- Contribution share by municipality
- Dynamic catchment maps (not static radius assumptions)
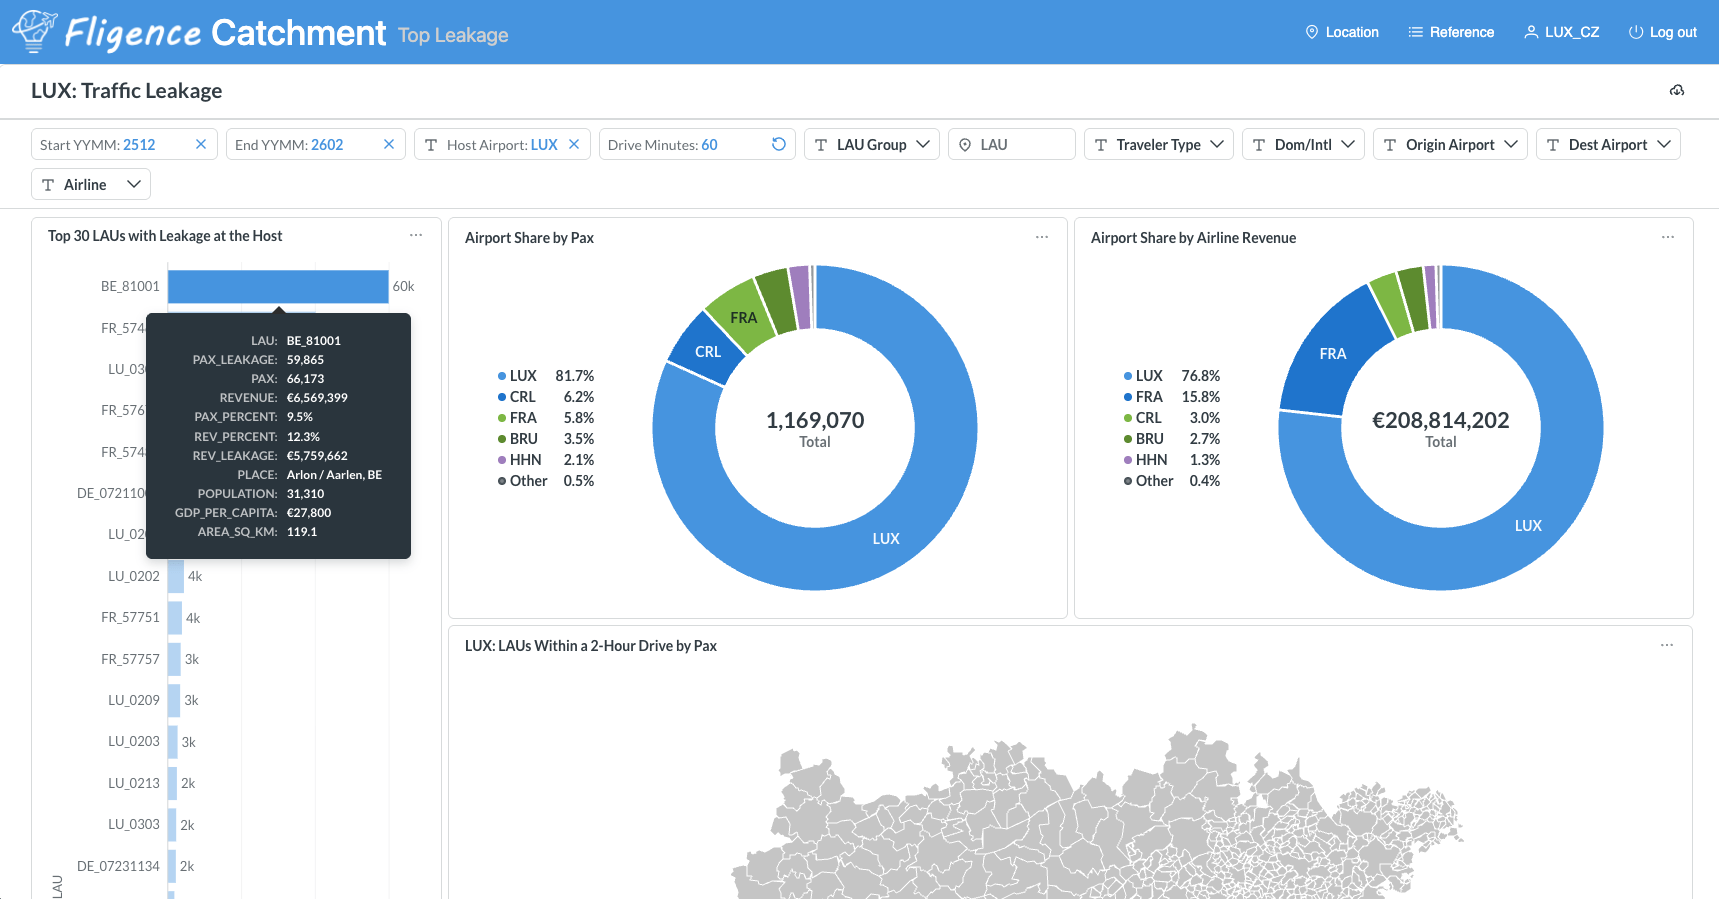
2. Leakage & Competition Analysis
- Identify where your passengers are choosing competing airports
- Quantify leakage by LAU, carrier and destination
- Compare performance vs nearby hubs and LCC airports
3. Route Opportunity Identification
- Discover underserved O&D markets at a local level
- Validate new route cases with real behavioral demand
- Support airline discussions with data-backed insights
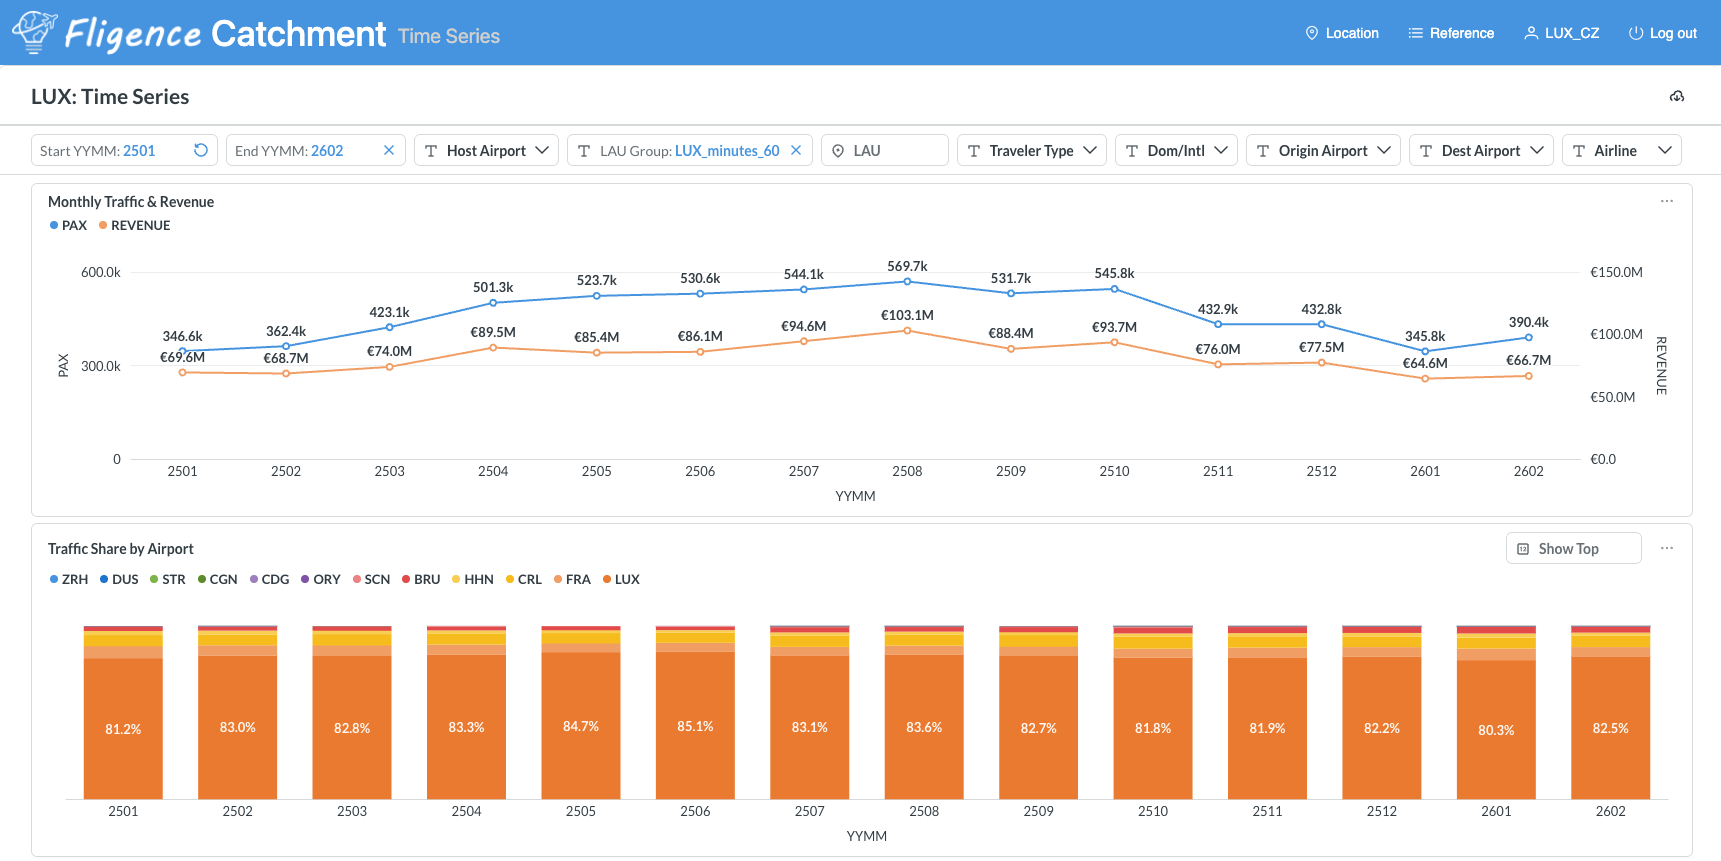
4. Time-Series Demand Trends
- Monthly evolution of catchment and leakage
- Seasonality and structural shifts
- Impact of airline capacity changes or new routes
🧠 Powered by Multi-Source Data
Fligence Catchment integrates:
- Commercial air travel flows (ticketing & modeled O&D)
- Mobile device movement patterns
- Hospitality data
- Census and economic data
👉 Result: a holistic, behavior-based view of passenger flows.
⚖️ Fligence vs Traditional Data
| Capability | Traditional Sources | Fligence Catchment |
|---|---|---|
| Geographic granularity | Country / airport | LAU-level |
| Leakage visibility | Limited | Directly measured |
| Behavioral insight | Search-based | Trip-based |
| Cross-border dynamics | Weak | Strong |
| Actionability | Moderate | High |
Most existing catchment tools rely on search data. However, search data is not a reliable representation of true airport catchment for several reasons:
- Lookers ≠ bookers. Not everyone who searches for flights actually travels.
- IP addresses ≠ home addresses. Search locations often reflect VPN endpoints or a user’s temporary location, rather than their true place of residence.
- Search patterns ≠ travel patterns. Actual passenger flows can differ significantly from search behavior.
Here is a white paper outlining the risks and limitations of using search data for airport catchment analysis.
🏆 Built for Decision Makers
Airports (ASD / Marketing)
- Strengthen airline business cases
- Optimize catchment targeting
- Quantify leakage and defend traffic
Airlines (Network Planning)
- Evaluate true local demand
- Identify hidden O&D opportunities
- Optimize airport selection
Consultants & Analysts
- Deliver deeper, more defensible insights
- Enhance advisory work with granular evidence
⚙️ Product Delivery
- Web-based platform (interactive maps & dashboards)
- Downloadable datasets for deeper analysis
Update frequency: Monthly
Coverage: Pan-European (EU + select neighboring markets)
💬 Why It Matters
In today’s competitive aviation landscape, understanding passenger behavior at a local level is no longer optional.
Fligence Catchment (EU) gives you:
- Leverage in airline negotiations
- Clarity on where demand originates
- Confidence in your strategy
Schedule a live demo to see how Fligence Catchment helps you secure new air service and grow passenger demand.