Traffic and fare data by airline and route can provide valuable insights into market trends, demand, and competition. By analyzing this data, airlines can optimize their pricing strategies, plan their capacity, and make informed decisions about their route network. The data can also be used for market and competitive analysis, helping airlines identify profitable routes and gain a competitive advantage.
According to initial true O&D level data from FlightBI released this week, total U.S. domestic air travel increased in May 2025 compared to April. International travel volumes also saw a modest uptick. Additional, average airfares rose during the same period.
Volume Trend
In May 2025, U.S. domestic passenger traffic rose from 52.9 million in April to 56.0 million, marking a 1.1% increase over the 55.4 million recorded in May 2024. International passenger volumes also grew, rising from 21.2 million in April to 22.6 million in May.
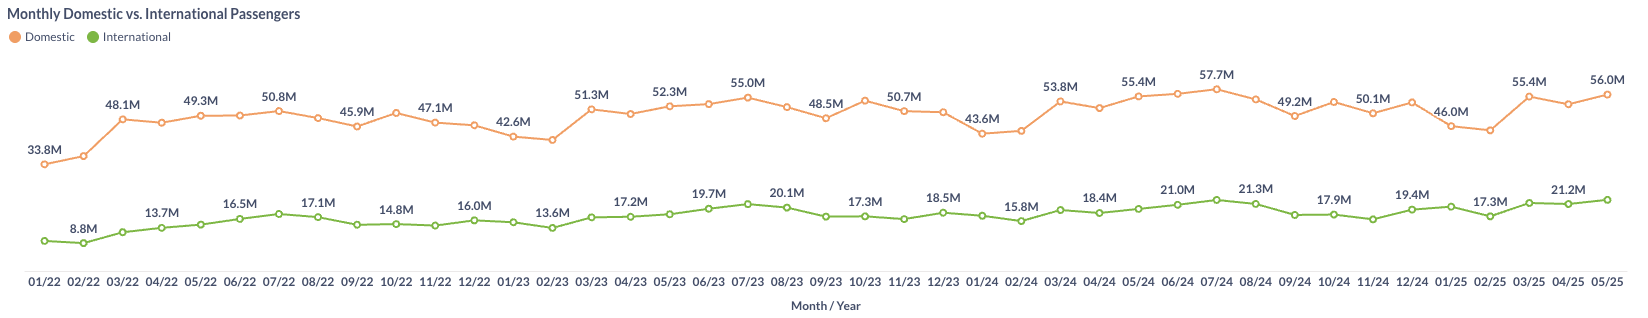
Figure 1: US Domestic and International Air Traffic by Month
Airfare Trend
Airfare trends continued upward in May 2025, with the average gross fare rising from $216 in April to $221. Similarly, the average net fare increased from $185 to $190 during the same period.
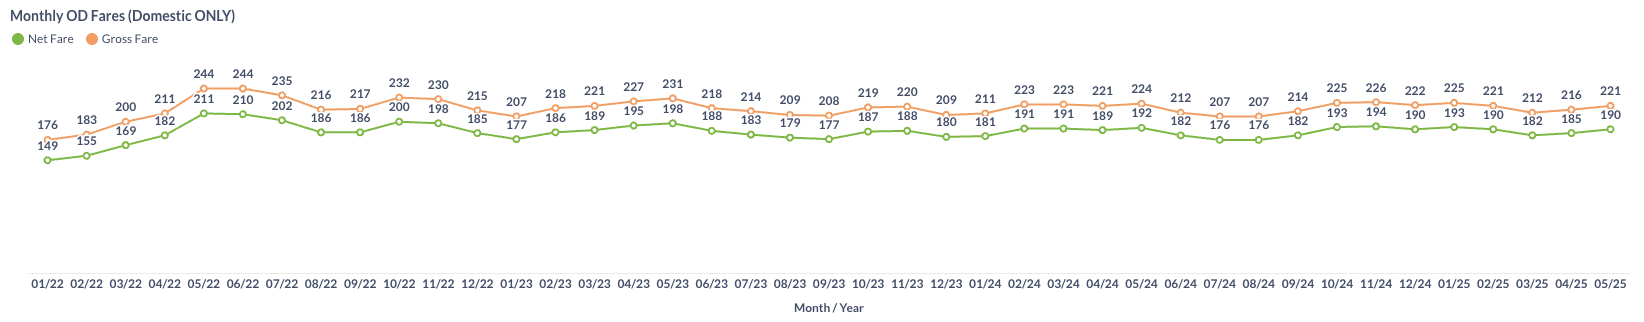
Figure 2: US Domestic Average Airfare by Month
Load Factor Trend
In May 2025, both Available Seat Miles (ASM) and Revenue Passenger Miles (RPM) increased compared to the previous month. The average load factor for major U.S. airlines rose to 82.4%, though it remained below the 84.5% recorded in May 2024, as shown in Figure 3.
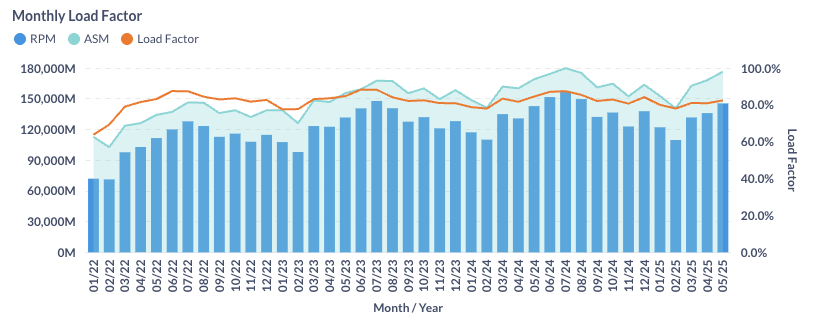
Figure 3: US Airlines’ Average Load Factor by Month
Month Over Month Comparison
In May 2025, several U.S. airlines saw a decline in daily domestic traffic compared to April. Frontier Airlines (F9) led the decrease with a 6.6% drop, followed by JetBlue (B6) at 3.1% and Allegiant Air (G4) at 2.6%. In contrast, network carriers such as Delta Air Lines (DL) and American Airlines (AA) reported gains of 6.1% and 4.8%, respectively. Southwest Airlines (WN) also posted an increase in daily traffic.
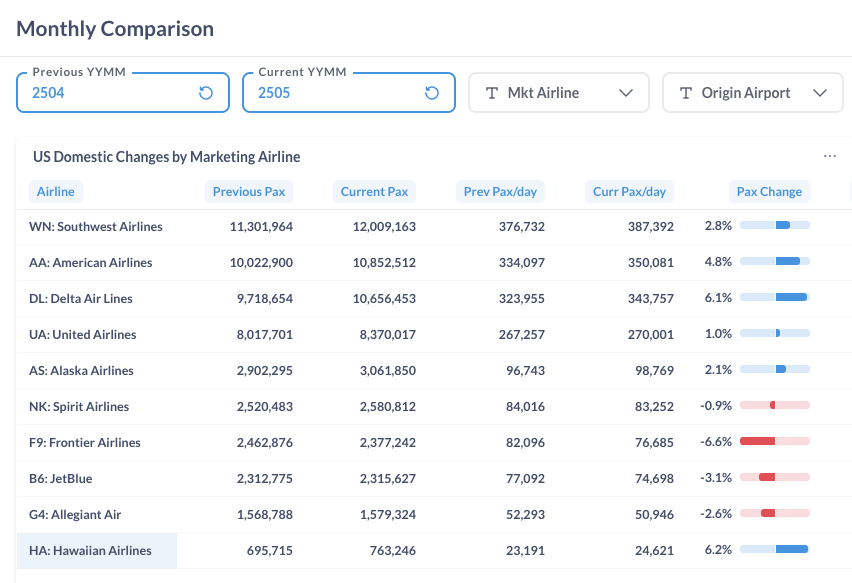
Figure 4: Domestic Air Traffic by Marketing Airlines in April 2025 (Previous) vs. May 2025 (Current)
Airport-level trends in May 2025 were mixed. Atlanta (ATL) and New York LaGuardia (LGA) posted strong growth, with passenger traffic rising 13.4% and 12.1%, respectively. In contrast, Fort Lauderdale (FLL) and Newark (EWR) experienced declines of 13.4% and 11.6%.
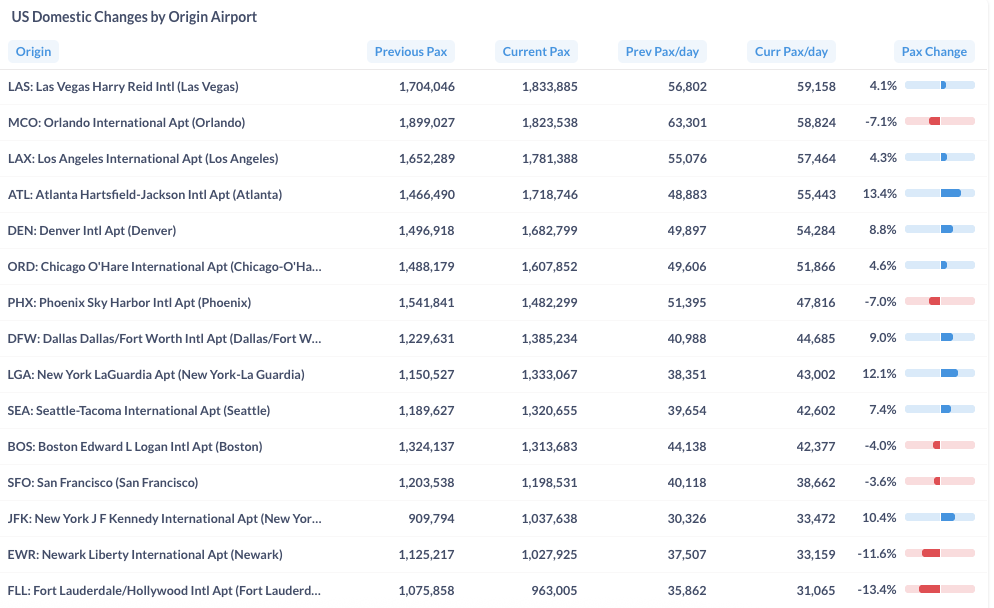
Figure 5: Domestic Air Traffic by Top Airports in March 2025 (Previous) vs. April 2025 (Current)
Year Over Year Comparison
Between May 2024 and May 2025, several airlines reported year-over-year growth. Allegiant Air (G4) and Hawaiian Airlines (HA) led the gains with increases of 10.8% and 9.1%, respectively. In contrast, Spirit Airlines (NK) recorded the sharpest decline, with traffic down 21.8%. Southwest Airlines (WN) also reported a year-over-year decrease in daily traffic.
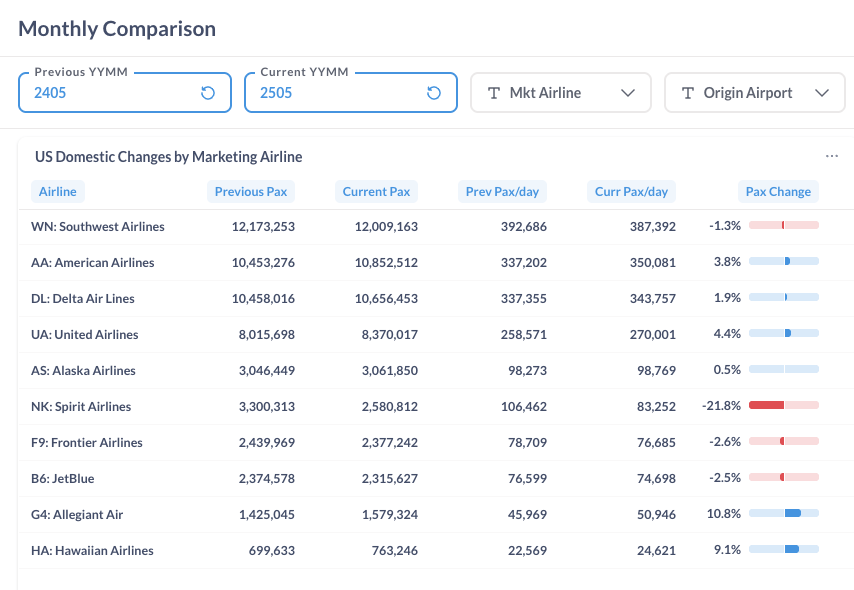
Figure 6: Domestic Air Traffic by Marketing Airlines in May 2025 (Current) vs. May 2024 (Previous)
From May 2024 to May 2025, some major U.S. airports experienced increased traffic while others saw declines. The most significant change was at Newark Airport (EWR), which saw a 16.2% drop in traffic due to FAA-imposed flight caps aimed at alleviating operational strain. As a result, traffic was rerouted to nearby airports, contributing to a 15.4% increase at New York John F. Kennedy Airport (JFK) and a 7.9% rise at LaGuardia Airport (LGA).
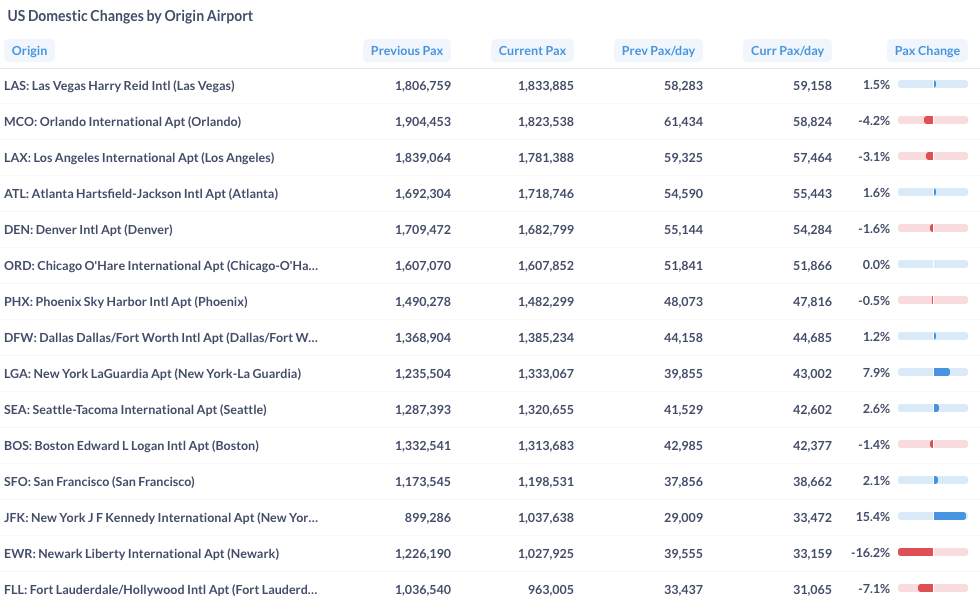
Figure 7: Domestic Air Traffic by Top Origin Airport in May 2025 (Current) vs. May 2024 (Previous)
For more detailed information on traffic and fares by route and airline, please contact service@flightbi.com or request a demo of Fligence USOD. They will be able to provide you with customized information to meet your specific needs and requirements.