Traffic and fare data by airline and route can provide valuable insights into market trends, demand, and competition. By analyzing this data, airlines can optimize their pricing strategies, plan their capacity, and make informed decisions about their route network. The data can also be used for market and competitive analysis, helping airlines identify profitable routes and gain a competitive advantage.
According to initial true O&D level data from FlightBI released this week, total US domestic air travel declined in February 2025 compared to January, reflecting typical seasonal trends. Likewise, U.S. international air travel saw a dip, accompanied by a decrease in average airfares during the same period.
Volume Trend
In February 2025, U.S. domestic passenger numbers declined from 46.2 million in January to 44.9 million, though this remained 1.0% higher than the 44.5 million recorded in February 2024. In the international sector, passenger volumes fell from 20.4 million in January to 17.4 million in February.
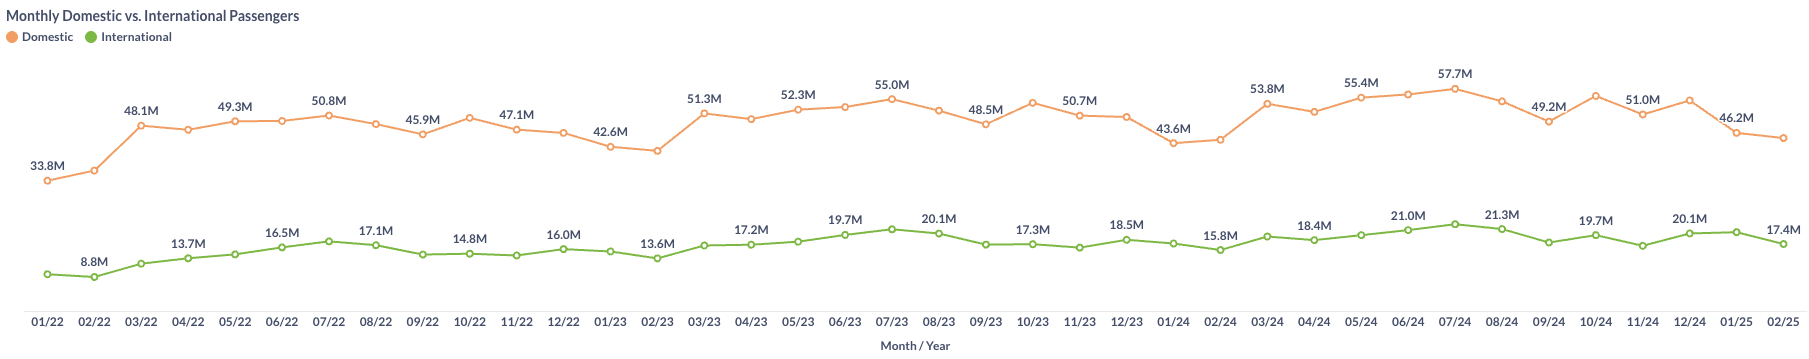
Figure 1: US Domestic and International Air Traffic by Month
Airfare Trend
Airfares continued to decline in February 2025. The average gross fare fell from $209 in January to $205, while the average net fare dropped from $178 to $175 over the same period.
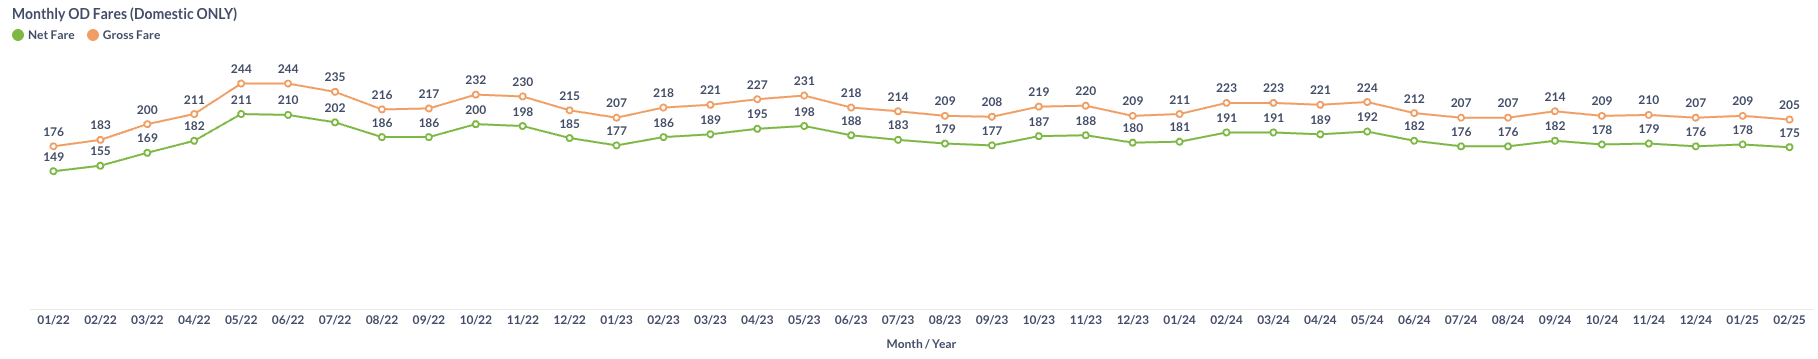
Figure 2: US Domestic Average Airfare by Month
Load Factor Trend
In February 2025, both Available Seat Miles (ASM) and Revenue Passenger Miles (RPM) declined from the previous month. The average load factor for major U.S. airlines also dropped to 77.7%, slightly below the 78.0% recorded in February 2024, as shown in Figure 3.
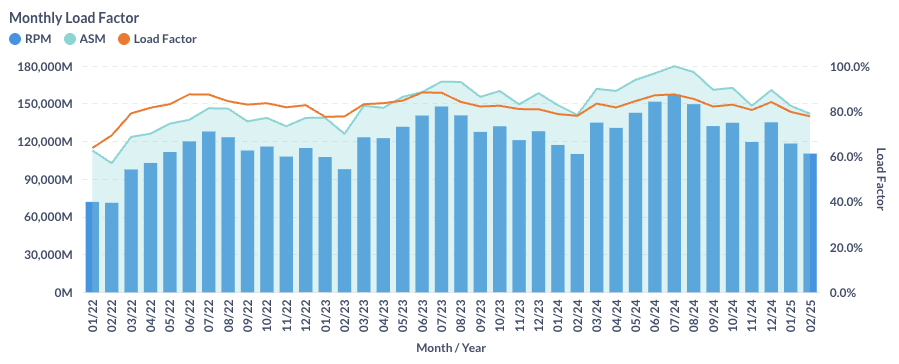
Figure 3: US Airlines’ Average Load Factor by Month
Month Over Month Comparison
In February 2025, all major U.S. airlines—except Spirit Airlines—saw an increase in daily traffic compared to January. Southwest (WN) led the growth with a 12.0% rise, followed by two other low-cost carriers: Frontier (F9) at 9.2% and Allegiant (G4) at 8.5%. In contrast, Spirit Airlines (NK) experienced a 1.4% decline in daily volume.
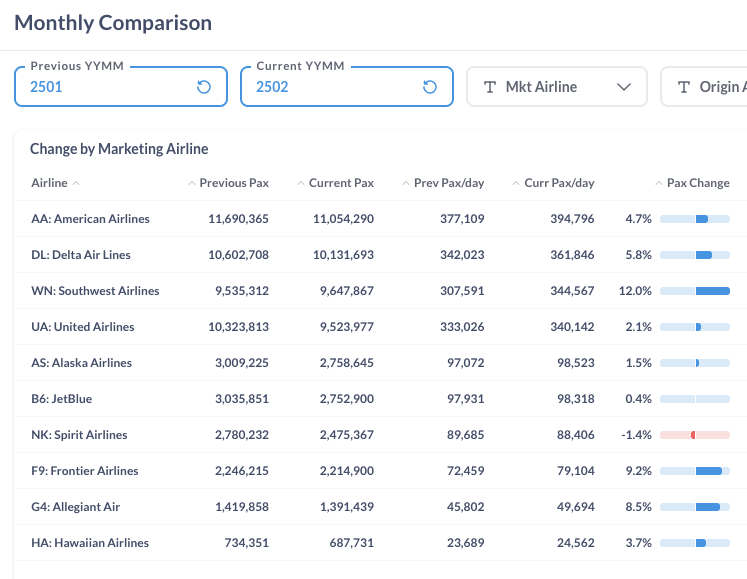
Figure 4: Air Traffic by Dominant Marketing Airlines in January 2025 (Previous) vs. February 2025 (Current)
Airport-level changes presented a mixed picture in February 2025. Boston (BOS), Phoenix (PHX), and Atlanta (ATL) led in traffic growth, with increases of 12.8%, 10.1%, and 9.1%, respectively. In contrast, Florida airports saw declines, with Miami (MIA), Fort Lauderdale (FLL), and Orlando (MCO) experiencing traffic drops of 3.7% and 2.8%.
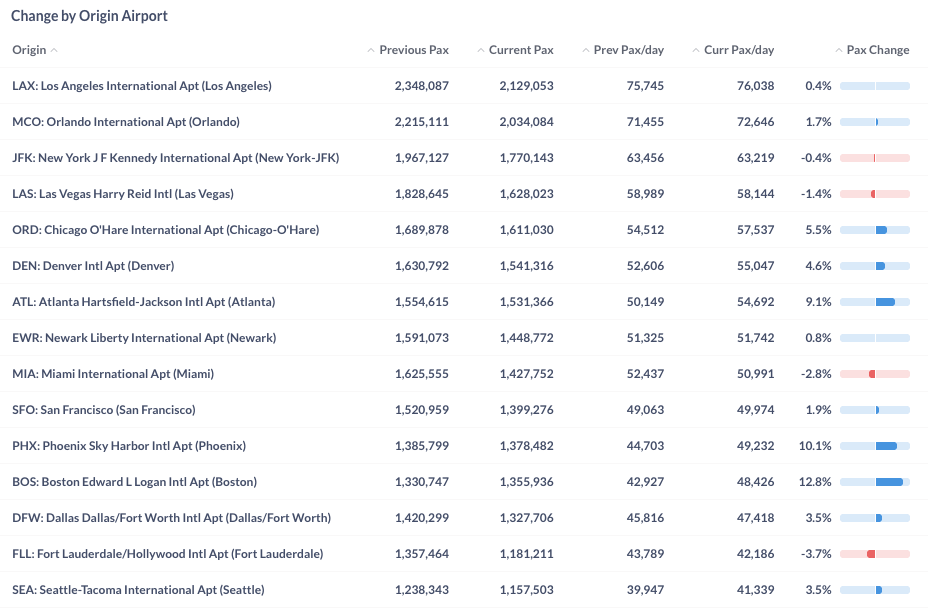
Figure 5: Air Traffic by Top Origin Airports in January 2025 (Previous) vs. February 2025 (Current)
Year Over Year Comparison
Between February 2024 and February 2025, most major U.S. airlines saw year-over-year growth, led by Frontier Airlines (F9) and Allegiant (G4), which posted increases of 20.2% and 15.2%, respectively. In contrast, Spirit Airlines (NK) reported a 16.4% decline in traffic, attributed to its ongoing bankruptcy restructuring.
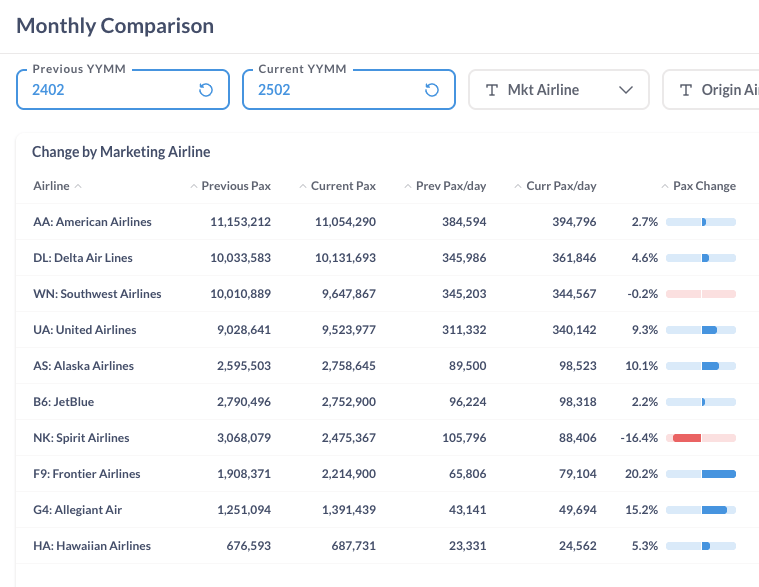
Figure 6: Air Traffic by Dominant Marketing Airlines in February 2025 (Current) vs. February 2024 (Previous)
From February 2024 to February 2025, most major U.S. airports experienced increased traffic, led by San Francisco (SFO), Dallas/Fort Worth (DFW), and Chicago O’Hare (ORD), with year-over-year growth of 17.6%, 15.2%, and 13.7%, respectively.
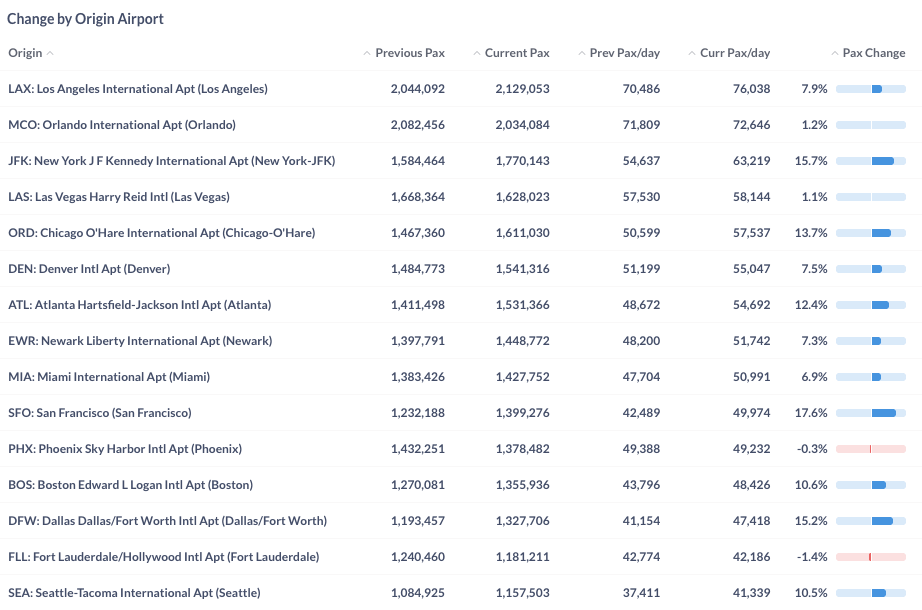
Figure 7: Air Traffic by Top Origin Airport in February 2025 (Current) vs. February 2024 (Previous)
For more detailed information on traffic and fares by route and airline, please contact service@flightbi.com or request a demo of Fligence USOD. They will be able to provide you with customized information to meet your specific needs and requirements.