Daily and hourly airport traffic is crucial for businesses related to airports, including airport authorities, airlines, retailers, ground handlers, rental car companies, and hotels. If you belong to any of these industries, utilizing daily airport traffic data can help you plan your operations, schedule your resources, forecast revenue, and plan budgets more accurately. Additionally, this data can help you target your marketing and promotional efforts more specifically, leading to more effective business strategies.
FlightBI collects and normalizes the airport passenger throughput data from US Transportation Security Administration (TSA). In addition, it has developed a product called Fligence TSA, which features a wide variety of data visualizations. FlightBI is currently offering a two-week, no-obligation trial of Fligence TSA for you to explore valuable insights from the airport traffic data.
This article summarizes US air traffic using the aforementioned tool, utilizing actual airport-level data as of April 10th, 2025. Our analysis will examine trends in different segments of air travel, such as domestic versus international flights and leisure versus business travel. To learn more about the specific airports chosen to represent these markets, please refer to this article.
U.S. Airport Traffic Overview
The U.S. airport system experienced its first wave of growth in 2025, with passenger throughput peaking toward the end of March, as shown in Figure 1. Forecasts indicate continued growth, with daily passenger numbers expected to surpass 2.6 million by May. However, total traffic for May may still fall short of last year’s levels.
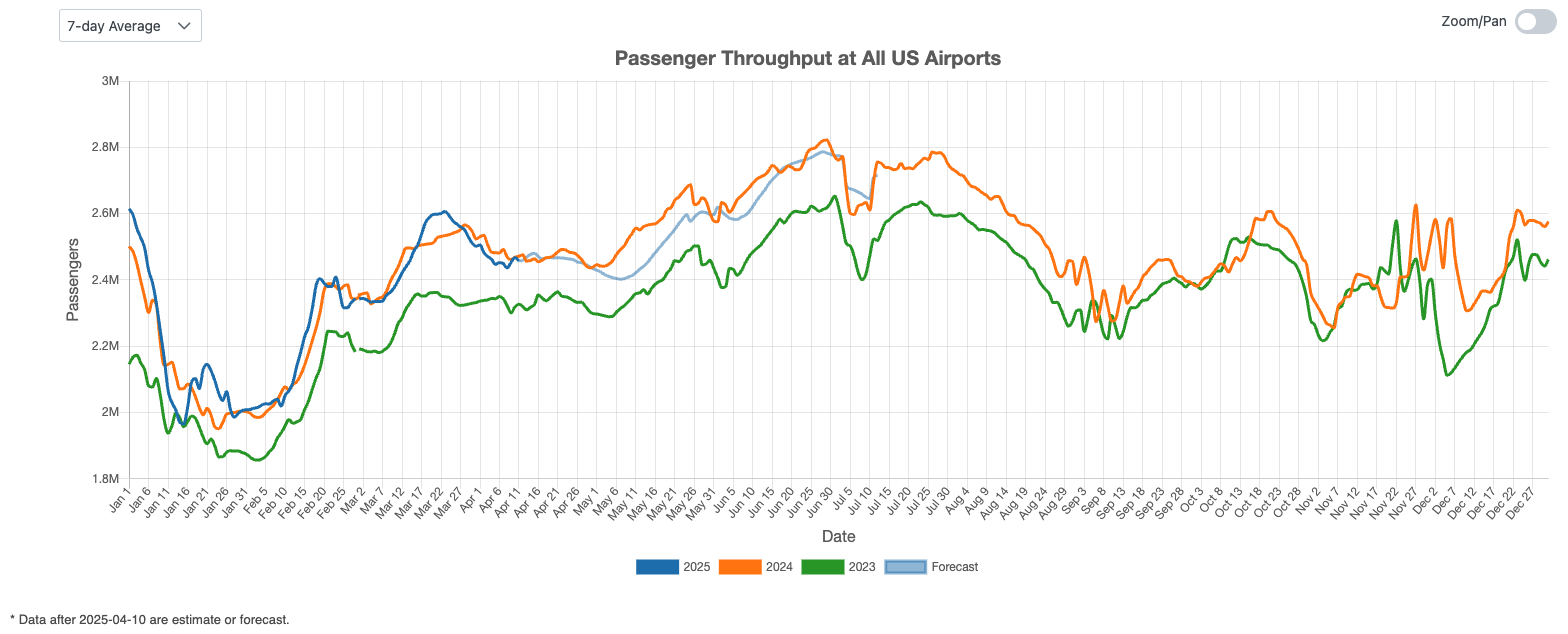
Figure 1: US Overall Air Traffic Trend
Domestic Airport Traffic Indicator
Figure 2 highlights domestic travel trends at major airports such as Charlotte (CLT), Denver (DEN), and Phoenix (PHX), all of which followed a similar upward trajectory in March. Although there was a brief dip at the beginning of the month, a swift rebound brought the 2025 trend back on its growth path. The forecast projects a temporary slowdown during the last 10 days of March and into April, followed by renewed growth approaching the summer months.
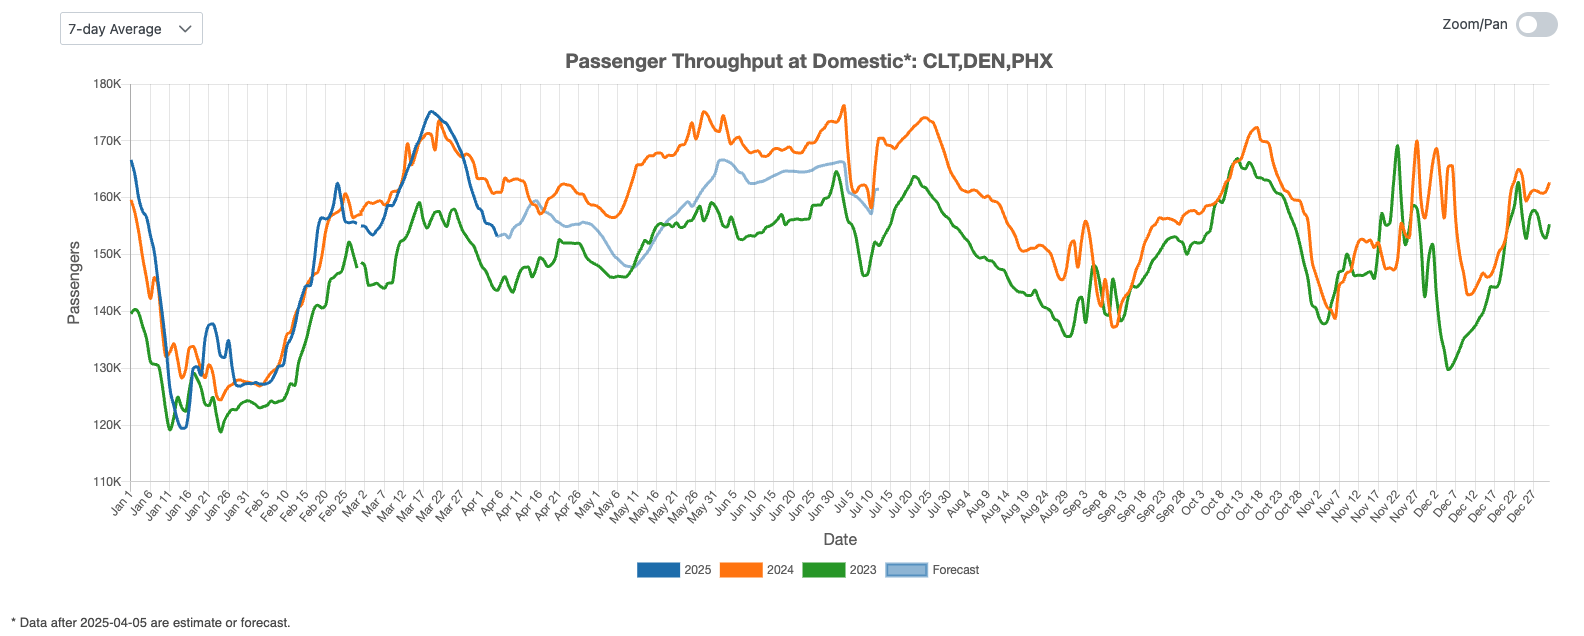
Figure 2: US Domestic Air Traffic Indicator
International Airport Traffic Indicator
Figure 3 shows fluctuations in passenger volumes at New York’s JFK Airport, a major hub for international travel. In the first half of March, the 2025 trend slightly outpaced last year’s levels but declined in the latter half of the month. Despite this dip, the outlook remains positive, with projections indicating steady growth through the spring and summer seasons.
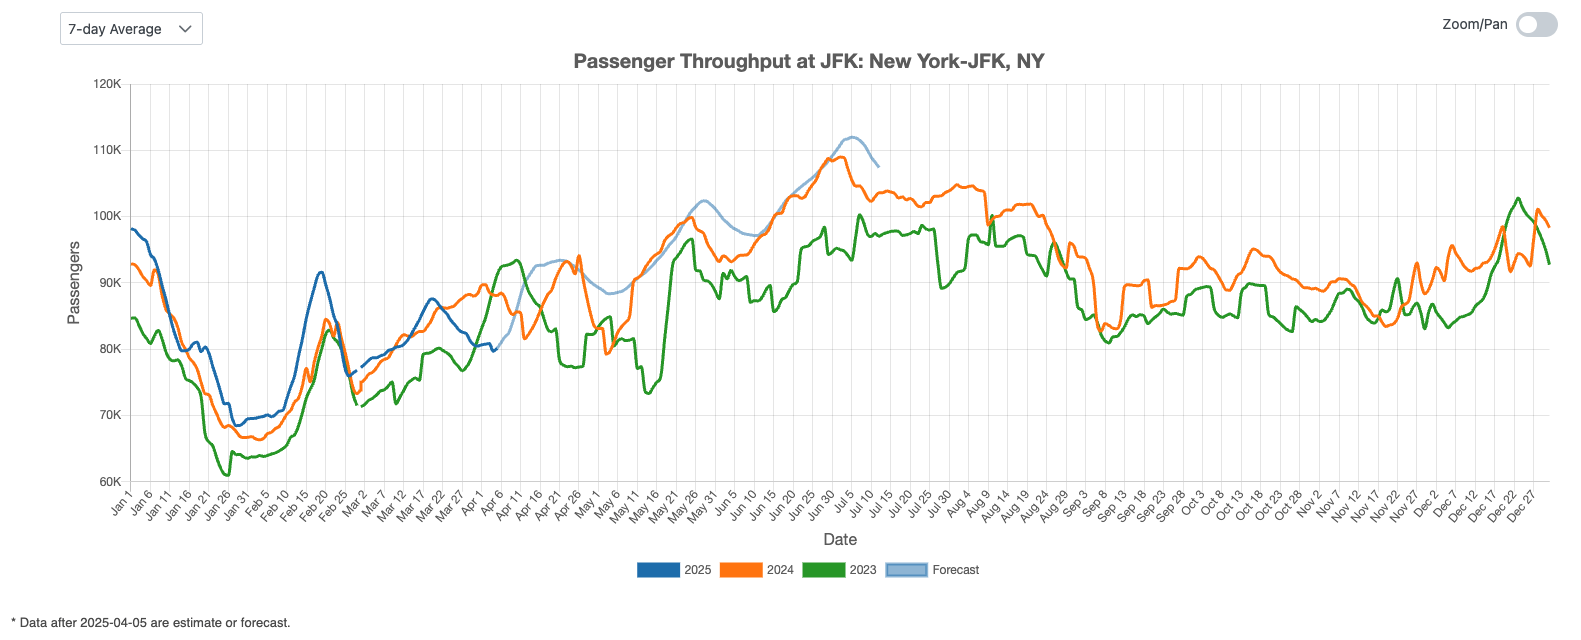
Figure 3: US International Air Traffic Indicator
Leisure Air Traffic Indicator
Figure 4 provides an overview of the U.S. leisure air travel market. In 2025, the trend exhibits more pronounced seasonality, starting lower in March but quickly rebounding to match 2024 levels. The forecast suggests that traffic volumes will remain comparable to last year in the coming months.
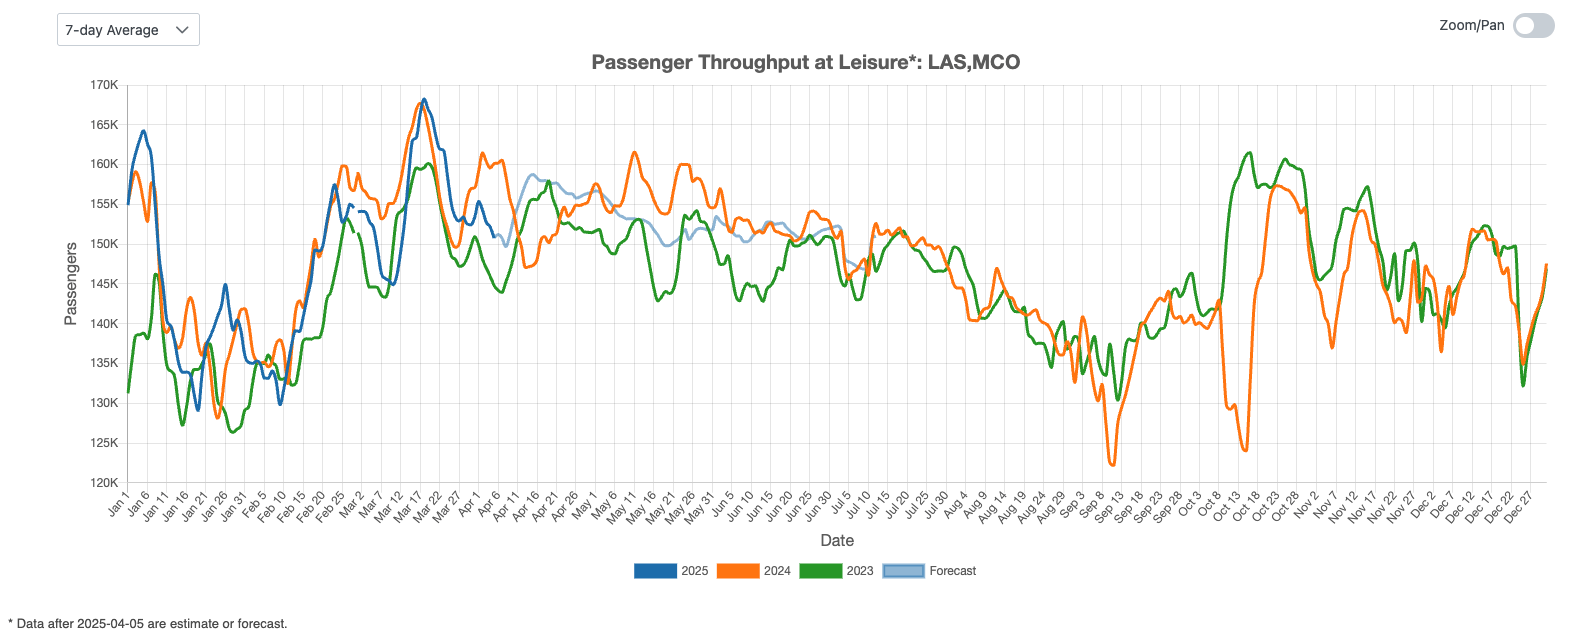
Figure 4: US Leisure Air Traffic Indicator
Business Air Traffic Indicator
Figure 5 highlights the upward trend in business travel, with passenger volumes in March 2025 approaching those of the same period in 2024. Projections suggest continued growth in the months ahead.
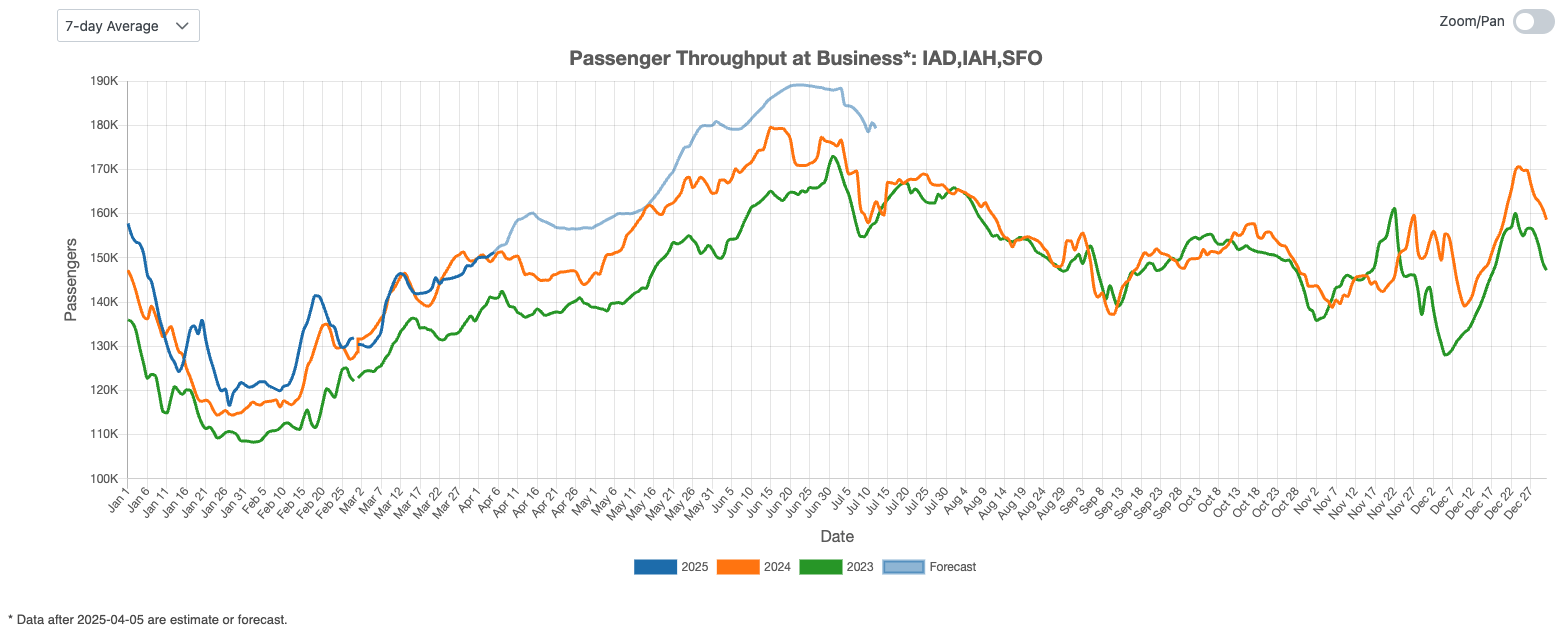
Figure 5: US Business Air Traffic Indicator
In early 2025, the U.S. air travel market has shown signs of recovery and growth. Passenger volumes peaked in late March, with domestic airports like CLT, DEN, and PHX following a steady upward trend despite a brief early dip. International travel at JFK saw fluctuations, with a strong start in March followed by a decline, though the outlook remains positive. Leisure travel demonstrated stronger seasonality, rebounding quickly to match 2024 levels, while business travel continues to grow, nearing last year’s volumes. Forecasts indicate steady growth across all segments into the spring and summer months.