Traffic and fare data by airline and route can provide valuable insights into market trends, demand, and competition. By analyzing this data, airlines can optimize their pricing strategies, plan their capacity, and make informed decisions about their route network. The data can also be used for market and competitive analysis, helping airlines identify profitable routes and gain a competitive advantage.
Based on initial true O&D level data from FlightBI released this week, total US domestic air travel continue to decline in December 2024 from the previous month, reflecting typical seasonal patterns. Likewise, U.S. international air travel saw a decrease, while average airfares increased during this period.
Volume Trend
In December 2024, domestic passenger numbers grew from 50.4 million in November to 54.2 million, which is 7.5% higher than December 2023’s 50.4 million. In the international sector, passenger numbers increased from 19.1 million in November to 22.2 million in December 2024.
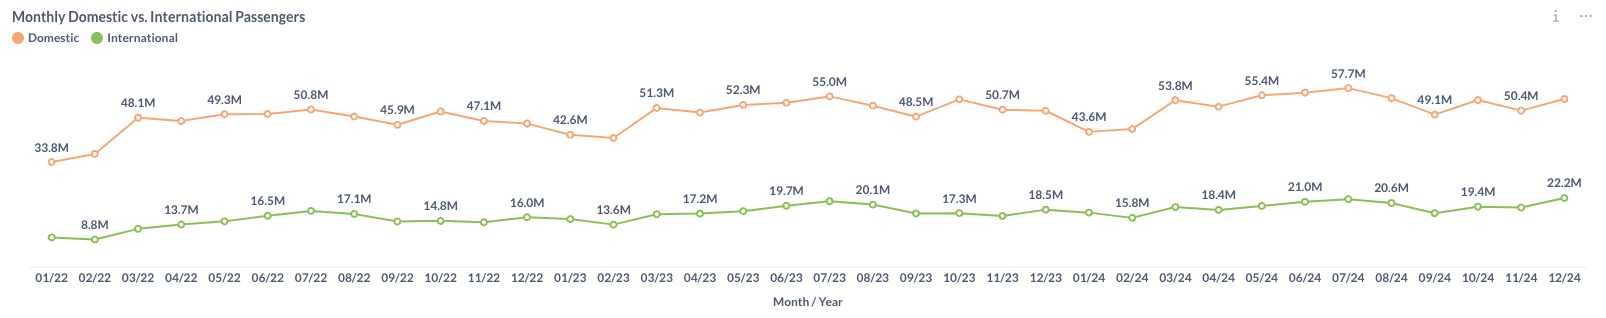
Figure 1: US Domestic and International Air Traffic by Month
Airfare Trend
Airfares start to decrease. The average gross fare declined from $227 in November to $222 in December, while the average net fare also fell from $193 to $189 during the same period.
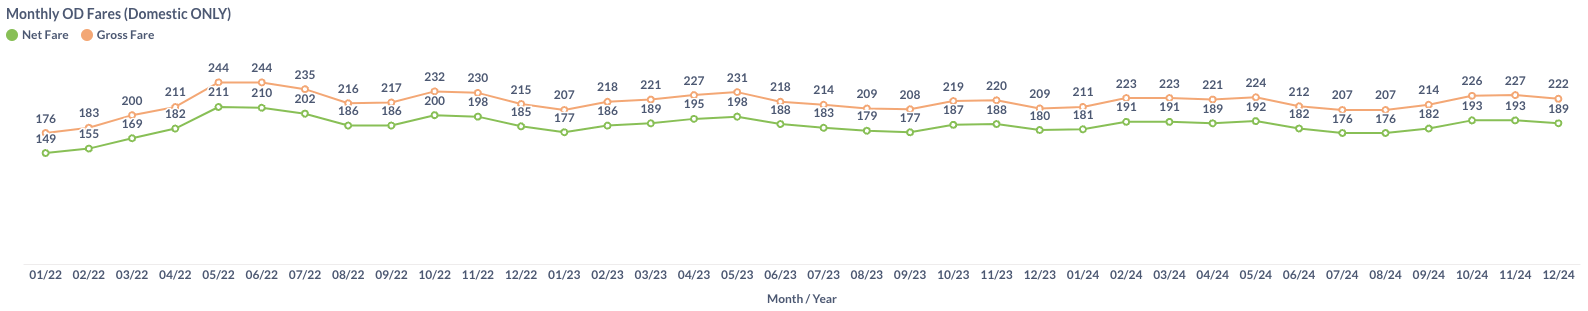
Figure 2: US Domestic Average Airfare by Month
Load Factor Trend
In December 2024, both Available Seat Miles (ASM) and Revenue Passenger Miles (RPM) increased from the previous month. The average load factor for major U.S. airlines are also improved to 83.9%, as shown in Figure 3., which is higher than the 80.9% recorded in December 2023.
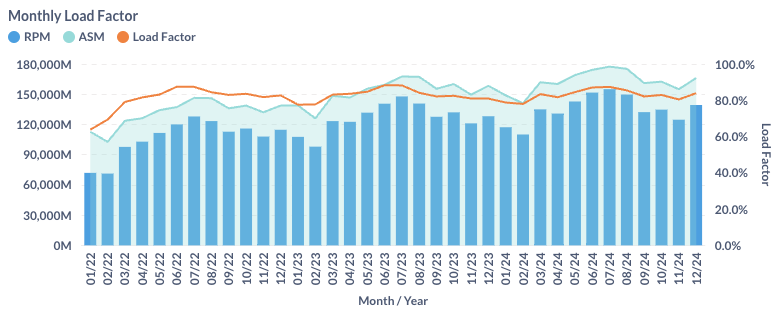
Figure 3: US Airlines’ Average Load Factor by Month
Month Over Month Comparison
In December 2024, most major U.S. airlines experienced an expension in daily traffic compared to November. Allegiant (G4) saw the largest growth, with a 29.0% increase due to winter holidays. Similarly, another ULCC Frontier (F9) also reported growth of 13.2%.
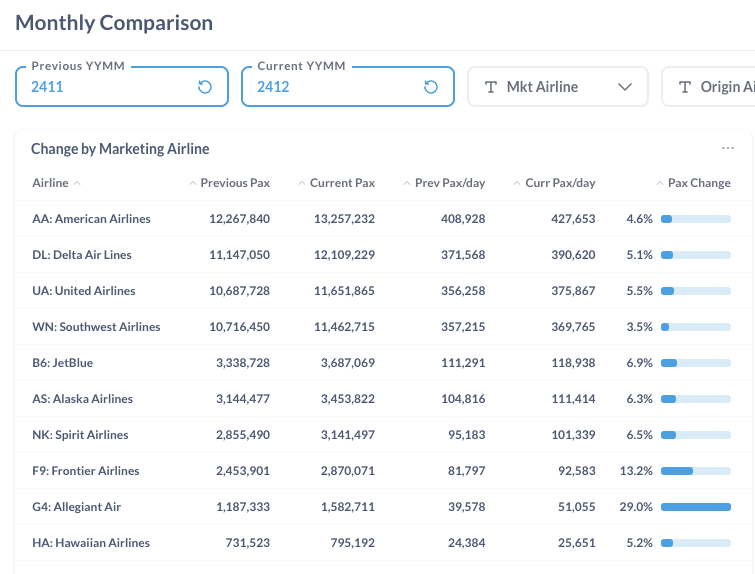
Figure 4: Air Traffic by Dominant Marketing Airlines in November 2024 (Previous) vs. December 2024 (Current)
During this period, traffic expanded at most airports, with Miami (MIA) and New York (JFK) showing month-over-month increases of 13.7% and 10.3%, respectively. On the other hand, Las Vegas (LAS) and Boston (BOS) only had 1.8%% and 2.0% increase in traffic over the same period.
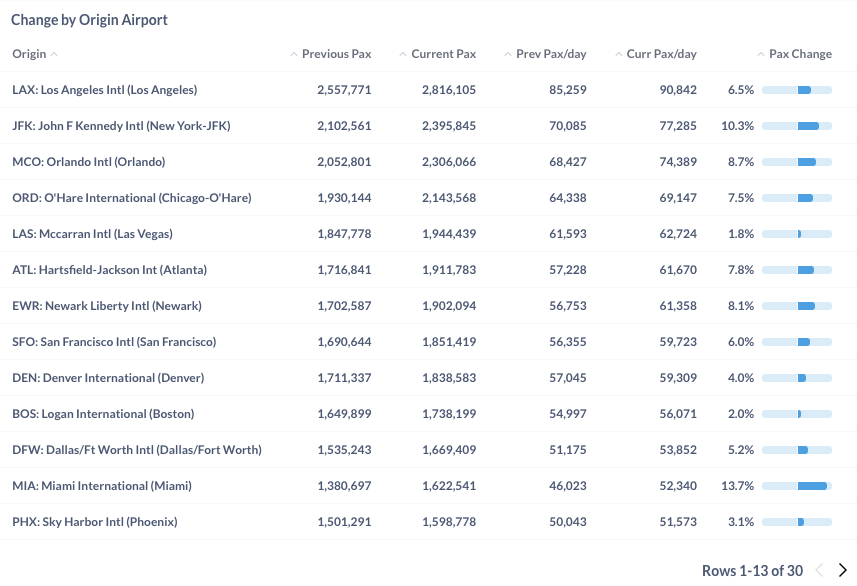
Figure 5: Air Traffic by Top Origin Airports in November 2024 (Previous) vs. December 2024 (Current)
Year Over Year Comparison
Between December 2023 and December 2024, most major U.S. airlines experienced growth, led by Frontier (F9) and Allegiant (G4), with increases of 22.1% and 15.9%, respectively. In contrast, Spirit (NK) reported 9.9% of decrease because of its bankruptcy.
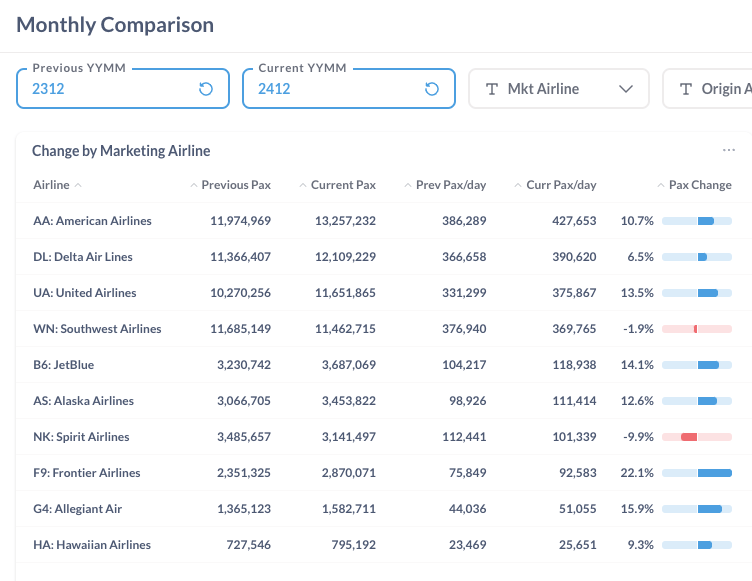
Figure 6: Air Traffic by Dominant Marketing Airlines in December 2024 (Current) vs. December 2023 (Previous)
From December 2023 to December 2024, all major airports saw increased traffic, led by Boston (BOS), Chicago (ORD) and San Francisco (SFO) with year-over-year growth of 19.1%, 16.8% and 16.8%, respectively.
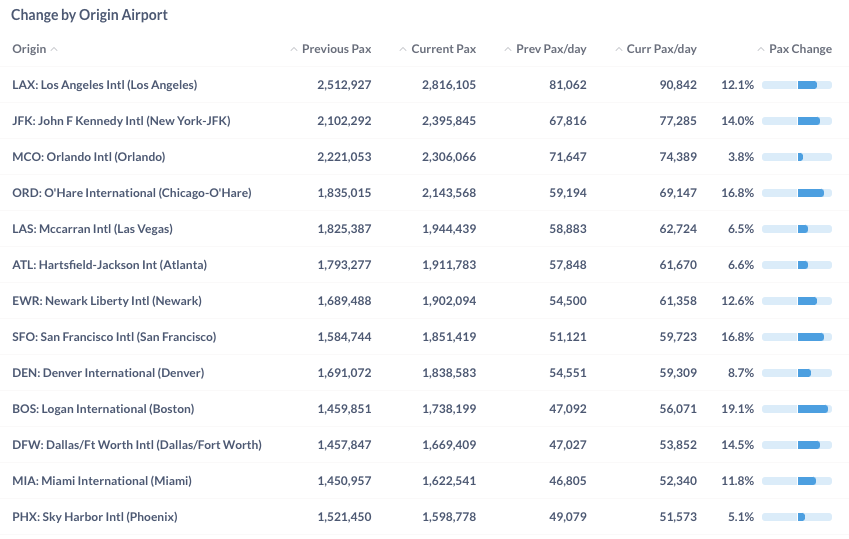
Figure 7: Air Traffic by Top Origin Airport in December 2024 (Current) vs. December 2023 (Previous)
For more detailed information on traffic and fares by route and airline, please contact service@flightbi.com or request a demo of Fligence USOD. They will be able to provide you with customized information to meet your specific needs and requirements.