Overall air traffic was up from September. So was the average airfare. The preliminary true O&D level data released by FlightBI this week shows that US domestic passenger volume increased from September 2022 to October 2022 by 8% while the average airfare also escalated by 2%.
Volume Trend
US domestic traffic by true O&D increased from 46.8 million passengers in September to 50.8 million in October, which is lower than the pre-pandemic level of 51.5 million in October 2019! The US international traffic also grew from 16.0 million in September to 16.3 million in October. The expansion from September to October is a normal seasonality, but part of the contribution this year is because Hurricane Ian postponed some traffic from the end of September to the beginning of October.
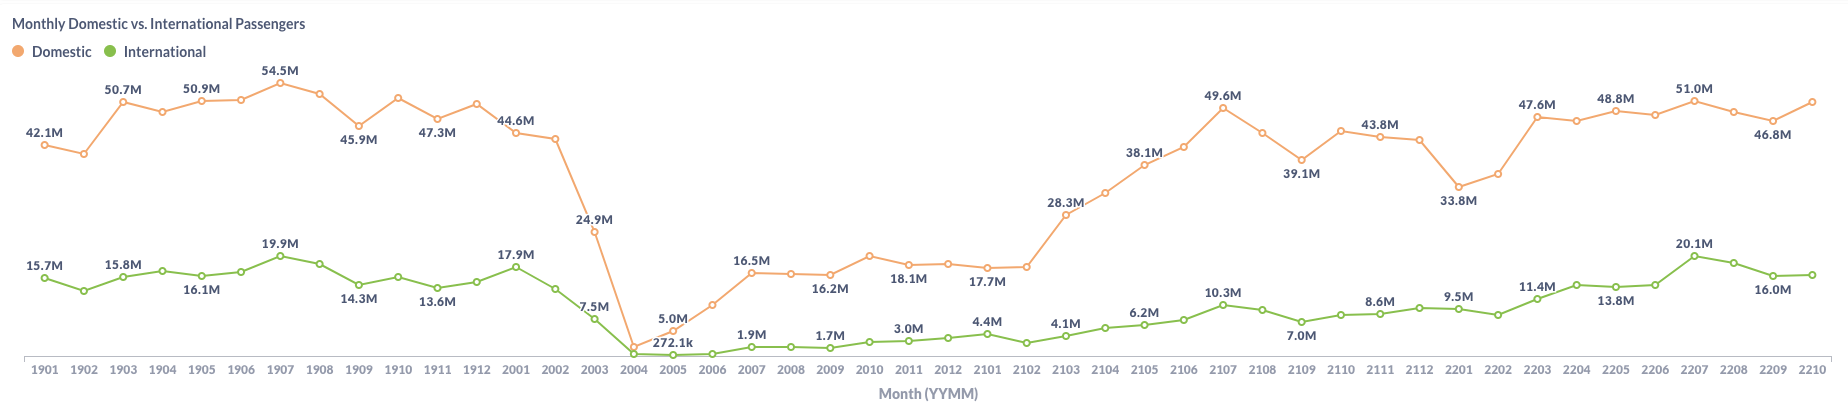
Figure 1: US Domestic and International Air Traffic by Month
Airfare Trend
The average domestic gross fare was up by $5 to $208 in October and the average net fare increased by $4 from $175 to $179.
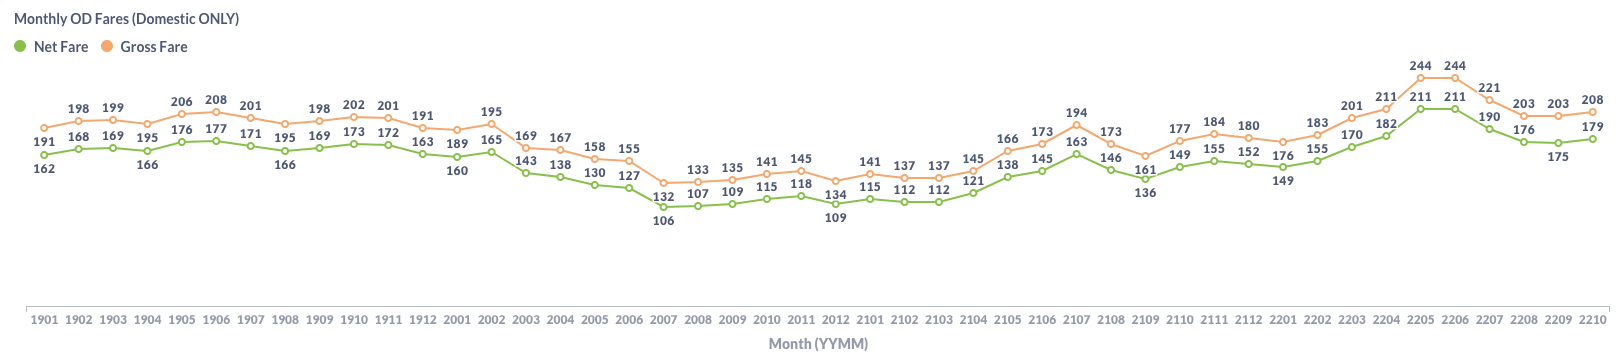
Figure 2: US Domestic Average Airfare by Month
Airfare rose because fuel prices increased again in October. As shown in the chart below provided by EIA, the US jet fuel price rebounded in October. The good news is that fuel prices fell in November and December, which would provide some relief on airfare.
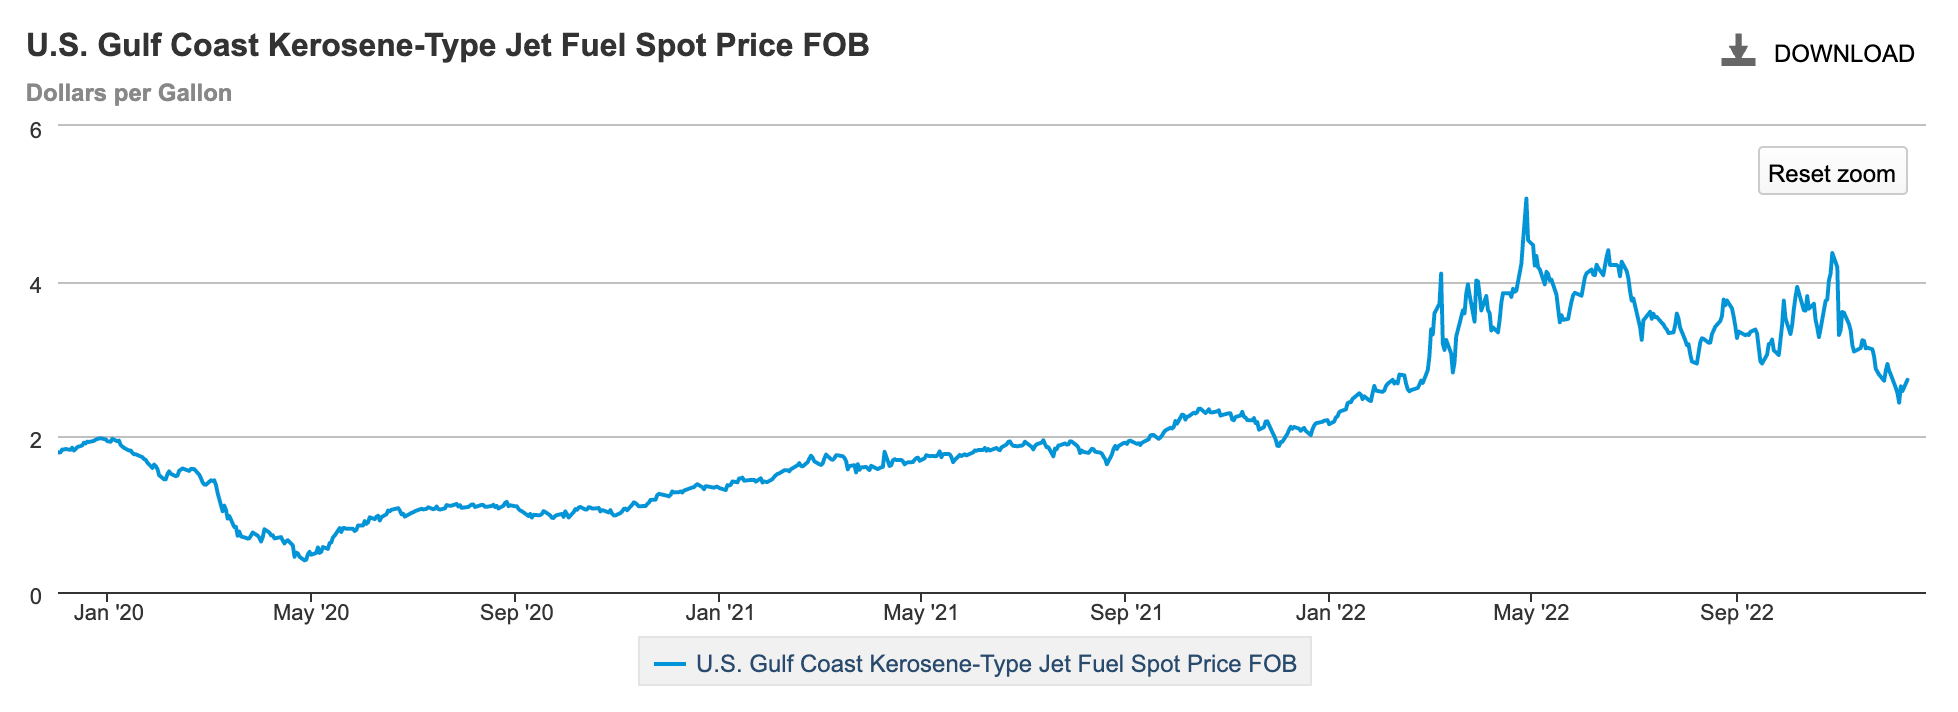
Figure 3: US Jet Fuel Price
Load Factor Trend
The average load factor in October was 81.4%, another improvement from September. As shown in Figure 4 below, both traffic and capacity increased in October, but the traffic grew faster than the capacity.
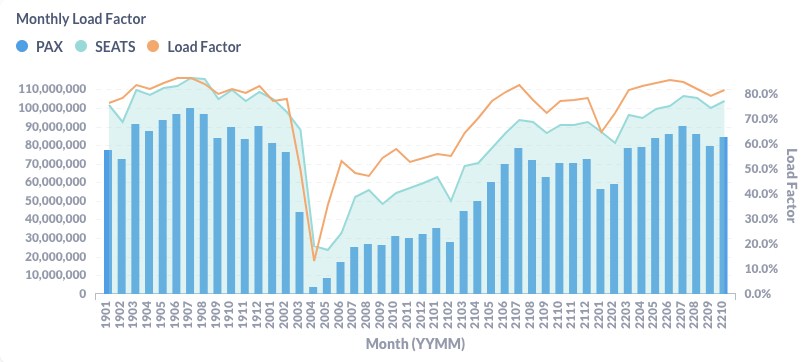
Figure 4: US Airlines’ Average Load Factor by Month
Month Over Month Comparison
From September to October, Allegiant(G4) gained 20.3% of traffic, Spirit(NK) gained 14.6%, and Hawaiin(HA) gained 12.2%. United(UA) and American(AA) also carried 5.1% and 4.3% more passengers per day on average than the last month. Alaska(AS) had a 3.1% loss, and Delta(DL) also carried slightly fewer passengers per day in October.
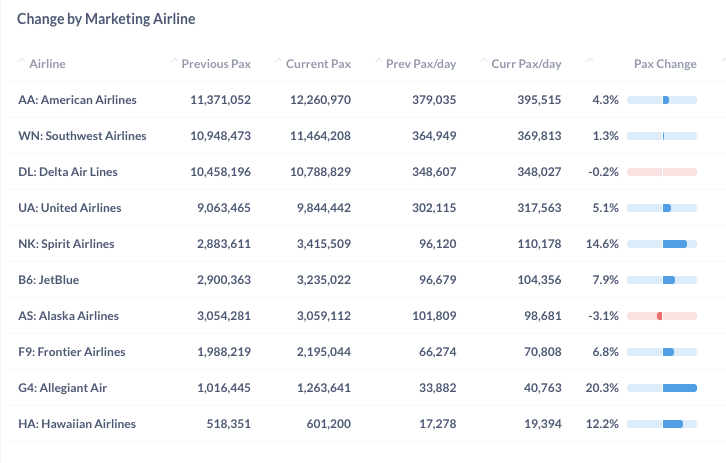
Figure 5: Air Traffic by Dominant Marketing Airlines in October 2022 (Current) vs. September 2022 (Previous)
Most top airports saw more traffic in October than in September. Orlando(MCO) had the largest growth of 12.9% because it was closed during Hurricane Ian in September and some of the traffic was postponed to October. Newark(EWR), Boston(BOS), and Las Vegas(LAS) also gained 10.3%, 8.6%, and 8.1% more traffic, respectively. On the other hand, Seattle(SEA), New York(LGA), and San Francisco(SFO) generated less traffic in October.
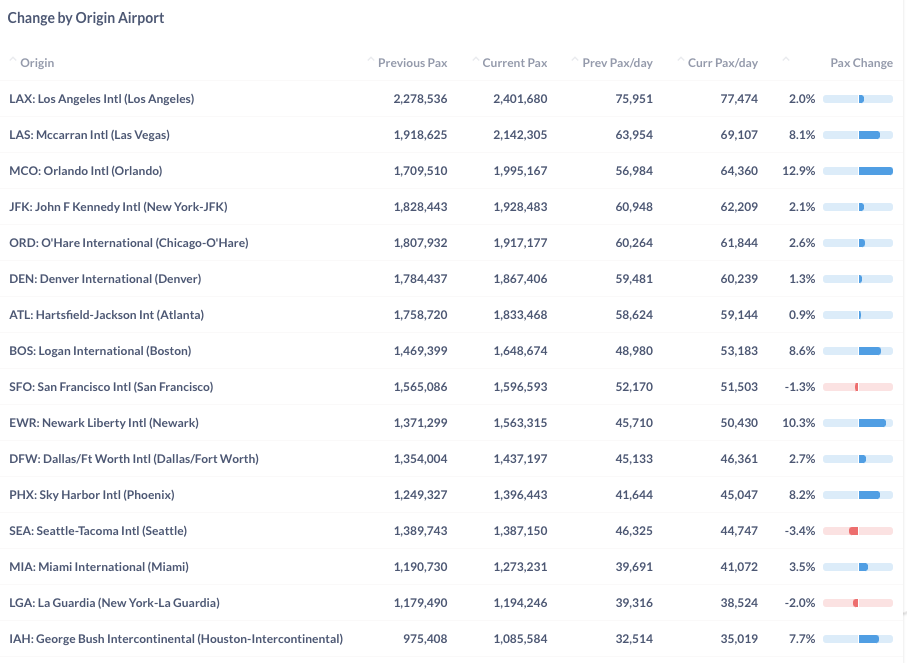
Figure 6: Air Traffic by Top Origin Airports in October 2022 (Current) vs. September 2022 (Previous)
Year Over Year Comparison
Compared to the same month last year, all major US airlines had achieved healthy growth. Spirit(NK), Frontier(F9), and United(UA) led with a year-over-year growth rate of 39.4%, 22.6% and 21.9%, respectively.
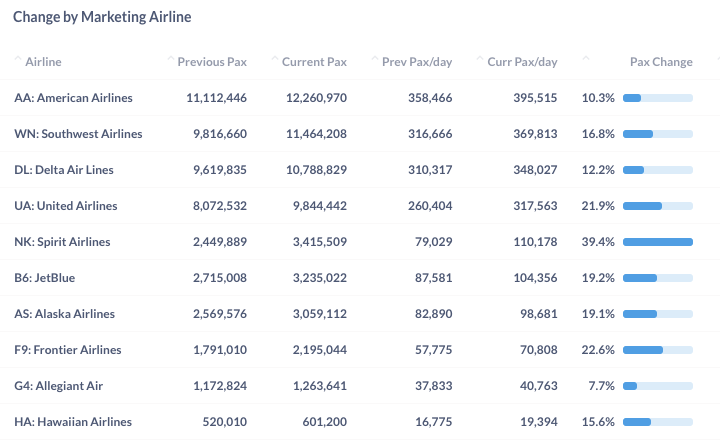
Figure 7: Air Traffic by Dominant Marketing Airlines in October 2022 (Current) vs. October 2021 (Previous)
Growth by top airports is even better. New York’s two airports increased traffic by 59.7% (JFK) and 45.8% (LGA), due to the rebound in international traffic and business trips. San Francisco (SFO) and Boston (BOS) generated 49.2% and 37.9% more passengers than last year. Among the top airports, Phoenix (PHX) has the smallest growth of 8.9% because it has more domestic traffic portion than most other large airports.
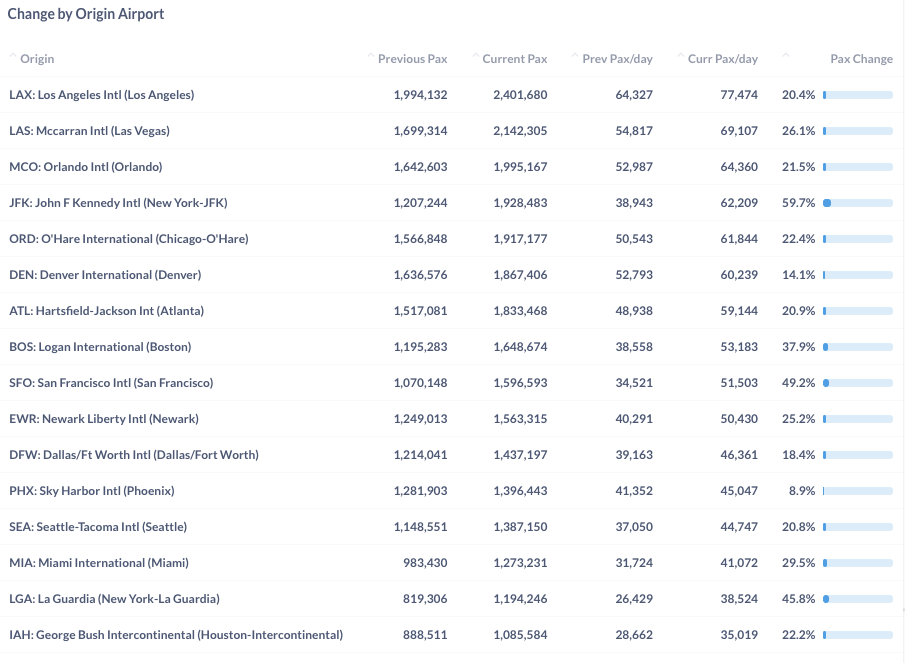
Figure 8: Air Traffic by Top Origin Airport in October 2022 (Current) vs. October 2021 (Previous)
For more granular traffic and fare information by route and airline, please get in touch with service@flightbi.com or request a demo of Fligence USOD.