Daily and hourly airport traffic is crucial for businesses related to airports, including airport authorities, airlines, retailers, ground handlers, rental car companies, and hotels. If you belong to any of these industries, utilizing daily airport traffic data can help you plan your operations, schedule your resources, forecast revenue, and plan budgets more accurately. Additionally, this data can help you target your marketing and promotional efforts more specifically, leading to more effective business strategies.
FlightBI collects and normalizes the airport passenger throughput data from US Transportation Security Administration (TSA). In addition, it has developed a product called Fligence TSA, which features a wide variety of data visualizations. FlightBI is currently offering a two-week, no-obligation trial of Fligence TSA for you to explore valuable insights from the airport traffic data.
This article summarizes US air traffic using the aforementioned tool, utilizing actual airport-level data as of December 13, 2025. Our analysis will examine trends in different segments of air travel, such as domestic versus international flights and leisure versus business travel. To learn more about the specific airports chosen to represent these markets, please refer to this article.
U.S. Airport Traffic Overview
As shown in Figure 1, U.S. airport traffic declined from its early-October 2025 peak of approximately 2.7 million passengers per day, falling through the end of November ahead of the Thanksgiving holiday. Thanksgiving travel produced another single-day record, although the 7-day moving average closely mirrored last year’s levels. Current forecasts suggest that passenger volumes will remain between 2023 and 2024 levels for the remainder of the year and are expected to align with the 2025 benchmark as we enter the new year.
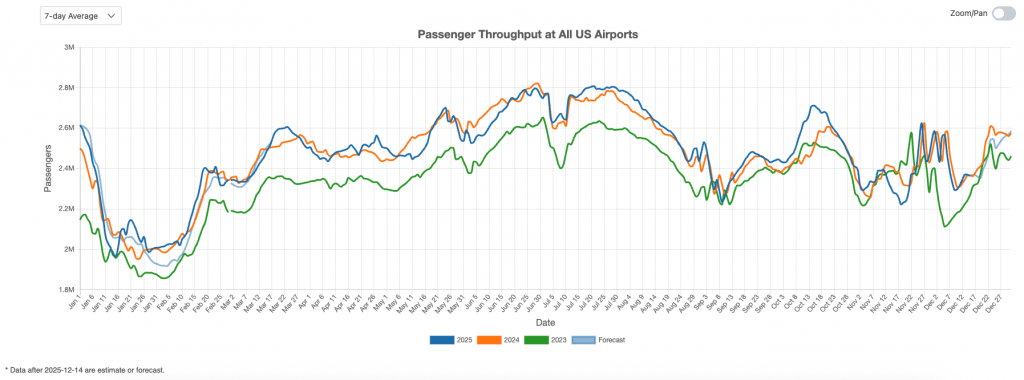
Figure 1: US Overall Air Traffic Trend
Domestic Airport Traffic Indicator
Figure 2 highlights recent travel trends at major domestic hubs, including Charlotte (CLT), Denver (DEN), and Phoenix (PHX). Passenger throughput at these airports has been slightly below last year’s levels. However, forecasts for the coming months indicate the potential for a year-end surge in demand.
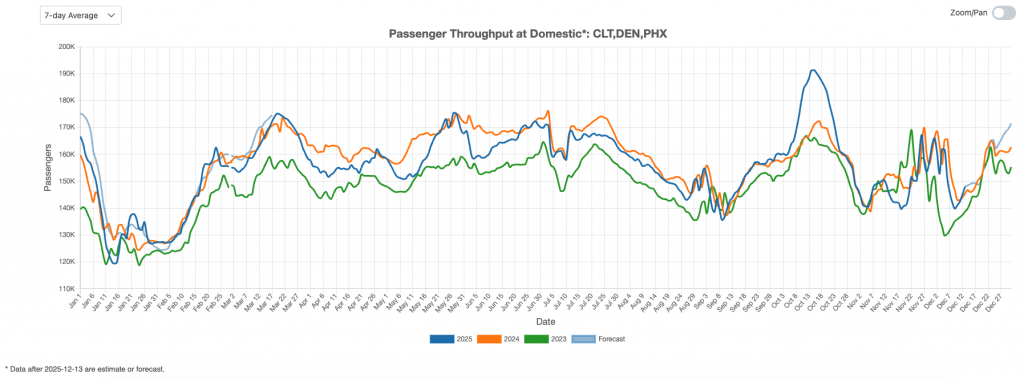
Figure 2: US Domestic Air Traffic Indicator
International Airport Traffic Indicator
Figure 3 illustrates passenger volume trends at New York’s JFK Airport, a major international gateway. International traffic softened in October before rebounding in November. The near-term outlook suggests passenger volumes will exceed levels from the past two years over the next two months.
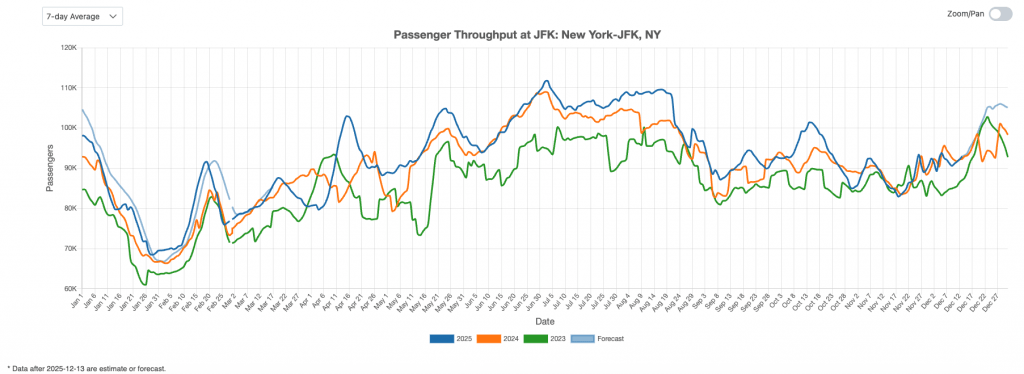
Figure 3: US International Air Traffic Indicator
Leisure Air Traffic Indicator
Figure 4 provides an overview of U.S. leisure air travel trends. Throughout most of November 2025, passenger volumes at leisure-focused airports—such as Las Vegas (LAS) and Orlando (MCO)—remained in line with 2024 levels. However, a strong rebound in early December is evident, and forecasts suggest this momentum will continue in the months ahead, with a seasonal peak expected shortly after New Year’s Day.
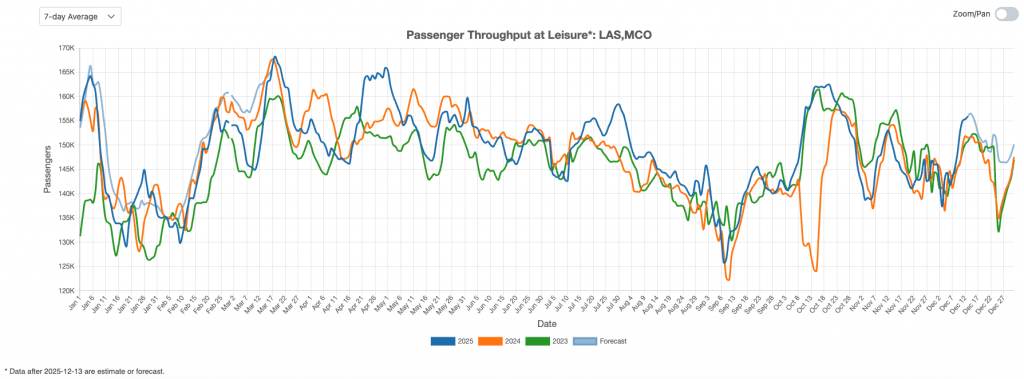
Figure 4: US Leisure Air Traffic Indicator
Business Air Traffic Indicator
Figure 5 shows that business travel has remained relatively stable. On most days, passenger volumes exceeded levels observed during the same period in 2024. Projections indicate that business travel will follow similar seasonal patterns as last year, with healthy year-over-year growth expected as we enter the new year.
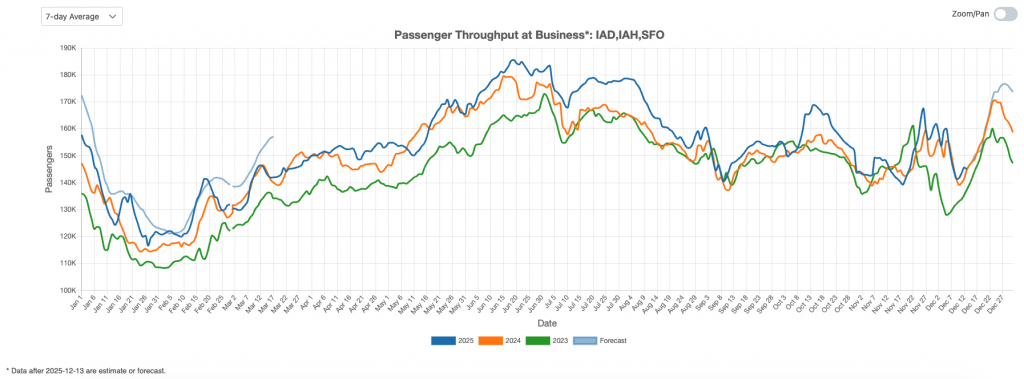
Figure 5: US Business Air Traffic Indicator
To summarize, U.S. air travel softened in October and November before rebounding around Thanksgiving and early December. Domestic hubs lagged slightly year over year, while international, leisure, and business travel showed renewed momentum. Forecasts point to continued recovery and healthy growth into the new year.