Daily and hourly airport traffic is crucial for businesses related to airports, including airport authorities, airlines, retailers, ground handlers, rental car companies, and hotels. If you belong to any of these industries, utilizing daily airport traffic data can help you plan your operations, schedule your resources, forecast revenue, and plan budgets more accurately. Additionally, this data can help you target your marketing and promotional efforts more specifically, leading to more effective business strategies.
FlightBI collects and normalizes the airport passenger throughput data from US Transportation Security Administration (TSA). In addition, it has developed a product called Fligence TSA, which features a wide variety of data visualizations. FlightBI is currently offering a two-week, no-obligation trial of Fligence TSA for you to explore valuable insights from the airport traffic data.
This article summarizes US air traffic using the aforementioned tool, utilizing actual airport-level data as of May 31st, 2025. Our analysis will examine trends in different segments of air travel, such as domestic versus international flights and leisure versus business travel. To learn more about the specific airports chosen to represent these markets, please refer to this article.
U.S. Airport Traffic Overview
Following strong growth in March, U.S. airport traffic dipped below 2024 levels in early May 2025 but rebounded in the second half of the month, as illustrated in Figure 1. Forecasts indicate a summer peak between 2023 and 2024 levels, with daily passenger volumes expected to surpass 2.75 million by late June and again in late July.
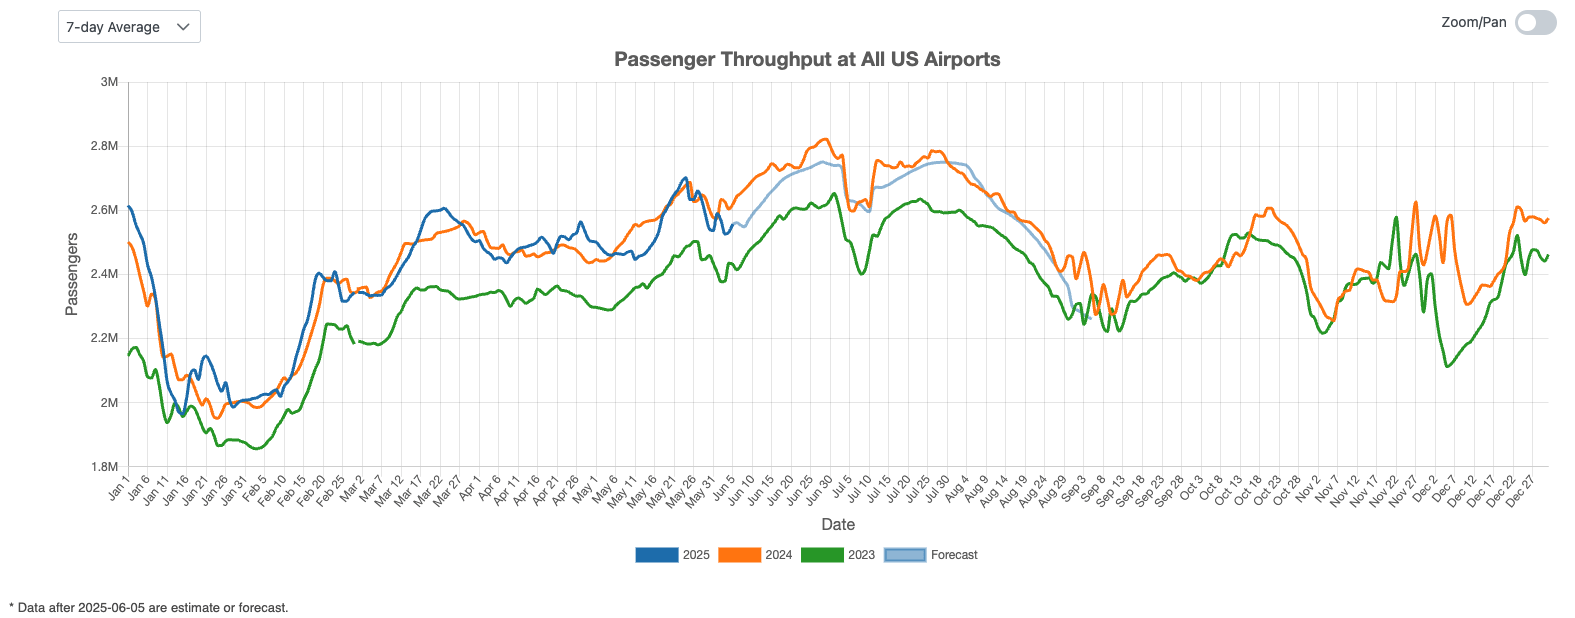
Figure 1: US Overall Air Traffic Trend
Domestic Airport Traffic Indicator
Figure 2 highlights domestic travel trends at major airports, including Charlotte (CLT), Denver (DEN), and Phoenix (PHX). After a lull following the spring break season, U.S. domestic air traffic rebounded by the end of May, reaching 2024 levels. However, total May volumes still fell short of last year’s. Continued growth is expected to narrow the gap and bring traffic in line with 2024 levels in the coming months.
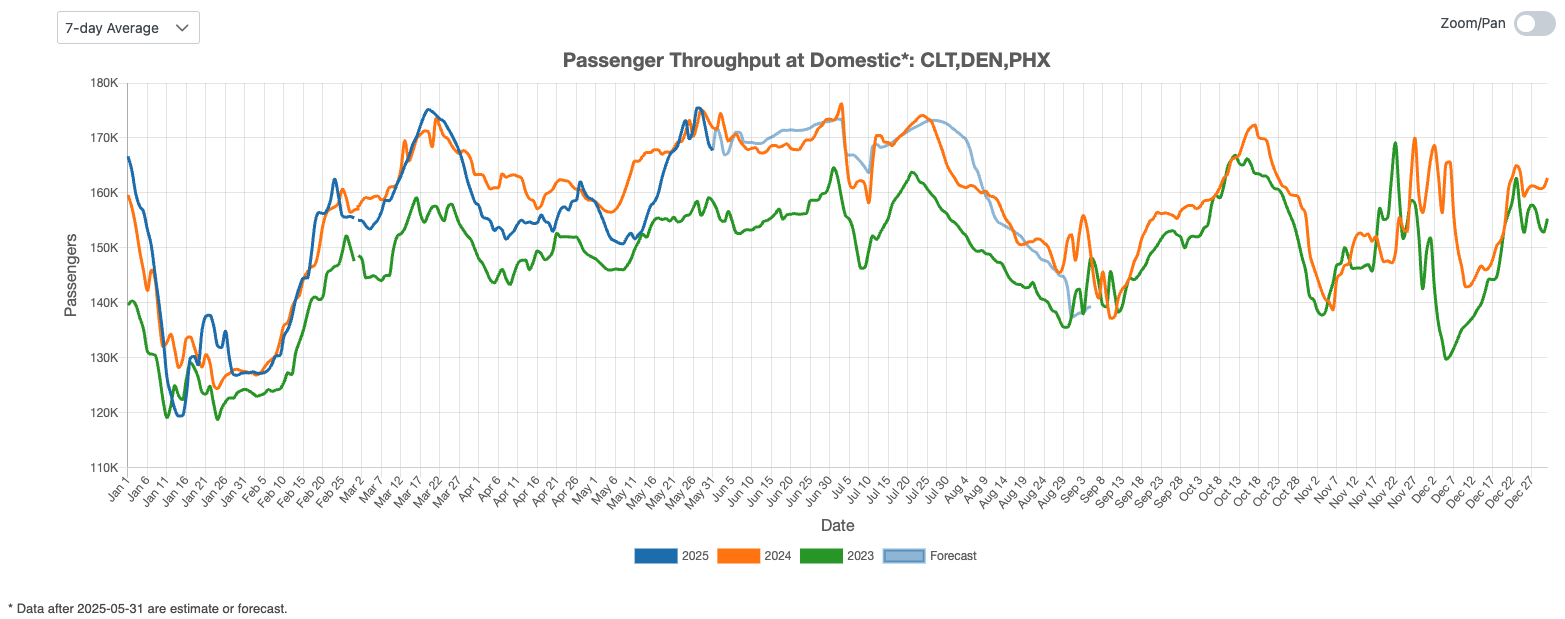
Figure 2: US Domestic Air Traffic Indicator
International Airport Traffic Indicator
Figure 3 shows fluctuations in passenger volumes at New York’s JFK Airport, a major hub for international travel. In May, international traffic peaked again, with 2025 volumes surpassing those of 2024. The outlook remains positive, with projections pointing to steady growth throughout the summer.
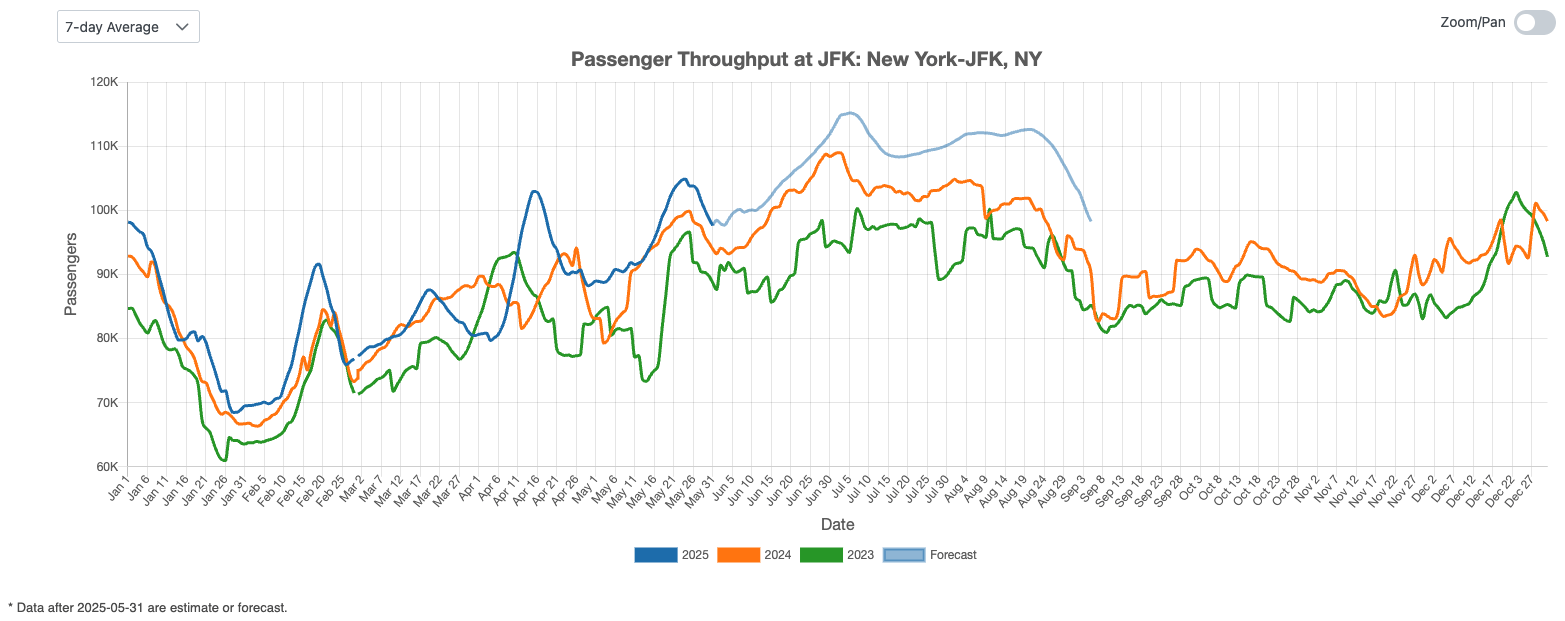
Figure 3: US International Air Traffic Indicator
Leisure Air Traffic Indicator
Figure 4 provides an overview of the U.S. leisure air travel market. In May 2025, passenger volumes at primarily leisure-focused airports—such as Las Vegas (LAS) and Orlando (MCO)—returned to typical levels following a strong surge at the end of April. Forecasts suggest that 2025 is on track to match volumes seen over the past two years.
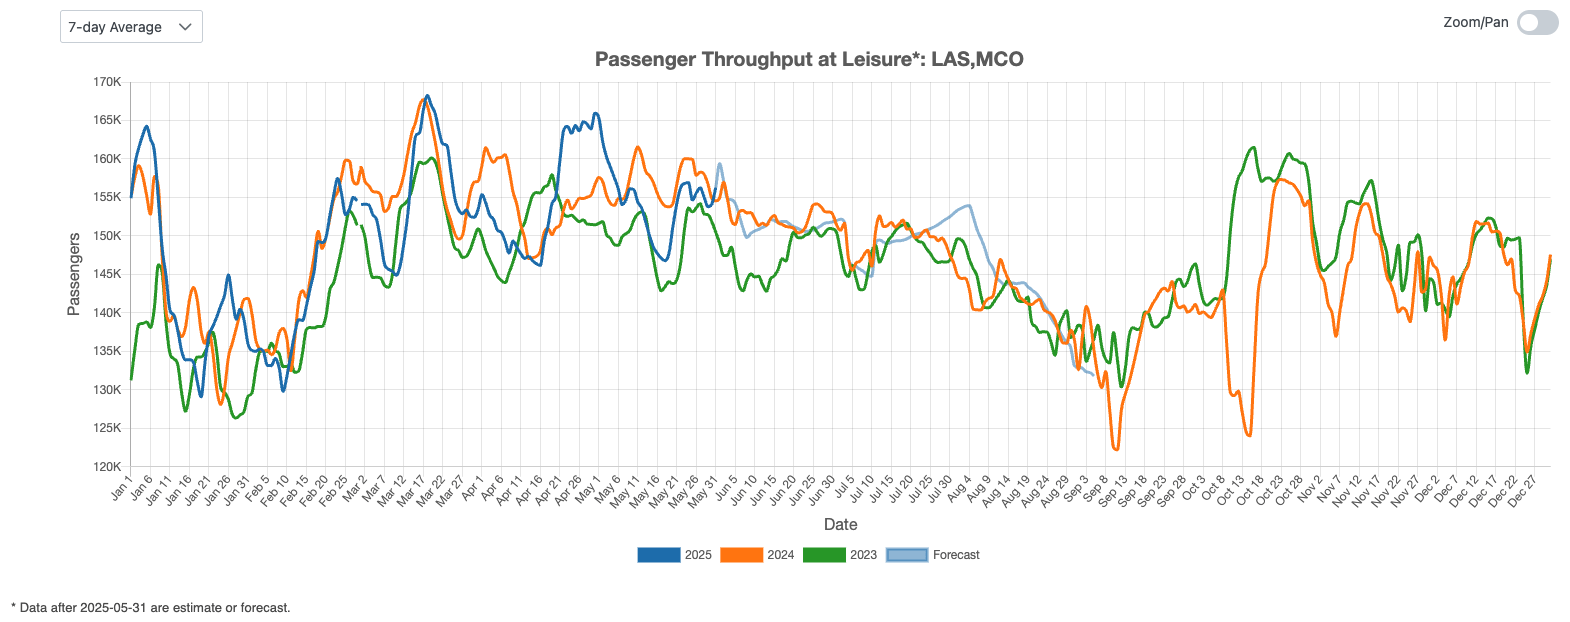
Figure 4: US Leisure Air Traffic Indicator
Business Air Traffic Indicator
Figure 5 highlights the upward trend in business travel, with May 2025 passenger volumes matching those of the same period in 2024. Projections indicate continued growth in the months ahead.
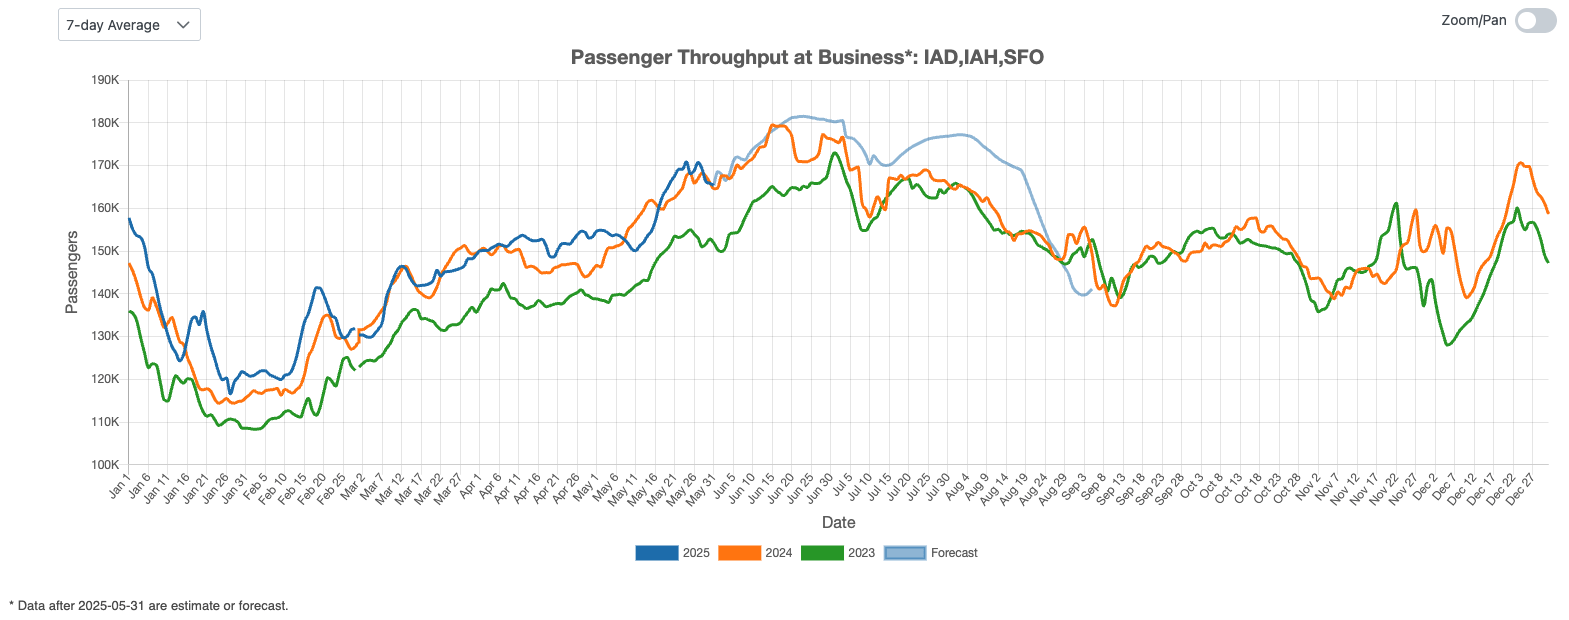
Figure 5: US Business Air Traffic Indicator
U.S. air travel rebounded in late May 2025, with domestic and business travel nearing 2024 levels and international traffic surpassing last year’s at JFK. Leisure travel normalized after April peaks, while forecasts point to continued summer growth across segments, putting 2025 on track to match recent years.