Daily and hourly airport traffic is crucial for businesses related to airports, including airport authorities, airlines, retailers, ground handlers, rental car companies, and hotels. If you belong to any of these industries, utilizing daily airport traffic data can help you plan your operations, schedule your resources, forecast revenue, and plan budgets more accurately. Additionally, this data can help you target your marketing and promotional efforts more specifically, leading to more effective business strategies.
FlightBI collects and normalizes the airport passenger throughput data from US Transportation Security Administration (TSA). In addition, it has developed a product called Fligence TSA, which features a wide variety of data visualizations. FlightBI is currently offering a two-week, no-obligation trial of Fligence TSA for you to explore valuable insights from the airport traffic data.
This article summarizes US air traffic using the aforementioned tool, utilizing actual airport-level data as of Jun 1, 2024. Our analysis will examine trends in different segments of air travel, such as domestic versus international flights and leisure versus business travel. To learn more about the specific airports chosen to represent these markets, please refer to this article.
US Overall Airport Traffic Status
In 2024, the US airport traffic exhibited a strong growth trajectory, with daily passenger numbers consistently exceeding previous years’ figures by 5-9% throughout May, as illustrated in Figure 1. Starting from mid-February 2024, air traffic in the US surged to its highest levels in five years. Moreover, forecasts project this growth momentum to persist into the next quarter.
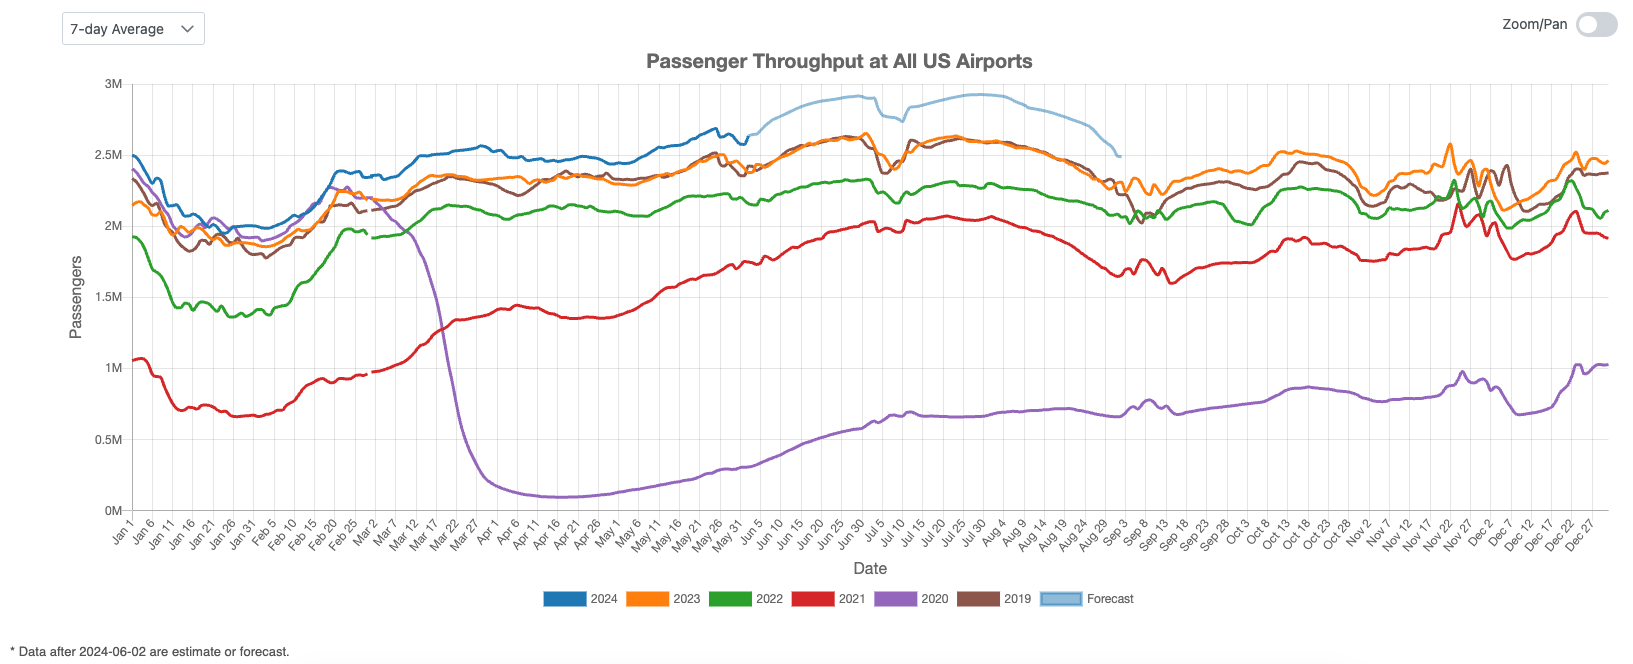
Figure 1: US Overall Air Traffic Trend
Domestic Airport Traffic Indicator
Figure 2 depicts a rise in U.S. domestic air travel during May, rebounding from a slight decline in April. With an expansion in scheduled capacity, we expect domestic air traffic to surpass previous years’ levels during the upcoming summer season.
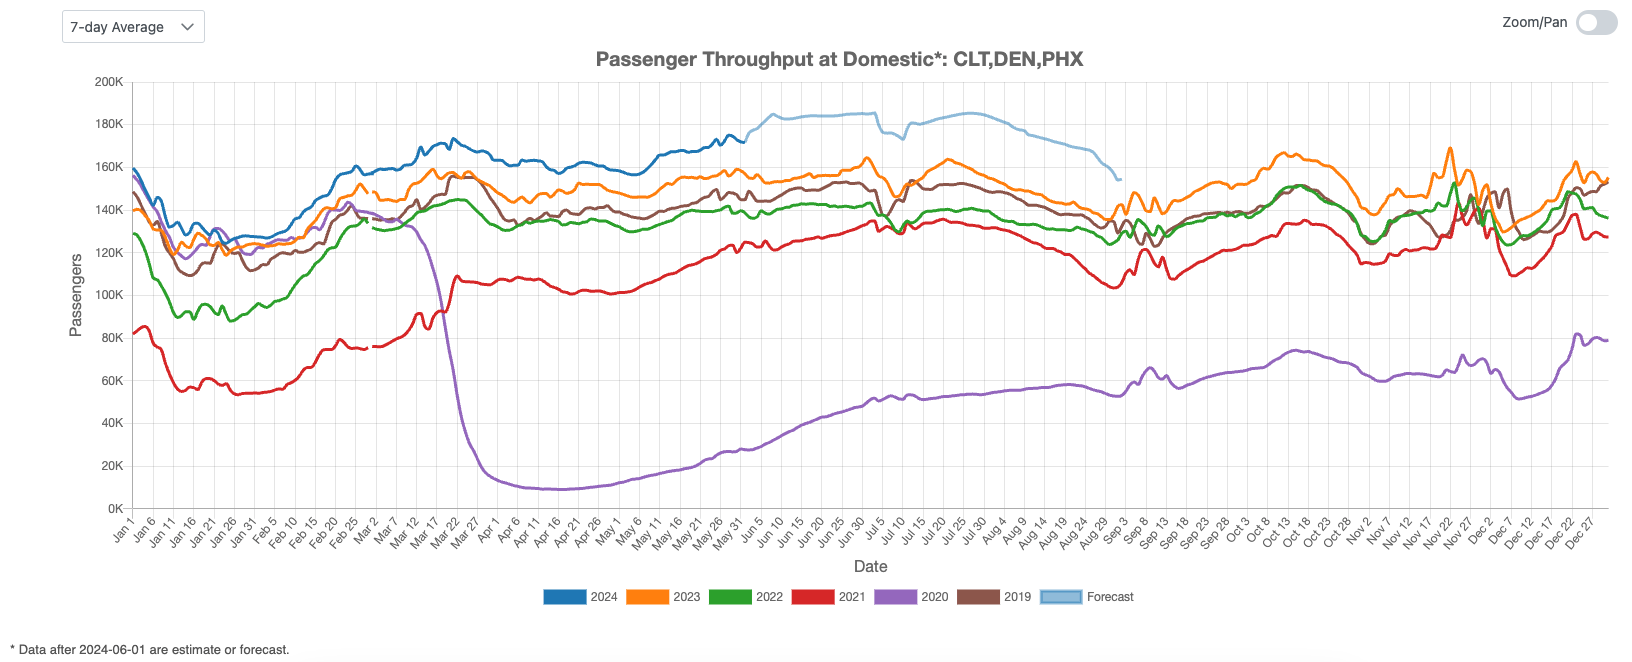
Figure 2: US Domestic Air Traffic Indicator
International Airport Traffic Indicator
Figure 3 presents the U.S. international air traffic index for May 2024, indicating fluctuations around the 2019 level throughout that month. International traffic has now reached pre-COVID levels. Moreover, projections suggest that U.S. international air traffic will surpass the 2019 levels in the next three months.
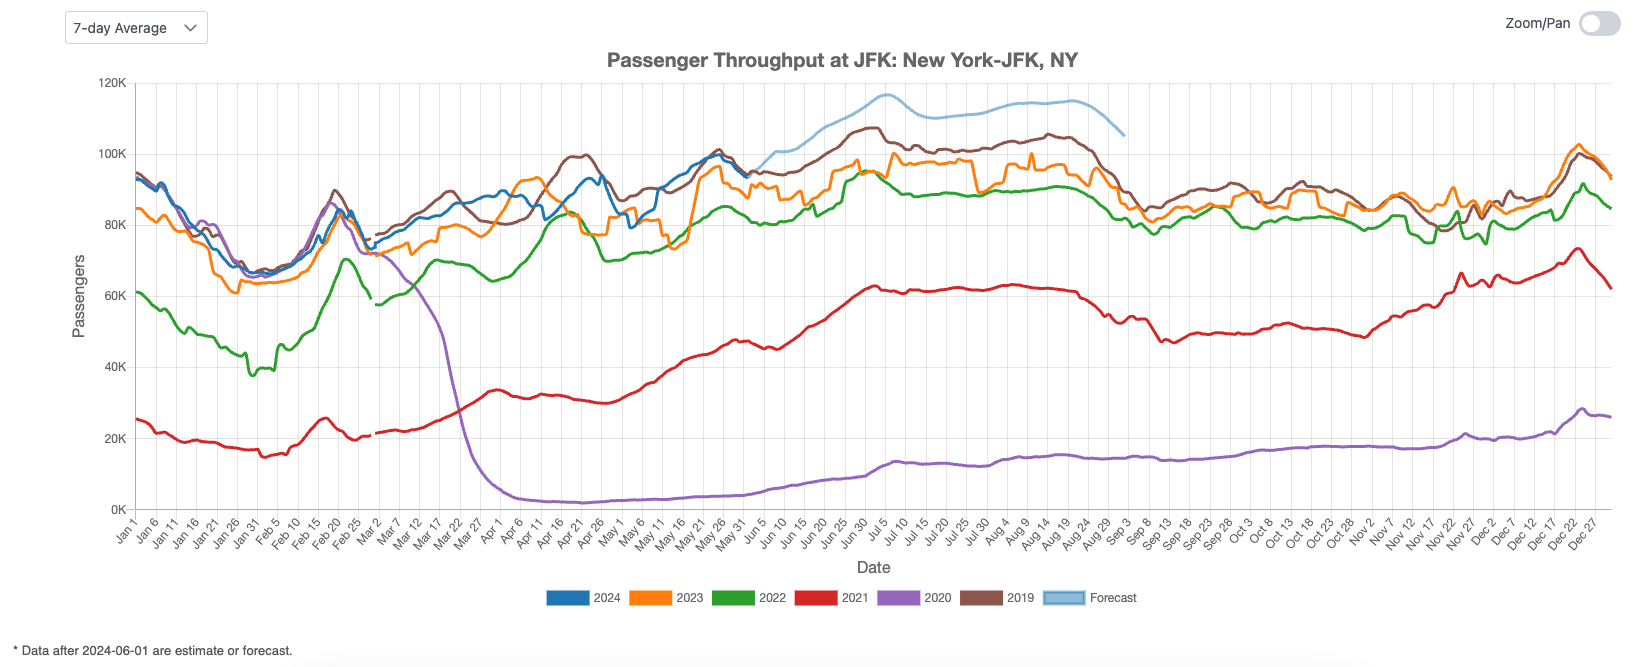
Figure 3: US International Air Traffic Indicator
Leisure Air Traffic Indicator
Figure 4 highlights the present condition of the U.S. leisure air travel market. In May 2024, the traffic curve once again exceeded last year’s levels. Forecasts indicate a continued growth in traffic levels throughout the summer.
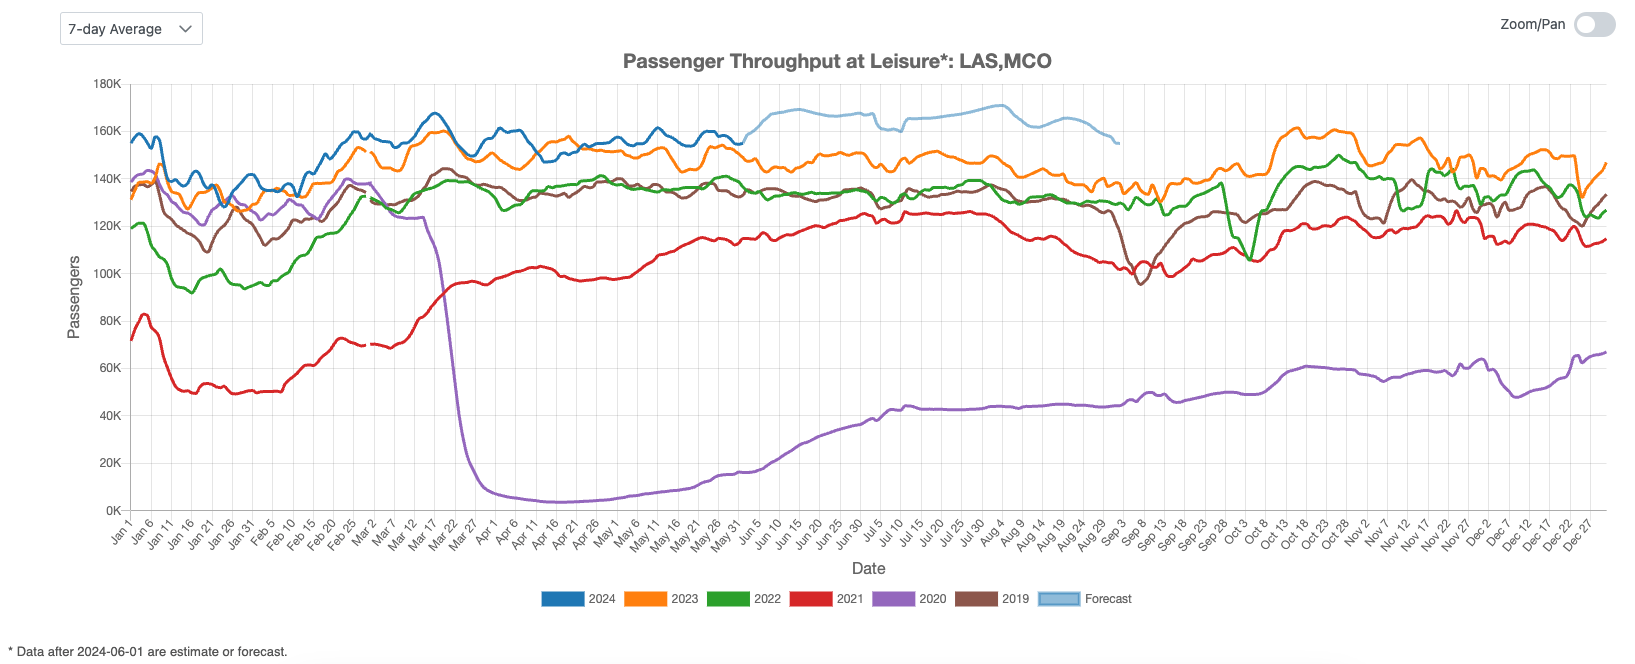
Figure 4: US Leisure Air Traffic Indicator
Business Air Traffic Indicator
Figure 5 illustrates the resurgence of business travel in May 2024, suggesting the potential for sustained growth. Projections indicate that within the next three months, business travel will reach levels unseen in recent years, although the momentum may wane after the summer period.
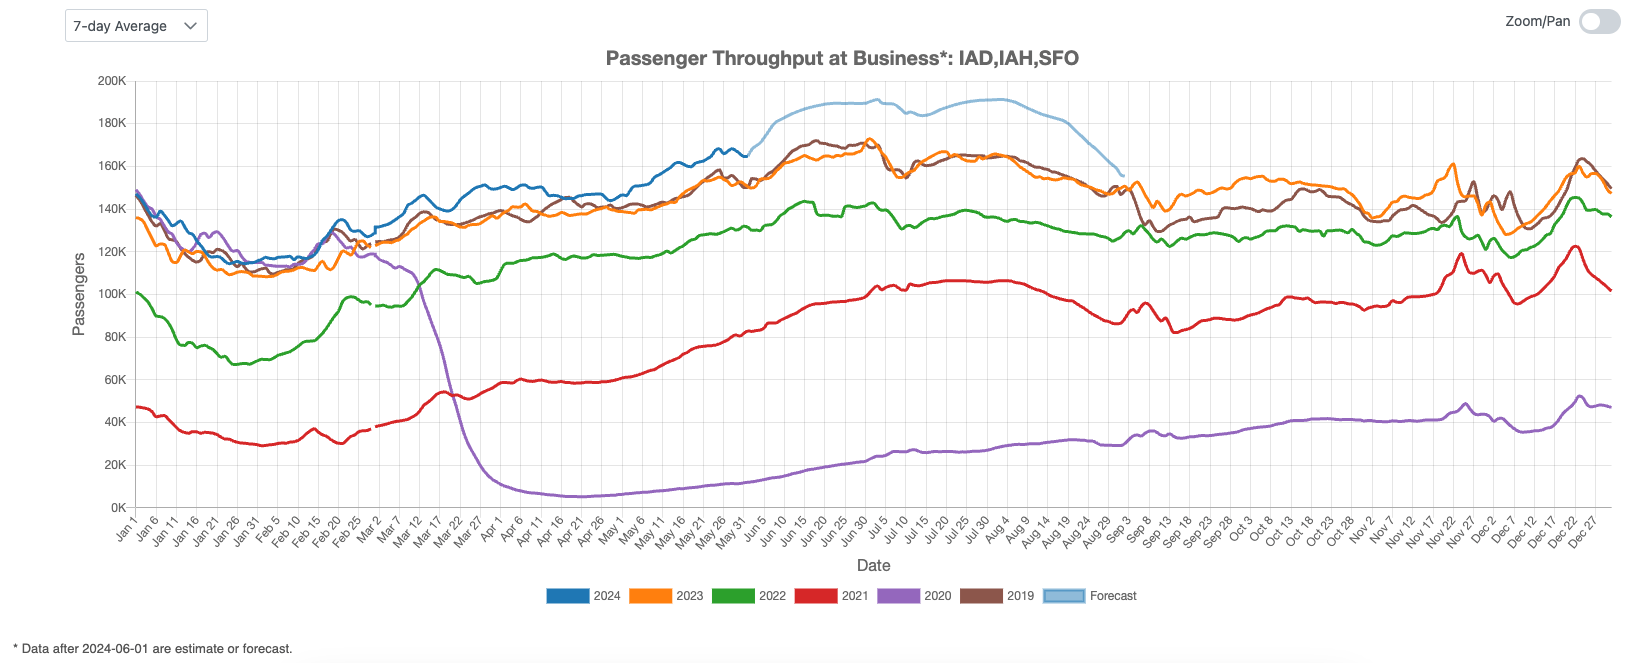
Figure 5: US Business Air Traffic Indicator
In 2024, US air traffic experienced a notable growth, with daily passenger numbers consistently surpassing previous years’ figures by 5-9% in May. Domestic air travel showed a positive trend, expected to outpace previous summer levels due to increased capacity. International air traffic reached pre-COVID levels, with projections indicating a further increase in the coming months. The leisure air travel market saw growth, while business travel strengthened significantly, poised for continued expansion, albeit potentially slowing after summer.