Daily and hourly airport traffic is crucial for businesses related to airports, including airport authorities, airlines, retailers, ground handlers, rental car companies, and hotels. If you belong to any of these industries, utilizing daily airport traffic data can help you plan your operations, schedule your resources, forecast revenue, and plan budgets more accurately. Additionally, this data can help you target your marketing and promotional efforts more specifically, leading to more effective business strategies.
FlightBI collects and normalizes the airport passenger throughput data from US Transportation Security Administration (TSA). In addition, it has developed a product called Fligence TSA, which features a wide variety of data visualizations. FlightBI is currently offering a two-week, no-obligation trial of Fligence TSA for you to explore valuable insights from the airport traffic data.
This article summarizes US air traffic using the aforementioned tool, utilizing actual airport-level data as of August 2, 2025. Our analysis will examine trends in different segments of air travel, such as domestic versus international flights and leisure versus business travel. To learn more about the specific airports chosen to represent these markets, please refer to this article.
U.S. Airport Traffic Overview
As shown in Figure 1, U.S. airport traffic remained strong in July 2025, averaging 2.8 million travelers per day following the July 4th holiday. However, forecasts indicate a sharp decline in August, with volumes potentially dropping below 2023 and 2024 levels.
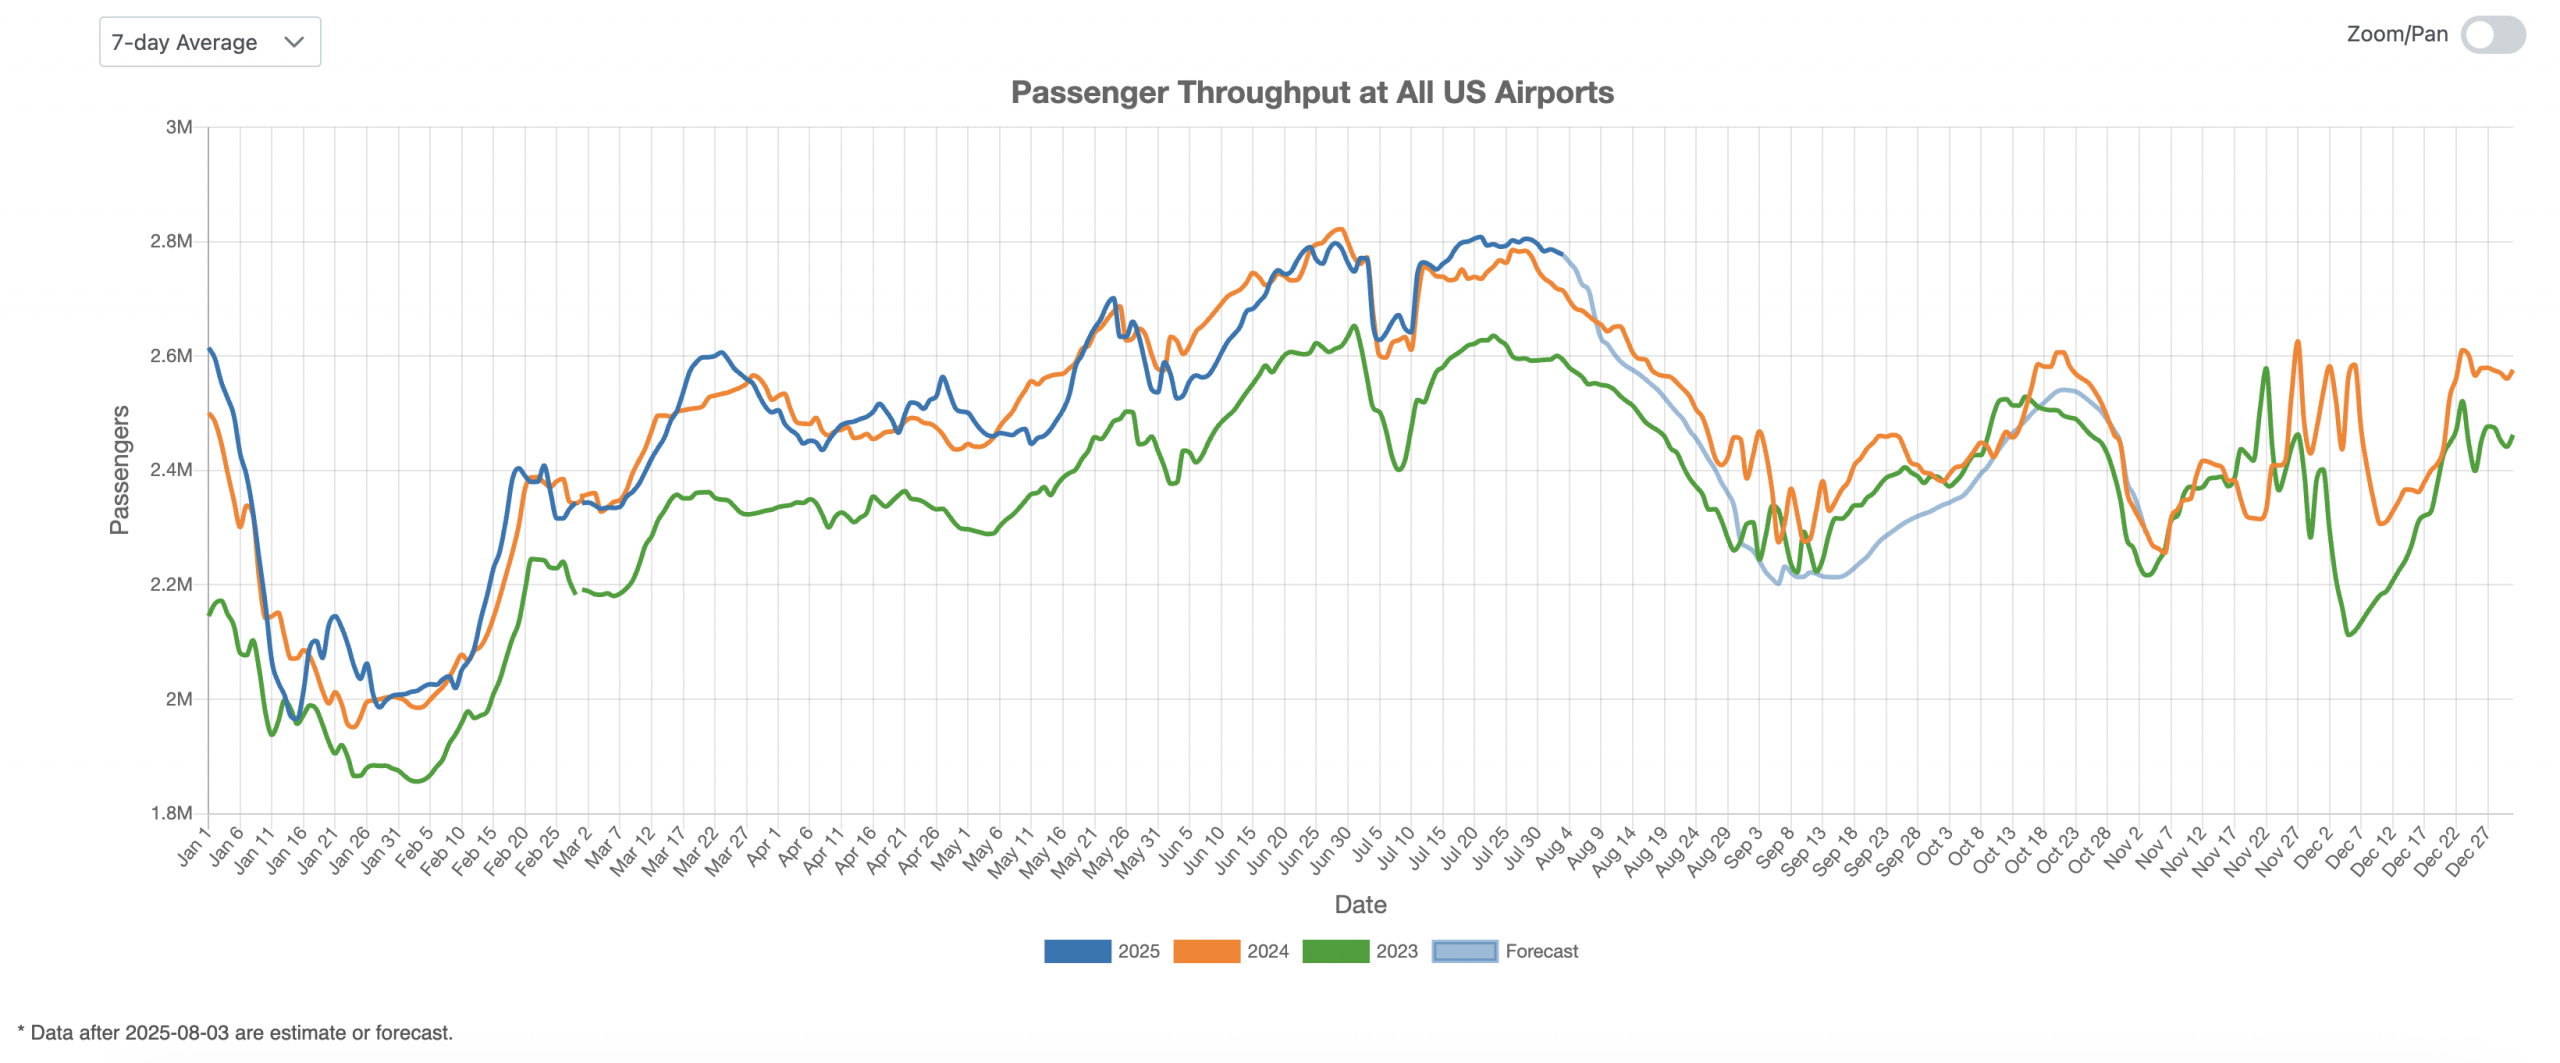
Figure 1: US Overall Air Traffic Trend
Domestic Airport Traffic Indicator
Figure 2 highlights travel trends at major domestic airports, including Charlotte (CLT), Denver (DEN), and Phoenix (PHX). Passenger throughput at these airports declined after the July 4th holiday and continued to drop toward the end of the month. Forecasts for the coming months fall below 2024 levels.
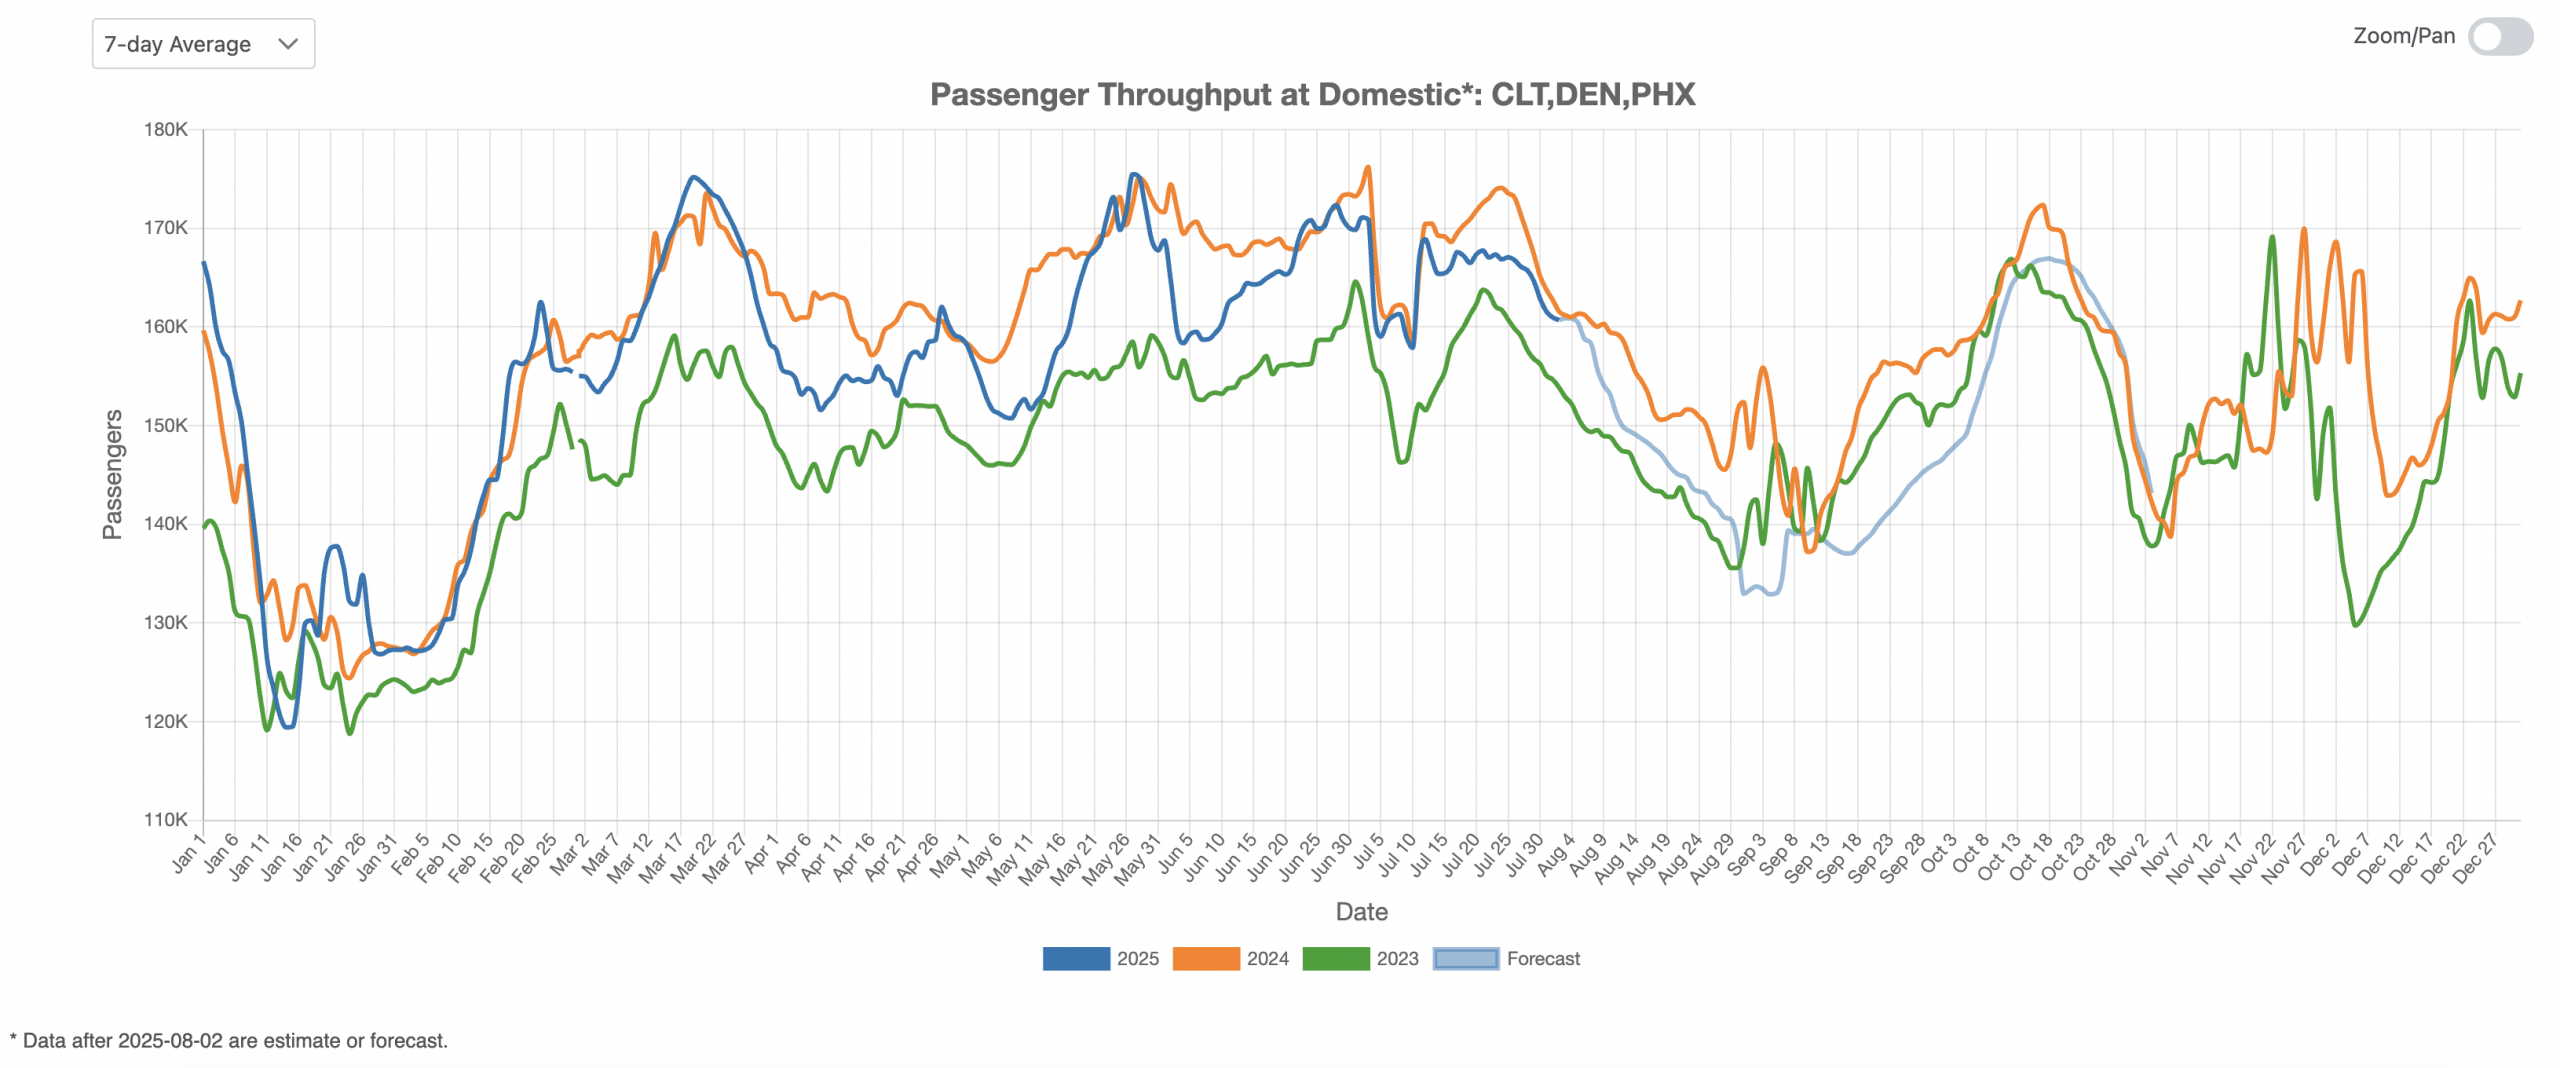
Figure 2: US Domestic Air Traffic Indicator
International Airport Traffic Indicator
Figure 3 illustrates fluctuations in passenger volumes at New York’s JFK Airport, a major international hub. International traffic peaked at the end of June and remained relatively high throughout July, exceeding 2024 levels. The outlook for August remains positive, although seasonal trends are expected to drive traffic down in September.
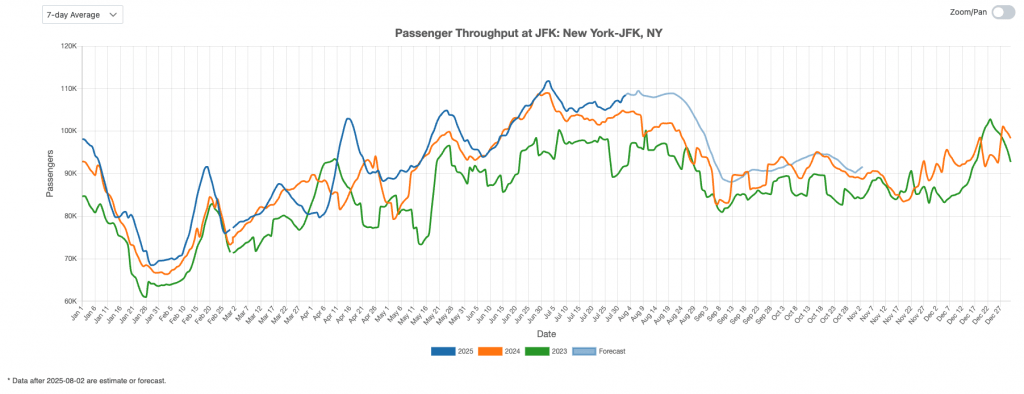
Figure 3: US International Air Traffic Indicator
Leisure Air Traffic Indicator
Figure 4 provides an overview of the U.S. leisure air travel market. Throughout most of July 2025, passenger volumes at primarily leisure-focused airports—such as Las Vegas (LAS) and Orlando (MCO)—remained above 2024 levels. Forecasts suggest this trend may continue into August, with a potential decline beginning in September.
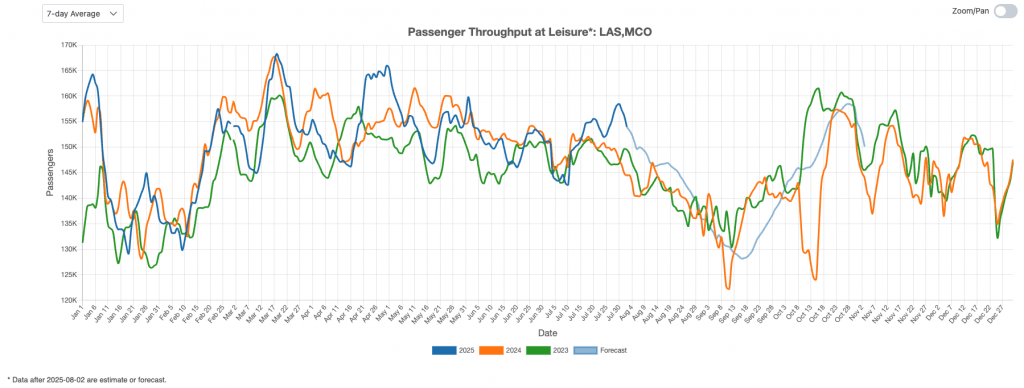
Figure 4: US Leisure Air Traffic Indicator
Business Air Traffic Indicator
Figure 5 highlights a strong trend in business travel, with July 2025 passenger volumes exceeding those of the same period in 2024, despite a brief dip following the July 4th holiday. Projections indicate continued strength through early August, followed by a decline in the latter half of the month to levels comparable to 2024.
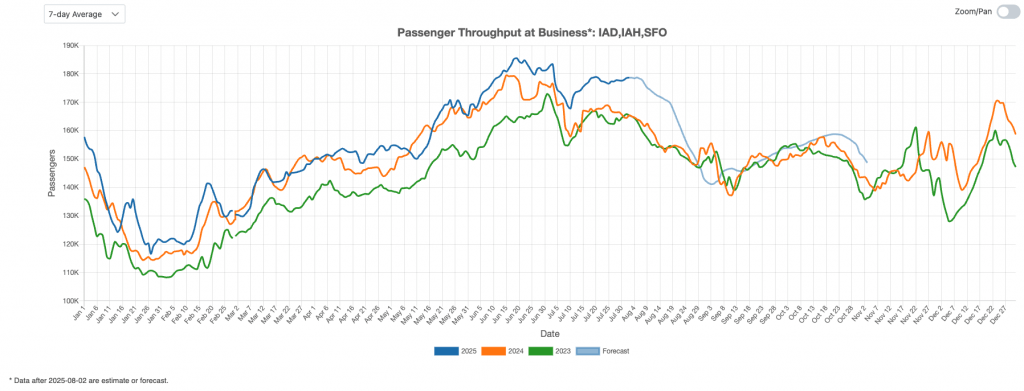
Figure 5: US Business Air Traffic Indicator
U.S. air travel remained strong in July 2025, with leisure and business volumes exceeding 2024 levels. Major hubs saw post–July 4th declines, while international traffic at JFK stayed elevated. Forecasts show continued strength into August, with seasonal drops expected in September and late August for business travel.