Daily and hourly airport traffic is crucial for businesses related to airports, including airport authorities, airlines, retailers, ground handlers, rental car companies, and hotels. If you belong to any of these industries, utilizing daily airport traffic data can help you plan your operations, schedule your resources, forecast revenue, and plan budgets more accurately. Additionally, this data can help you target your marketing and promotional efforts more specifically, leading to more effective business strategies.
FlightBI collects and normalizes the airport passenger throughput data from US Transportation Security Administration (TSA). In addition, it has developed a product called Fligence TSA, which features a wide variety of data visualizations. FlightBI is currently offering a two-week, no-obligation trial of Fligence TSA for you to explore valuable insights from the airport traffic data.
This article summarizes US air traffic using the aforementioned tool, utilizing actual airport-level data as of Aug 3, 2024. Our analysis will examine trends in different segments of air travel, such as domestic versus international flights and leisure versus business travel. To learn more about the specific airports chosen to represent these markets, please refer to this article.
US Overall Airport Traffic Status
In 2024, U.S. airport traffic demonstrated robust growth, with daily passenger numbers in July consistently surpassing previous years’ figures by 5-10%, as illustrated in Figure 1. Beginning in mid-February 2024, U.S. air traffic surged to its highest levels in five years. However, our forecasts suggest that this growth momentum may decline after the summer.
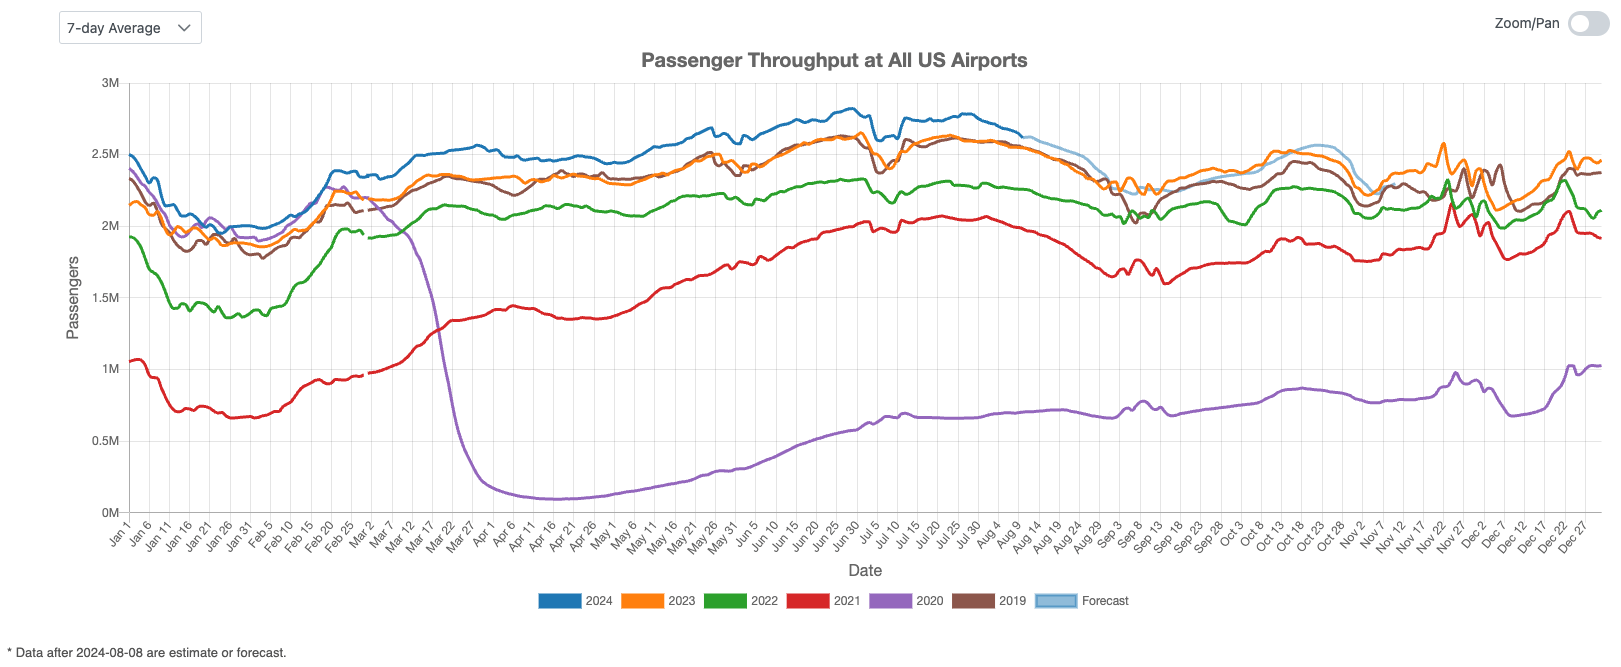
Figure 1: US Overall Air Traffic Trend
Domestic Airport Traffic Indicator
Figure 2 illustrates a steady increase in U.S. domestic air travel throughout July. After a brief slowdown following the July 4th holiday, traffic rebounded, reaching a peak by the end of the month. Forecasts project that domestic air traffic will exceed last year’s levels by approximately 8% in August before aligning with 2023 levels in September.
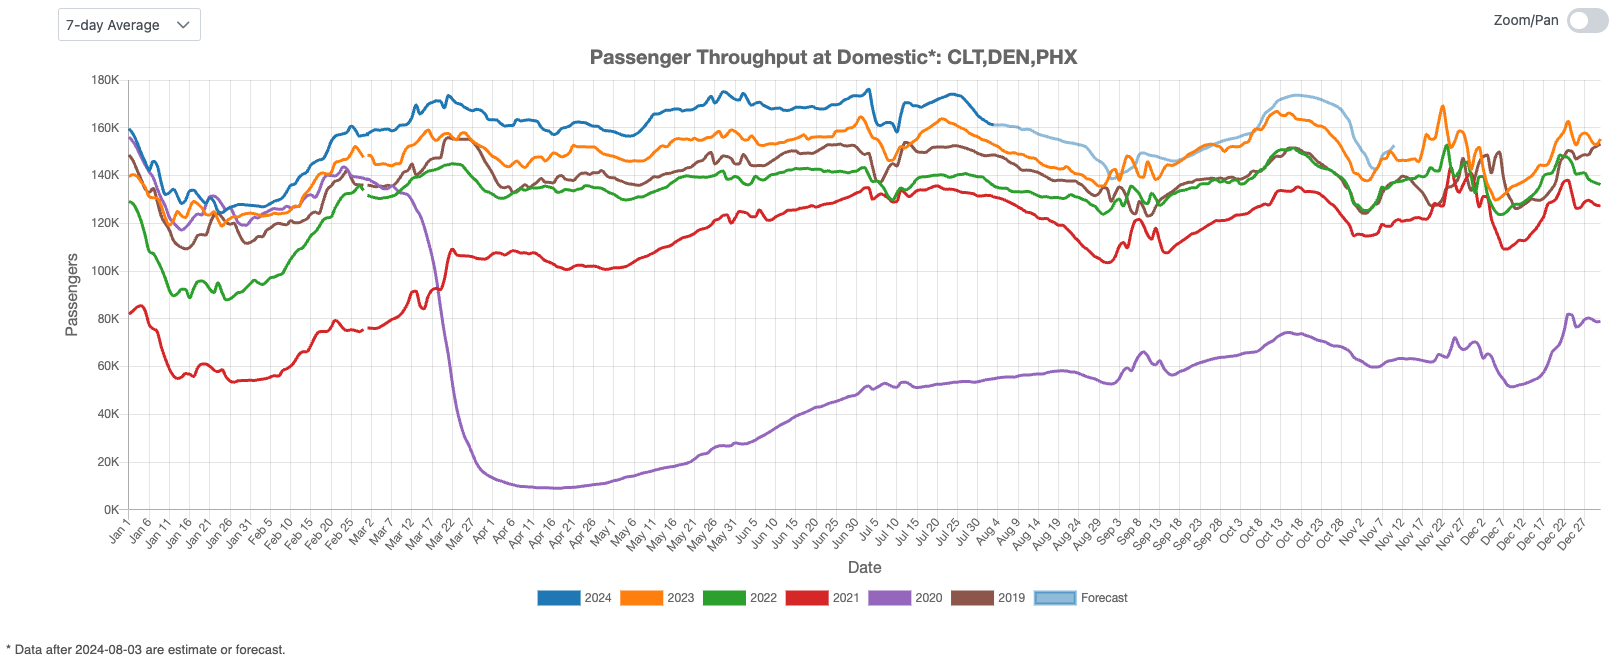
Figure 2: US Domestic Air Traffic Indicator
International Airport Traffic Indicator
Figure 3 shows the U.S. international air traffic index for July 2024, which consistently remained slightly above pre-COVID levels throughout the month. Projections suggest that U.S. international air traffic will surpass 2019 levels over the next three months.
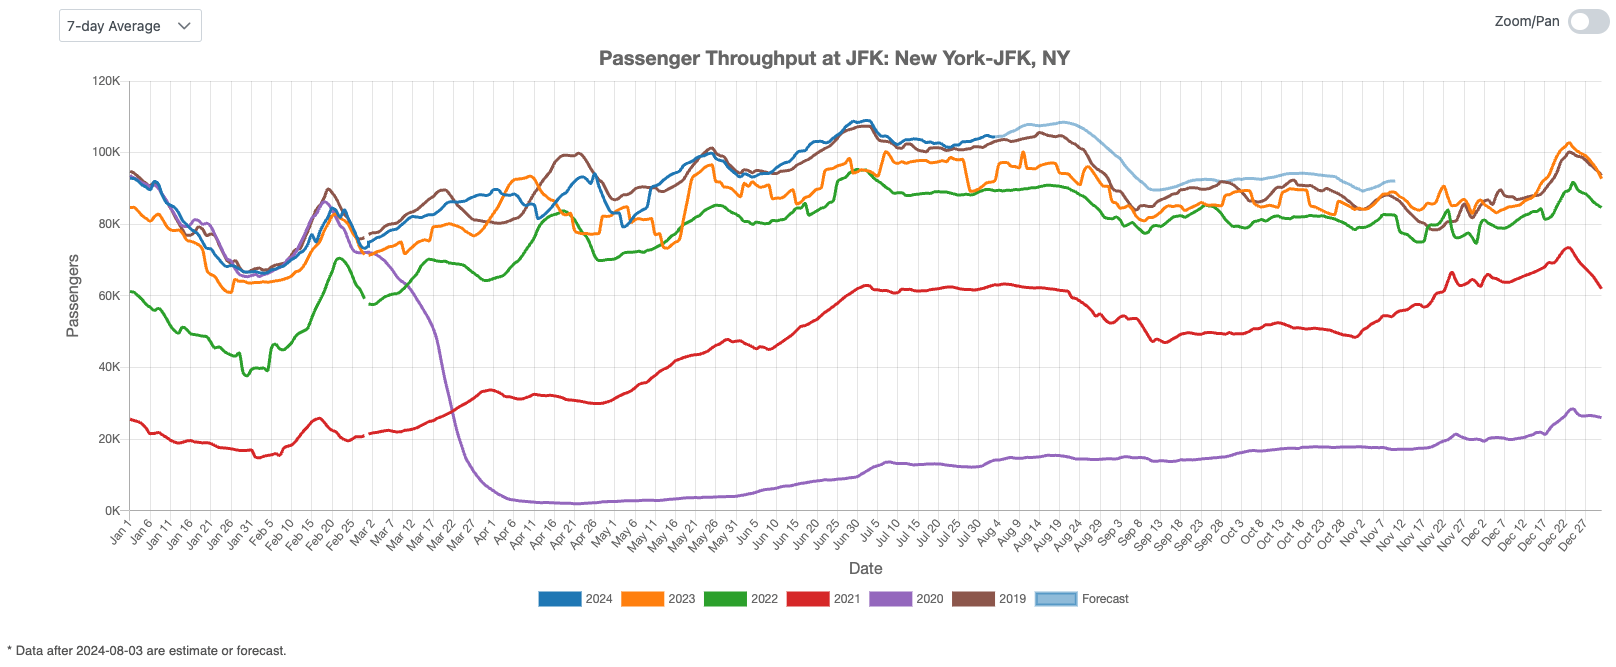
Figure 3: US International Air Traffic Indicator
Leisure Air Traffic Indicator
Figure 4 highlights the current state of the U.S. leisure air travel market. In July 2024, leisure traffic continued to cool down, returning to last year’s levels. Forecasts suggest this decline may persist until September, potentially lowering leisure traffic below last year’s figures.
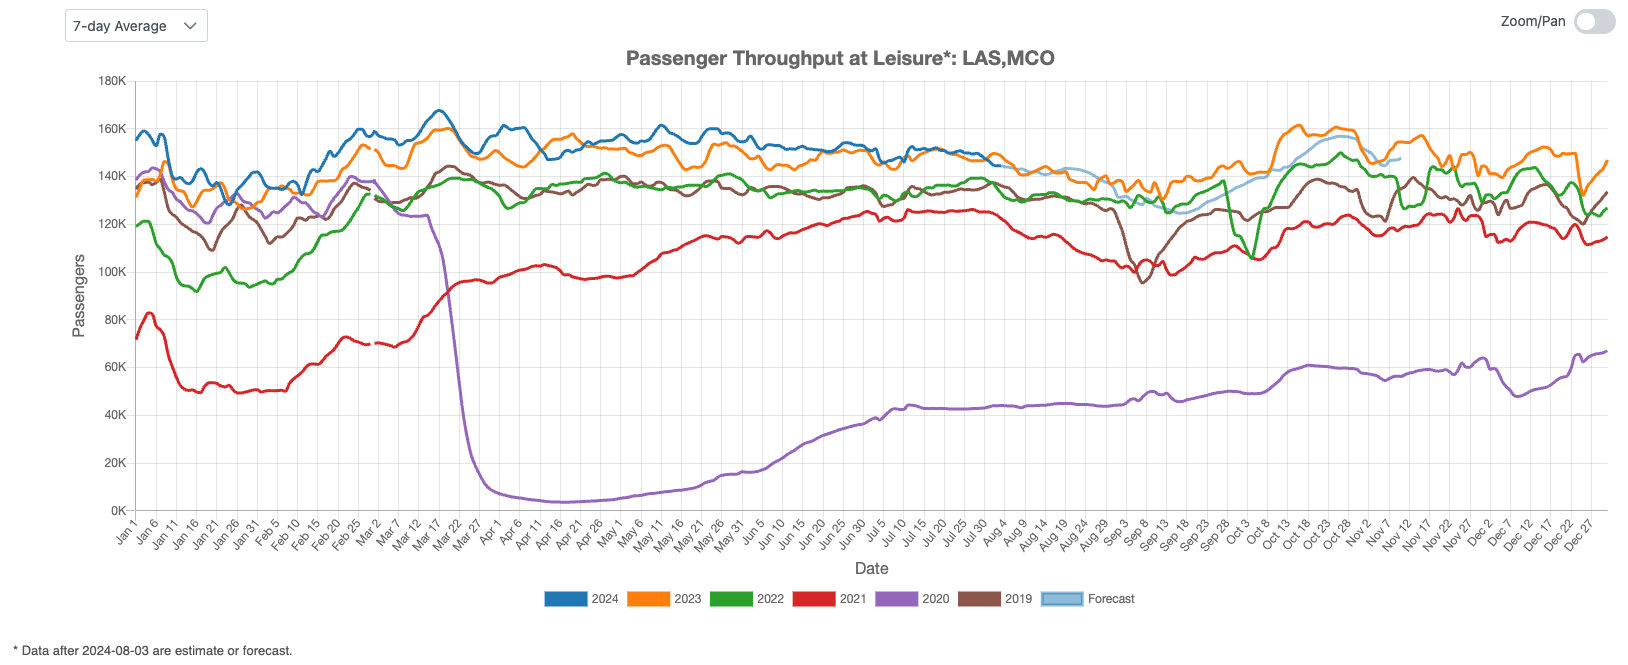
Figure 4: US Leisure Air Traffic Indicator
Business Air Traffic Indicator
Figure 5 depicts the resurgence of business travel in July 2024, with a noticeable decline after the July 4th holiday. Projections suggest that business travel will taper off after the summer and align with last year’s levels over the next three months.
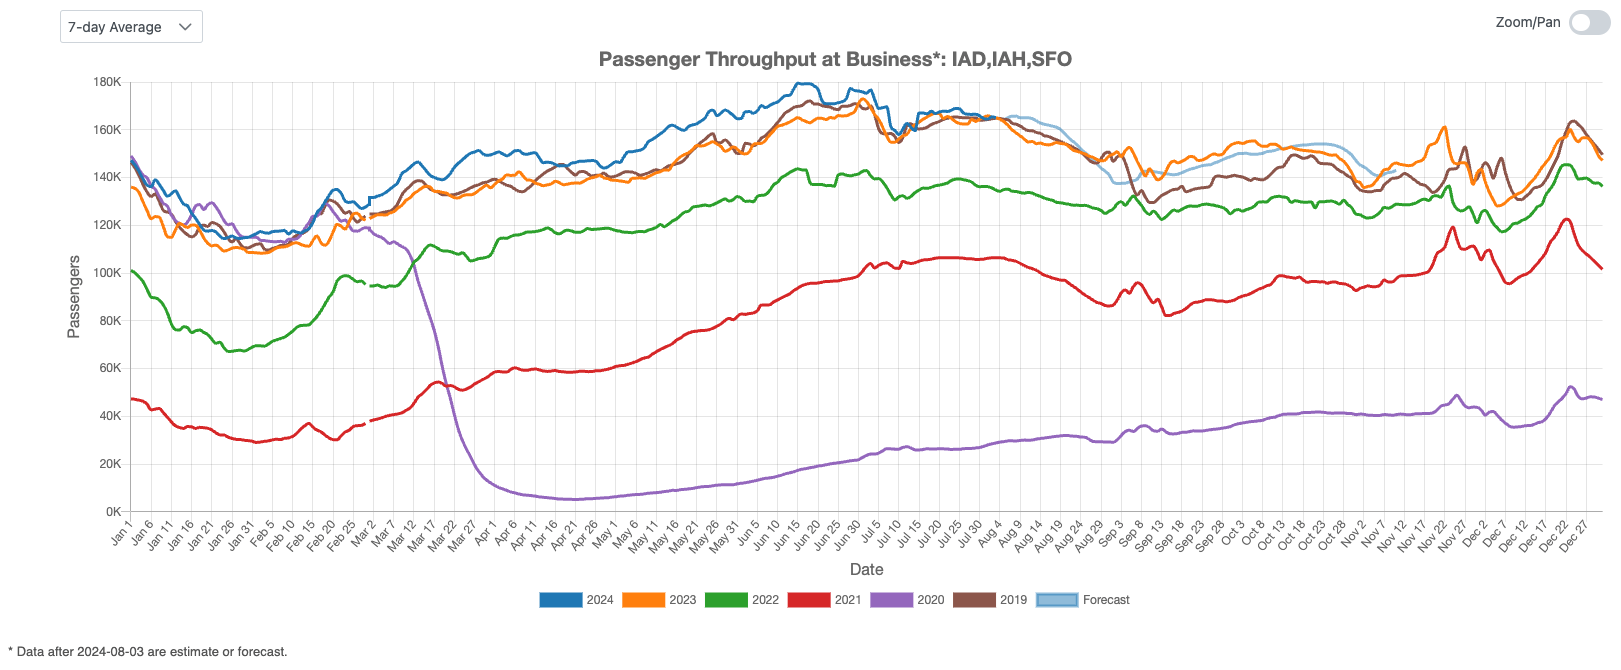
Figure 5: US Business Air Traffic Indicator
In July 2024, U.S. air traffic saw a good growth, with domestic and international travel surpassing pre-COVID levels. While leisure travel cooled to last year’s levels and may decline further, business travel experienced a resurgence but is expected to taper off post-summer. Overall, air traffic trends indicate strong momentum, though some segments may slow down in the coming months.