Daily and hourly airport traffic is crucial for businesses related to airports, including airport authorities, airlines, retailers, ground handlers, rental car companies, and hotels. If you belong to any of these industries, utilizing daily airport traffic data can help you plan your operations, schedule your resources, forecast revenue, and plan budgets more accurately. Additionally, this data can help you target your marketing and promotional efforts more specifically, leading to more effective business strategies.
FlightBI collects and normalizes the airport passenger throughput data from US Transportation Security Administration (TSA). In addition, it has developed a product called Fligence TSA, which features a wide variety of data visualizations. FlightBI is currently offering a two-week, no-obligation trial of Fligence TSA for you to explore valuable insights from the airport traffic data.
This article summarizes US air traffic using the aforementioned tool, utilizing actual airport-level data as of Jan 4, 2026. Our analysis will examine trends in different segments of air travel, such as domestic versus international flights and leisure versus business travel. To learn more about the specific airports chosen to represent these markets, please refer to this article.
U.S. Airport Traffic Overview
As shown in Figure 1, U.S. airport traffic experienced a brief decline following the Thanksgiving holiday, followed by a rebound to another peak of approximately 2.7 million passengers per day toward the end of the year. Current forecasts indicate that passenger volumes are expected to remain roughly 3% above 2025 levels in the near term.
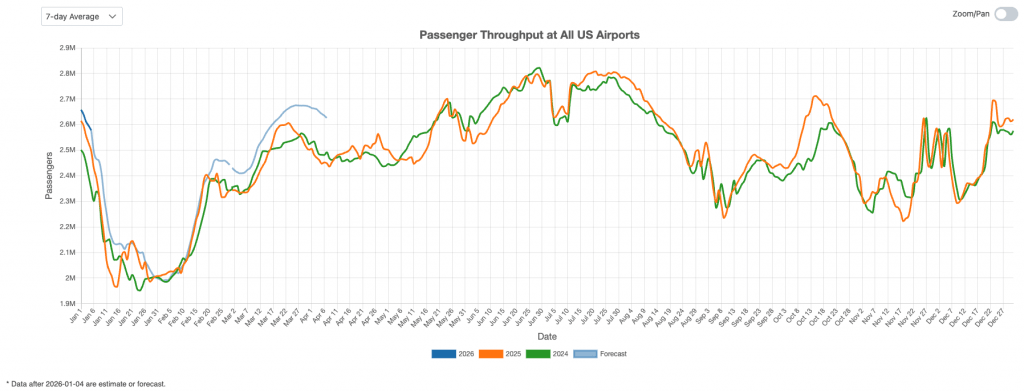
Figure 1: US Overall Air Traffic Trend
Domestic Airport Traffic Indicator
Figure 2 highlights recent travel trends at major domestic hubs, including Charlotte (CLT), Denver (DEN), and Phoenix (PHX). Passenger throughput at these airports generally followed last year’s pattern but exceeded prior-year levels by the end of December. Looking ahead, forecasts for the coming months indicate that this growth is likely to persist.
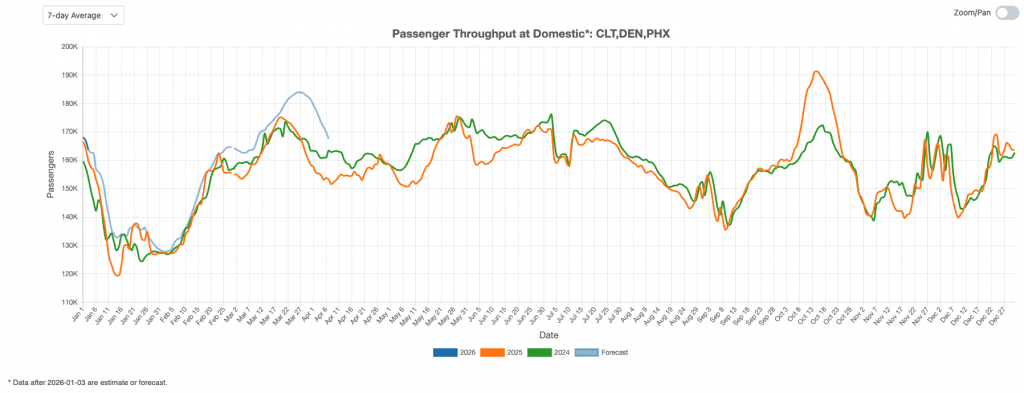
Figure 2: US Domestic Air Traffic Indicator
International Airport Traffic Indicator
Figure 3 illustrates passenger volume trends at New York’s JFK Airport, a major international gateway. International traffic was strong in mid-December but lost momentum approaching the New Year. Nevertheless, the near-term outlook suggests that passenger volumes will exceed levels from the past two years over the next two months.
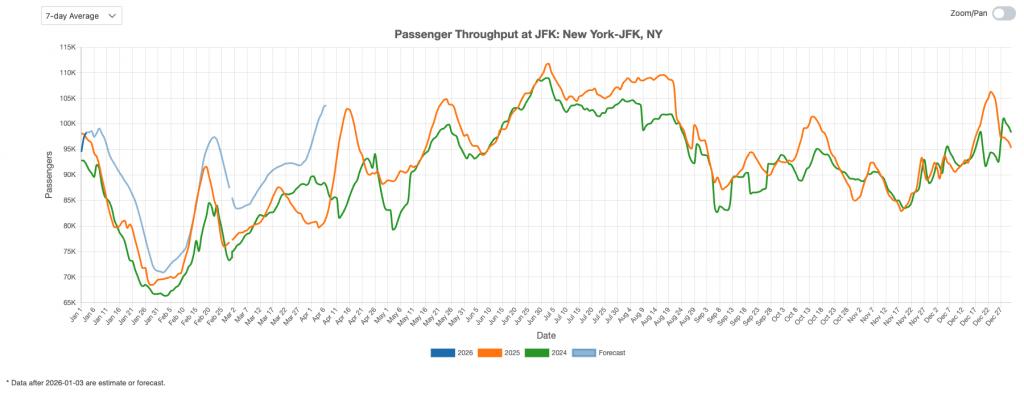
Figure 3: US International Air Traffic Indicator
Leisure Air Traffic Indicator
Figure 4 provides an overview of U.S. leisure air travel trends. Passenger volumes in December 2025 closely mirrored 2024 patterns at leisure-focused airports such as Las Vegas (LAS) and Orlando (MCO). Looking ahead, forecasts indicate that leisure traffic may reach new highs in the coming months, with a seasonal peak expected shortly after New Year’s Day.
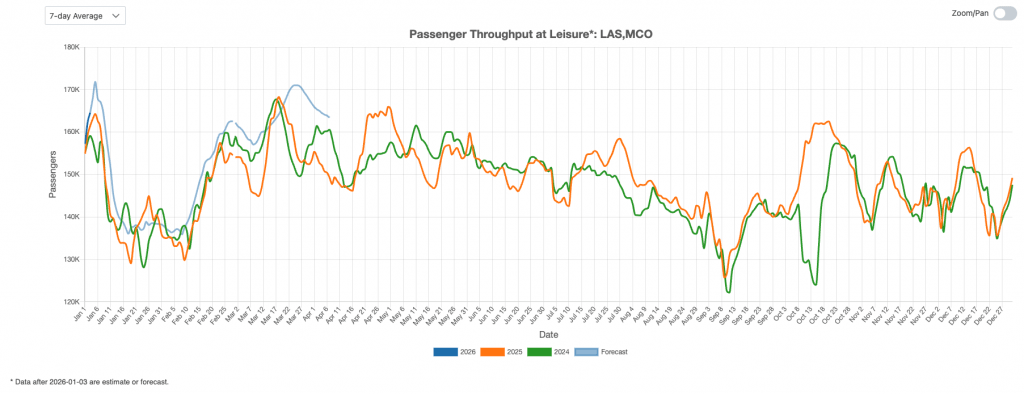
Figure 4: US Leisure Air Traffic Indicator
Business Air Traffic Indicator
Figure 5 shows that business travel exceeded 2024 levels in December. More importantly, projections indicate that business travel is expected to grow strongly in the new year.
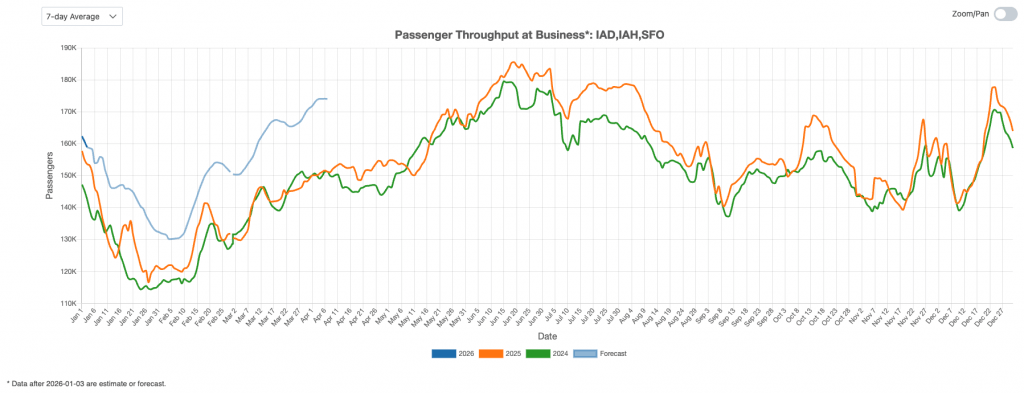
Figure 5: US Business Air Traffic Indicator
To summarize, U.S. air traffic rebounded after Thanksgiving and reached year-end peaks, with passenger volumes exceeding 2024 levels. Domestic, international, leisure, and business travel all show sustained momentum, and near-term forecasts point to continued growth into the new year, especially at international and business airports.