Daily and hourly airport traffic is crucial for businesses related to airports, including airport authorities, airlines, retailers, ground handlers, rental car companies, and hotels. If you belong to any of these industries, utilizing daily airport traffic data can help you plan your operations, schedule your resources, forecast revenue, and plan budgets more accurately. Additionally, this data can help you target your marketing and promotional efforts more specifically, leading to more effective business strategies.
FlightBI collects and normalizes the airport passenger throughput data from US Transportation Security Administration (TSA). In addition, it has developed a product called Fligence TSA, which features a wide variety of data visualizations. FlightBI is currently offering a two-week, no-obligation trial of Fligence TSA for you to explore valuable insights from the airport traffic data.
This article summarizes US air traffic using the aforementioned tool, utilizing actual airport-level data as of August 30, 2025. Our analysis will examine trends in different segments of air travel, such as domestic versus international flights and leisure versus business travel. To learn more about the specific airports chosen to represent these markets, please refer to this article.
U.S. Airport Traffic Overview
As shown in Figure 1, U.S. airport traffic declined from 2.8 million passengers per day at the beginning of August 2025 to 2.5 million by the end of the month. This drop reflects normal seasonal trends, consistent with the past two years. Forecasts suggest traffic will rebound through mid-October, likely surpassing 2023 and 2024 levels.
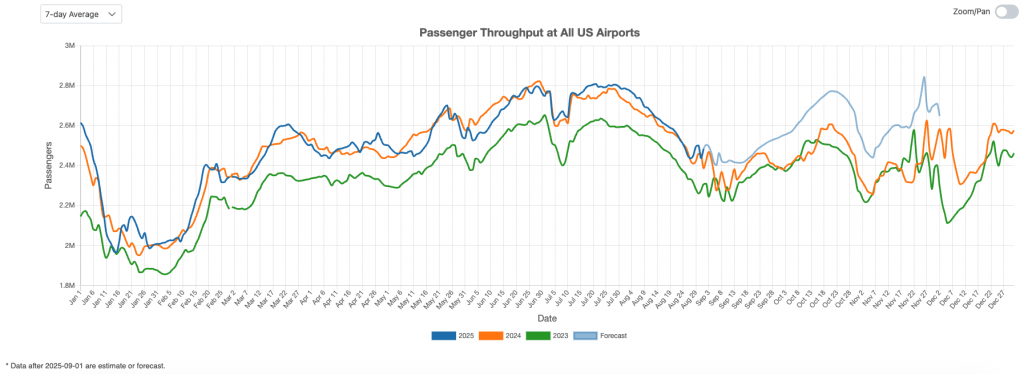
Figure 1: US Overall Air Traffic Trend
Domestic Airport Traffic Indicator
Figure 2 highlights travel trends at major domestic airports, including Charlotte (CLT), Denver (DEN), and Phoenix (PHX). Passenger throughput at these airports declined following the July 4th holiday and continued to soften through late August. However, forecasts for the coming months remain strong, supported by increased capacity from U.S. airlines.
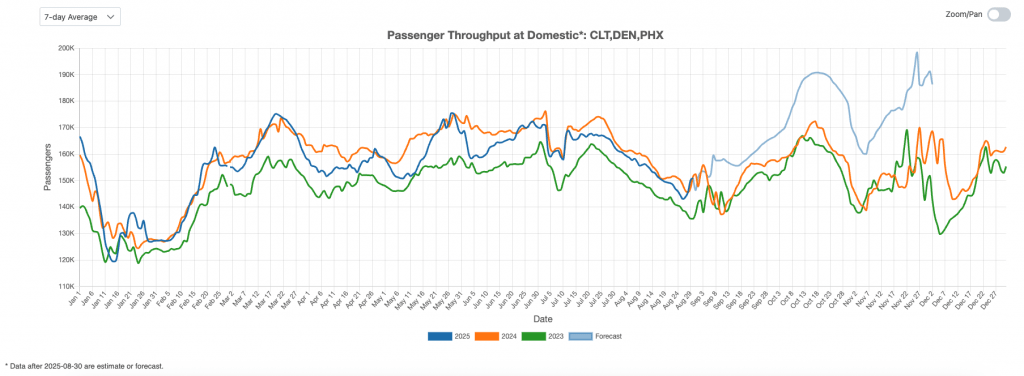
Figure 2: US Domestic Air Traffic Indicator
International Airport Traffic Indicator
Figure 3 illustrates trends in passenger volumes at New York’s JFK Airport, a major international hub. International traffic plateaued during the first 20 days of August before dropping sharply, reflecting the typical pattern of summer travelers returning to work and daily routines. The outlook for the following month is relatively flat but remains above 2023 and 2024 levels.
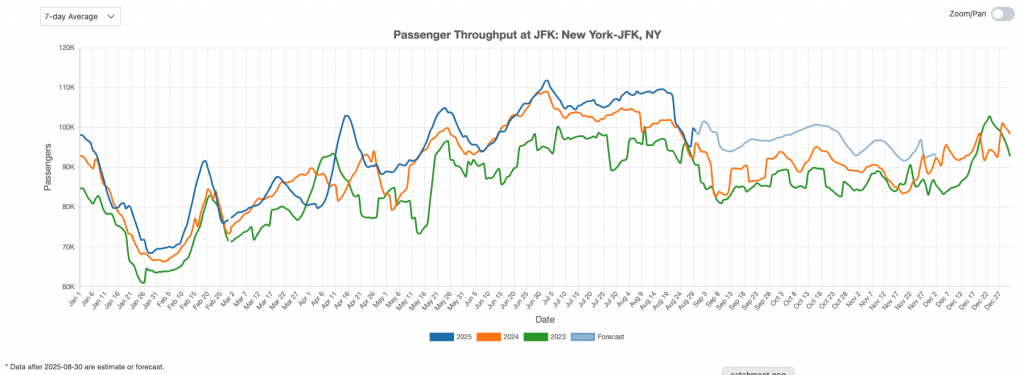
Figure 3: US International Air Traffic Indicator
Leisure Air Traffic Indicator
Figure 4 provides an overview of the U.S. leisure air travel market. For most of August 2025, passenger volumes at leisure-focused airports—such as Las Vegas (LAS) and Orlando (MCO)—remained above 2024 levels. Forecasts indicate this trend will likely continue in the coming months, with a peak expected before the Thanksgiving holiday. Notably, leisure traffic has not been significantly affected by Spirit’s bankruptcy, as carriers such as Frontier and Allegiant have absorbed much of the displaced demand.
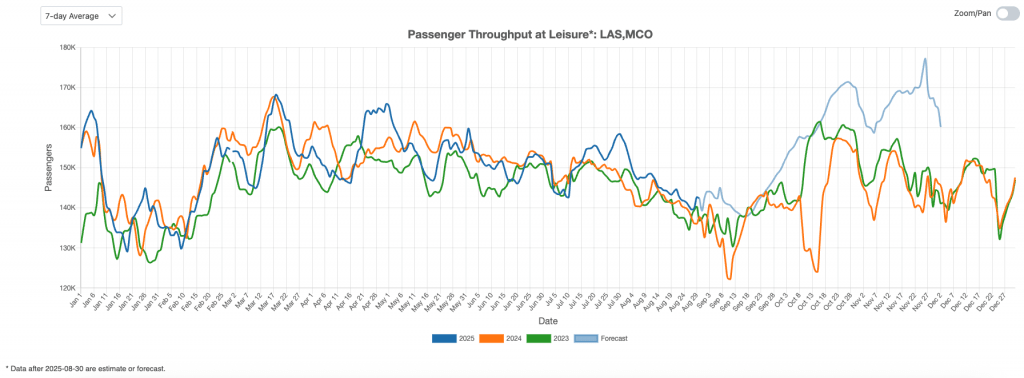
Figure 4: US Leisure Air Traffic Indicator
Business Air Traffic Indicator
Figure 5 highlights a downward trend in business travel, though August 2025 passenger volumes still surpassed those of the same period in 2024. Projections suggest volumes will rise through the fall, reaching a peak in November.
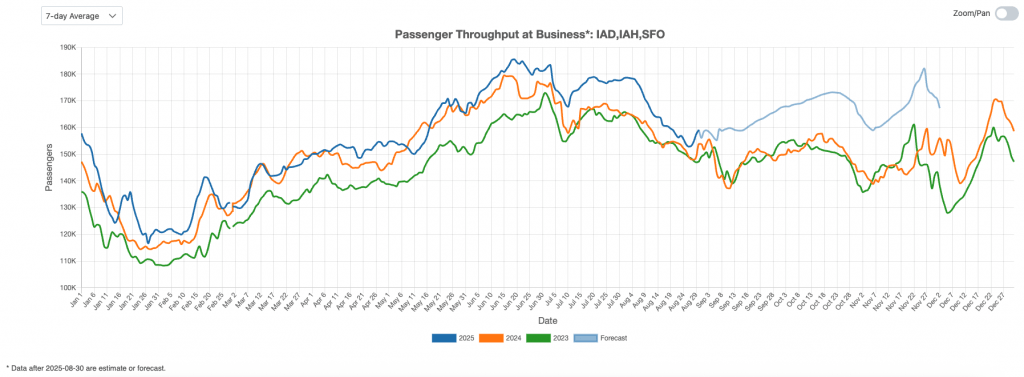
Figure 5: US Business Air Traffic Indicator
In August 2025, U.S. air travel showed seasonal declines but remained above 2024 levels. Leisure markets like LAS and MCO stayed strong despite Spirit’s bankruptcy, while international traffic eased after summer peaks. Business travel softened yet exceeded 2024, with forecasts projecting growth across all segments into mid-October and November.