Daily and hourly airport traffic is crucial for businesses related to airports, including airport authorities, airlines, retailers, ground handlers, rental car companies, and hotels. If you belong to any of these industries, utilizing daily airport traffic data can help you plan your operations, schedule your resources, forecast revenue, and plan budgets more accurately. Additionally, this data can help you target your marketing and promotional efforts more specifically, leading to more effective business strategies.
FlightBI collects and normalizes the airport passenger throughput data from US Transportation Security Administration (TSA). In addition, it has developed a product called Fligence TSA, which features a wide variety of data visualizations. FlightBI is currently offering a two-week, no-obligation trial of Fligence TSA for you to explore valuable insights from the airport traffic data.
This article summarizes US air traffic using the aforementioned tool, utilizing actual airport-level data as of Aug 31, 2024. Our analysis will examine trends in different segments of air travel, such as domestic versus international flights and leisure versus business travel. To learn more about the specific airports chosen to represent these markets, please refer to this article.
U.S. Airport Traffic Overview
In 2024, U.S. airport traffic saw significant growth, with daily passenger numbers in August consistently exceeding those of previous years. However, the growth rate slowed from 10% to 5%, as shown in Figure 1. Since mid-February 2024, air traffic has remained at its highest levels in five years, and this upward trend is expected to continue into the next quarter.
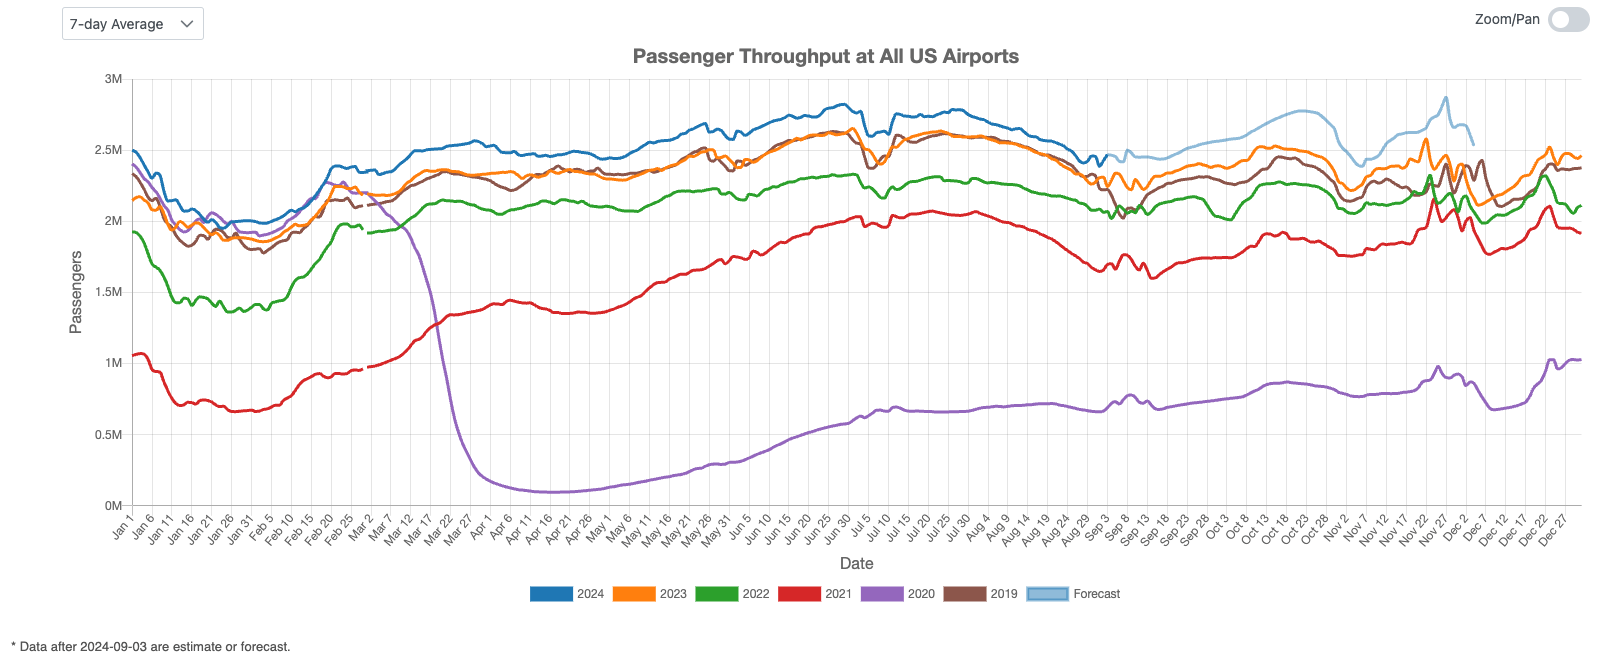
Figure 1: US Overall Air Traffic Trend
Domestic Airport Traffic Indicator
Figure 2 shows a steady year-over-year growth in U.S. domestic air travel throughout August. Due to seasonality, domestic traffic typically declines from the end of July to the end of August. However, projections indicate that domestic air traffic may reach another peak around the Thanksgiving holiday.
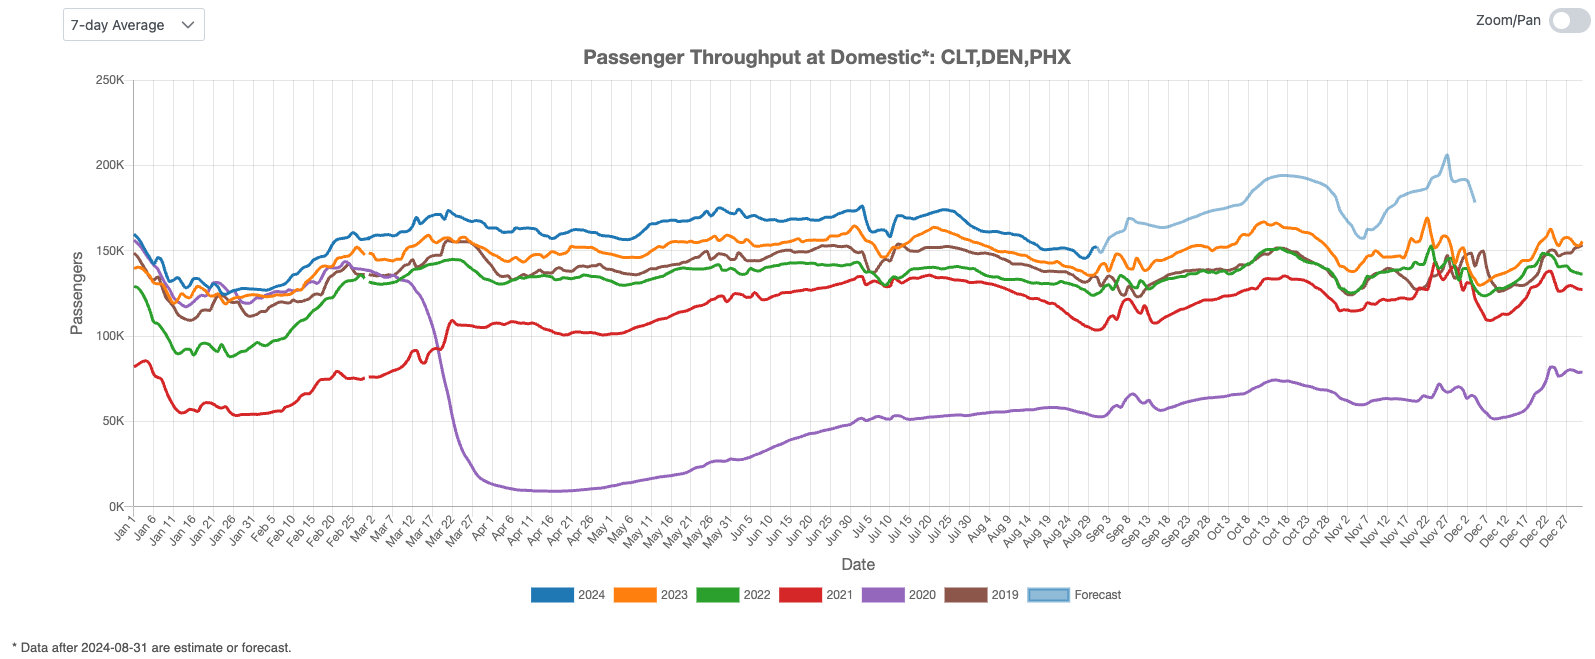
Figure 2: US Domestic Air Traffic Indicator
International Airport Traffic Indicator
Figure 3 displays the U.S. international air traffic index for August 2024, which has once again fallen below pre-COVID levels. Projections indicate that U.S. international air traffic will remain relatively flat over the next three months.
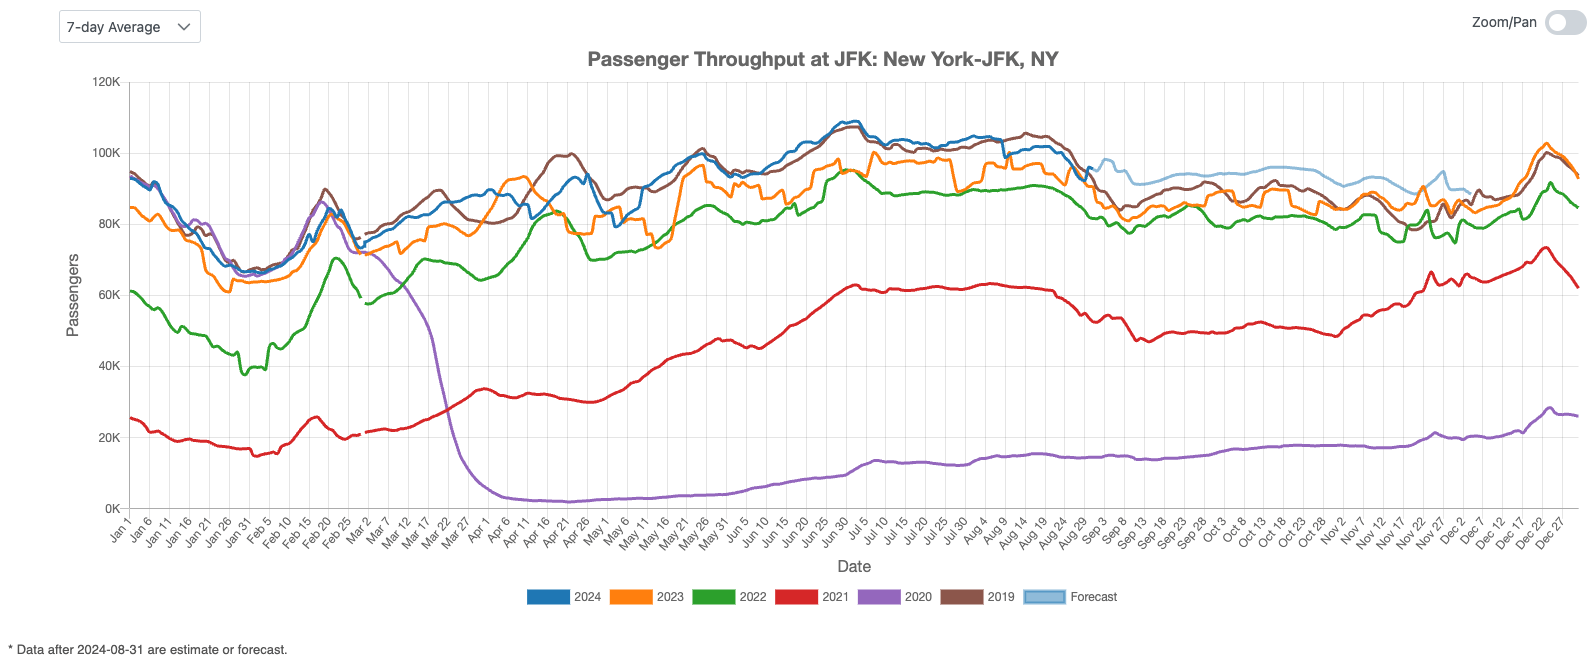
Figure 3: US International Air Traffic Indicator
Leisure Air Traffic Indicator
Figure 4 highlights the current state of the U.S. leisure air travel market. In August 2024, leisure traffic cooled down, returning to last year’s levels. However, forecasts predict a rebound after September, with a potential peak around the Thanksgiving holiday.
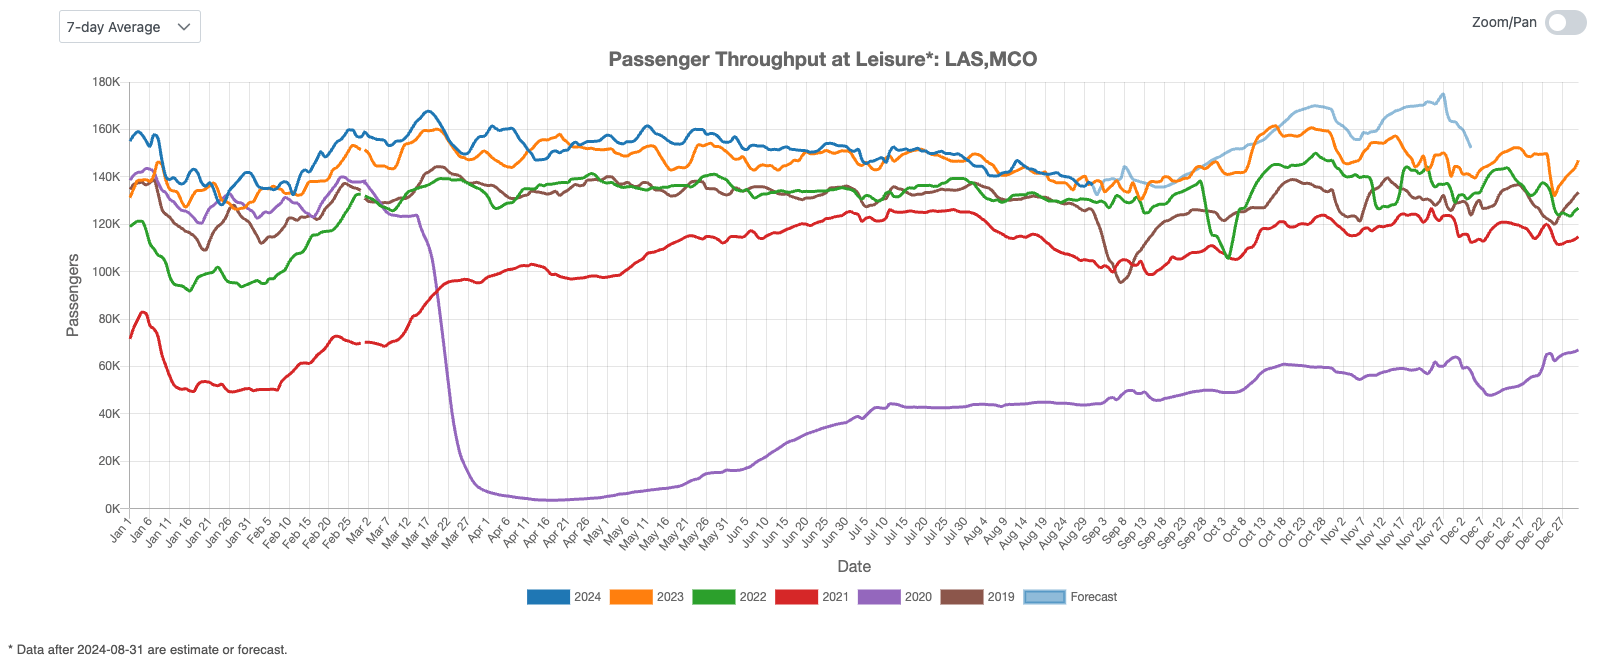
Figure 4: US Leisure Air Traffic Indicator
Business Air Traffic Indicator
Figure 5 illustrates the resurgence of business travel in August 2024, following a seasonal decline after the July 4th holiday. Projections indicate that business travel is expected to gain more momentum in the fall.
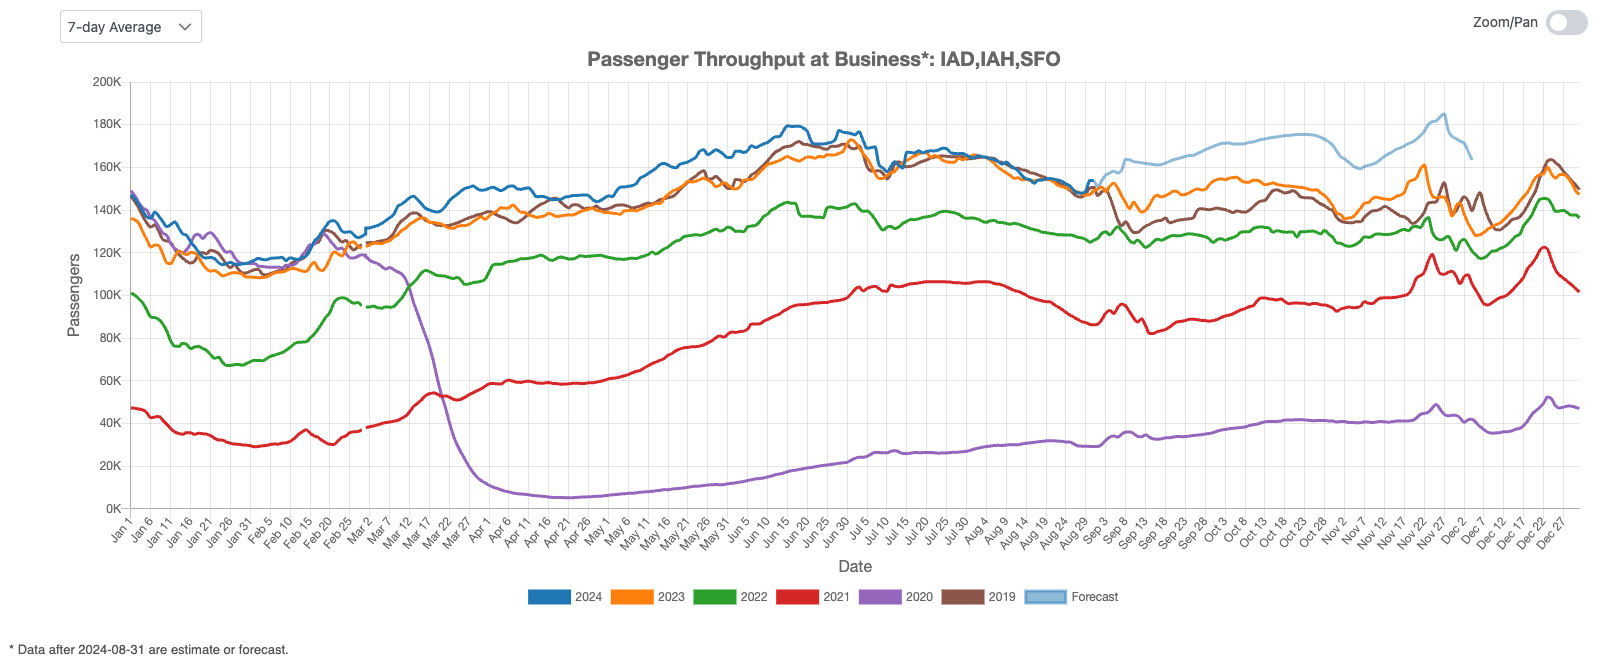
Figure 5: US Business Air Traffic Indicator
In August 2024, U.S. airport traffic showed year-over-year growth. Domestic travel remained steady, while international traffic fell below pre-COVID levels. Leisure traffic cooled but is expected to rebound by Thanksgiving. Business travel is projected to gain momentum throughout the fall season.