Daily and hourly airport traffic is crucial for businesses related to airports, including airport authorities, airlines, retailers, ground handlers, rental car companies, and hotels. If you belong to any of these industries, utilizing daily airport traffic data can help you plan your operations, schedule your resources, forecast revenue, and plan budgets more accurately. Additionally, this data can help you target your marketing and promotional efforts more specifically, leading to more effective business strategies.
FlightBI collects and normalizes the airport passenger throughput data from US Transportation Security Administration (TSA). In addition, it has developed a product called Fligence TSA, which features a wide variety of data visualizations. FlightBI is currently offering a two-week, no-obligation trial of Fligence TSA for you to explore valuable insights from the airport traffic data.
This article summarizes US air traffic using the aforementioned tool, utilizing actual airport-level data as of May 3rd, 2025. Our analysis will examine trends in different segments of air travel, such as domestic versus international flights and leisure versus business travel. To learn more about the specific airports chosen to represent these markets, please refer to this article.
U.S. Airport Traffic Overview
Boosted by strong growth in March, U.S. airport traffic remained above 2024 levels through most of April 2025, as shown in Figure 1. Forecasts project continued momentum, with daily passenger volumes expected to exceed 2.8 million by late June and climb even higher in July.
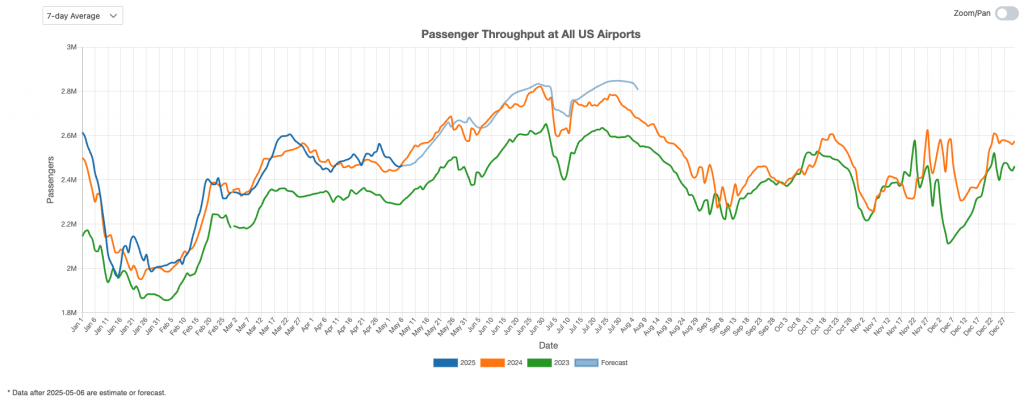
Figure 1: US Overall Air Traffic Trend
Domestic Airport Traffic Indicator
Figure 2 highlights domestic travel trends at major airports such as Charlotte (CLT), Denver (DEN), and Phoenix (PHX). As in previous years, domestic air traffic dipped following the spring break season but rebounded by the end of April to reach 2024 levels. However, overall April volumes remained below last year’s. Continued growth is expected to help close the gap and align with 2024 levels in the coming months.
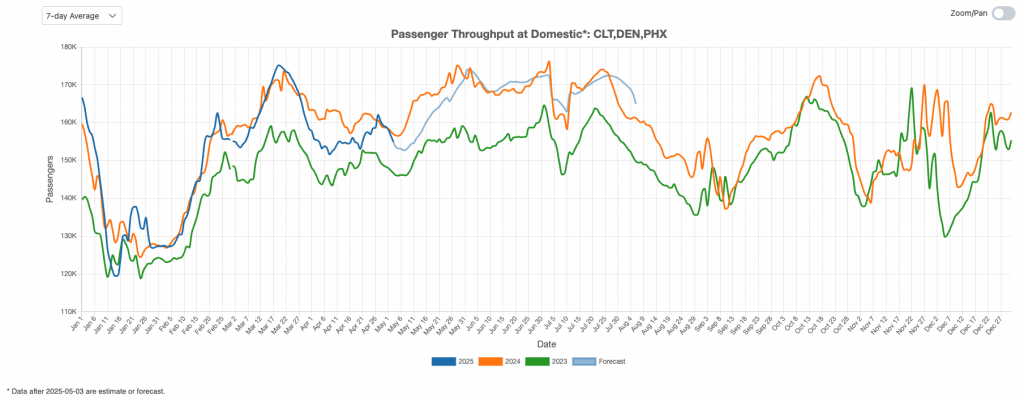
Figure 2: US Domestic Air Traffic Indicator
International Airport Traffic Indicator
Figure 3 illustrates fluctuations in passenger volumes at New York’s JFK Airport, a key hub for international travel. April saw a peak in international traffic, with 2025 volumes exceeding 2024 levels during the first half of the month before tapering off in the latter half. Despite this decline, the outlook remains positive, with projections indicating steady growth throughout the summer season.
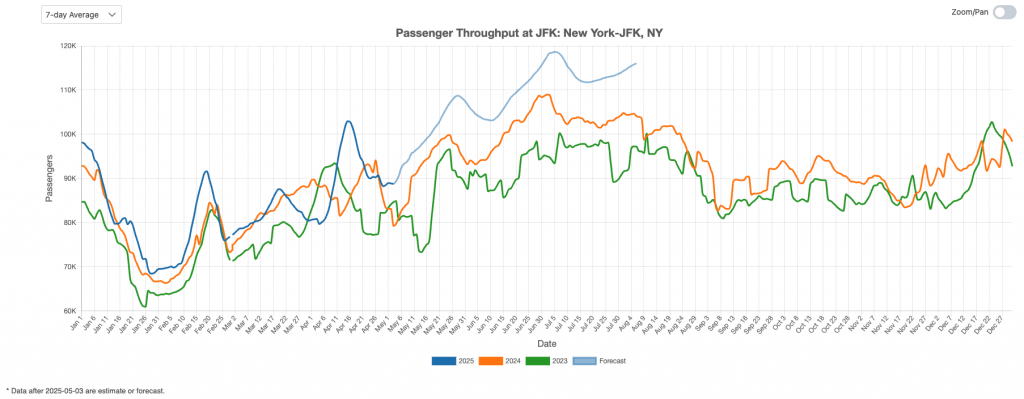
Figure 3: US International Air Traffic Indicator
Leisure Air Traffic Indicator
Figure 4 provides an overview of the U.S. leisure air travel market. In April 2025, passenger volumes at primarily leisure-focused airports such as Las Vegas (LAS) and Orlando (MCO) were stronger than usual. Forecasts indicate that 2025 is on track to outperform both 2023 and 2024.
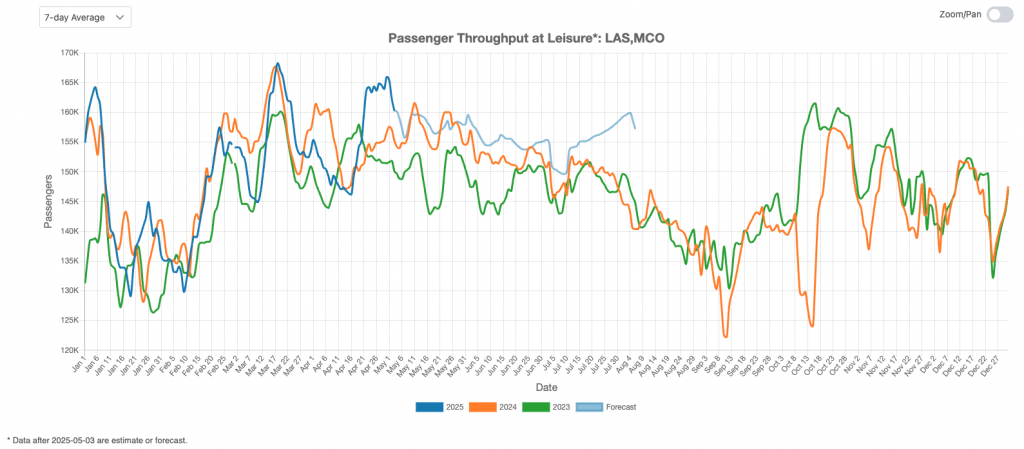
Figure 4: US Leisure Air Traffic Indicator
Business Air Traffic Indicator
Figure 5 highlights the upward trend in business travel, with April 2025 passenger volumes surpassing those of the same period in 2024. Projections point to continued growth in the coming months.
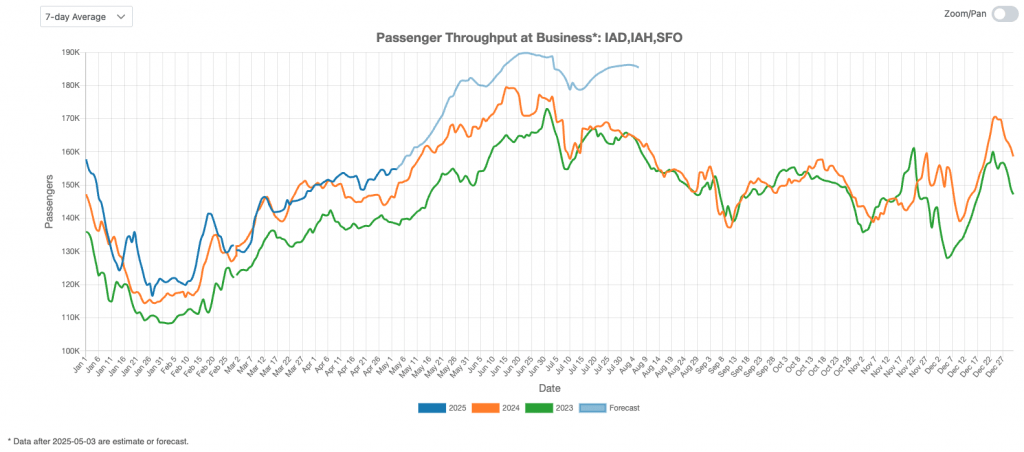
Figure 5: US Business Air Traffic Indicator
April 2025 air traffic remained strong across the U.S., supported by a rebound in domestic travel and a surge in international traffic. Leisure airports outperformed seasonal expectations, while business travel volumes exceeded 2024 levels. With both leisure and business markets showing solid momentum, and international traffic contributing significantly to April’s growth, the overall outlook for summer remains positive.