Daily and hourly airport traffic is crucial for businesses related to airports, including airport authorities, airlines, retailers, ground handlers, rental car companies, and hotels. If you belong to any of these industries, utilizing daily airport traffic data can help you plan your operations, schedule your resources, forecast revenue, and plan budgets more accurately. Additionally, this data can help you target your marketing and promotional efforts more specifically, leading to more effective business strategies.
FlightBI collects and normalizes the airport passenger throughput data from US Transportation Security Administration (TSA). In addition, it has developed a product called Fligence TSA, which features a wide variety of data visualizations. FlightBI is currently offering a two-week, no-obligation trial of Fligence TSA for you to explore valuable insights from the airport traffic data.
This article summarizes US air traffic using the aforementioned tool, utilizing actual airport-level data as of May 11, 2024. Our analysis will examine trends in different segments of air travel, such as domestic versus international flights and leisure versus business travel. To learn more about the specific airports chosen to represent these markets, please refer to this article.
US Overall Airport Traffic Status
In 2024, US airport traffic maintained a robust pace, with daily passenger numbers consistently surpassing those of previous years by 5-8% throughout April, as shown in Figure 1. By the end of the month, air traffic in the US had surged to its highest levels in five years. Additionally, forecasts indicate that this growth will continue into the next quarter.
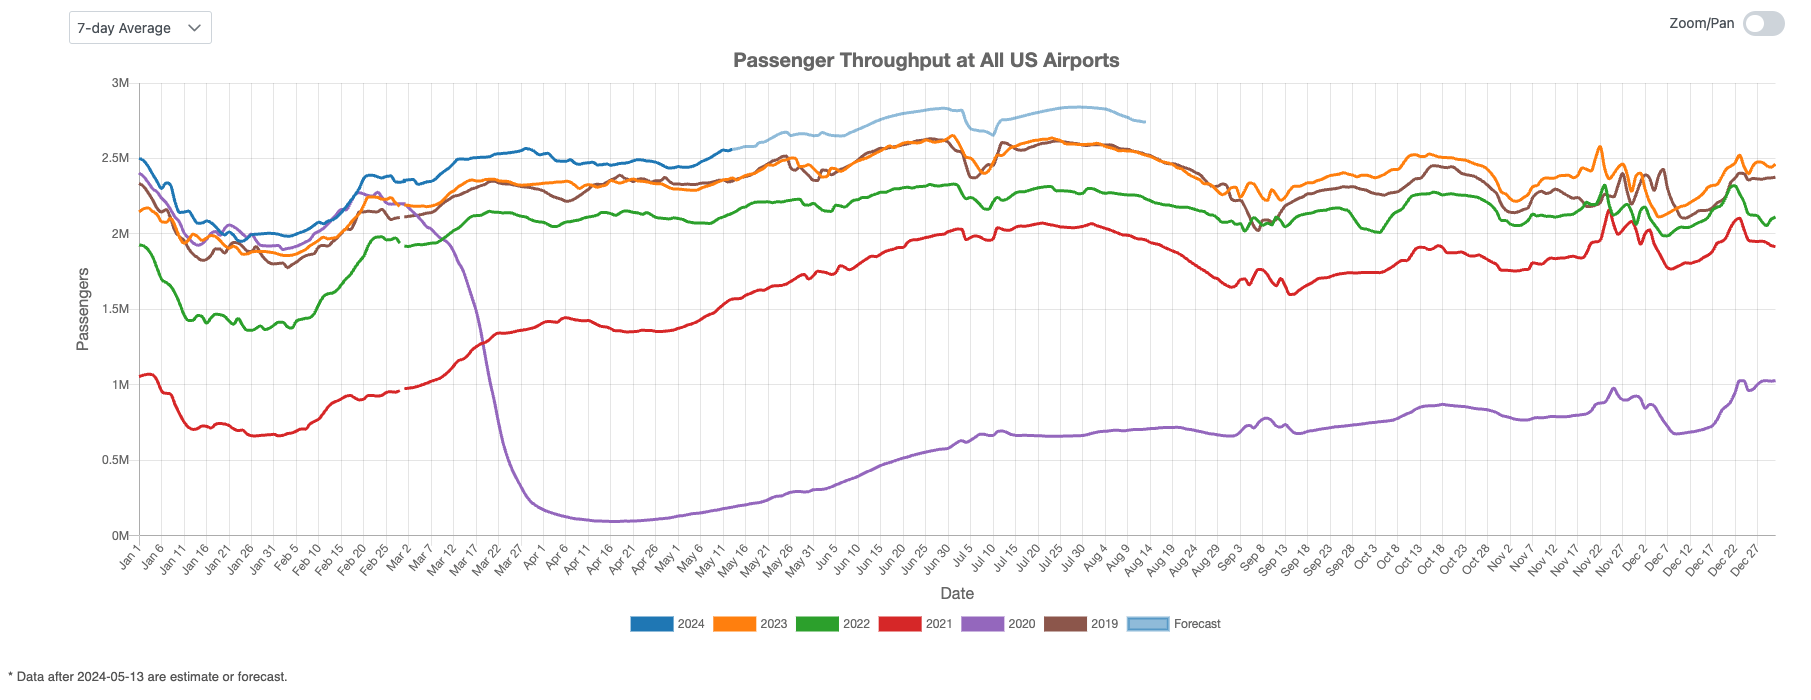
Figure 1: US Overall Air Traffic Trend
Domestic Airport Traffic Indicator
Figure 2 illustrates a slightly decline of U.S. domestic air travel in April, following solid growth in March. Given the increase at the beginning of May, we anticipate that domestic air traffic will continue to exceed previous years’ records in the upcoming quarter.
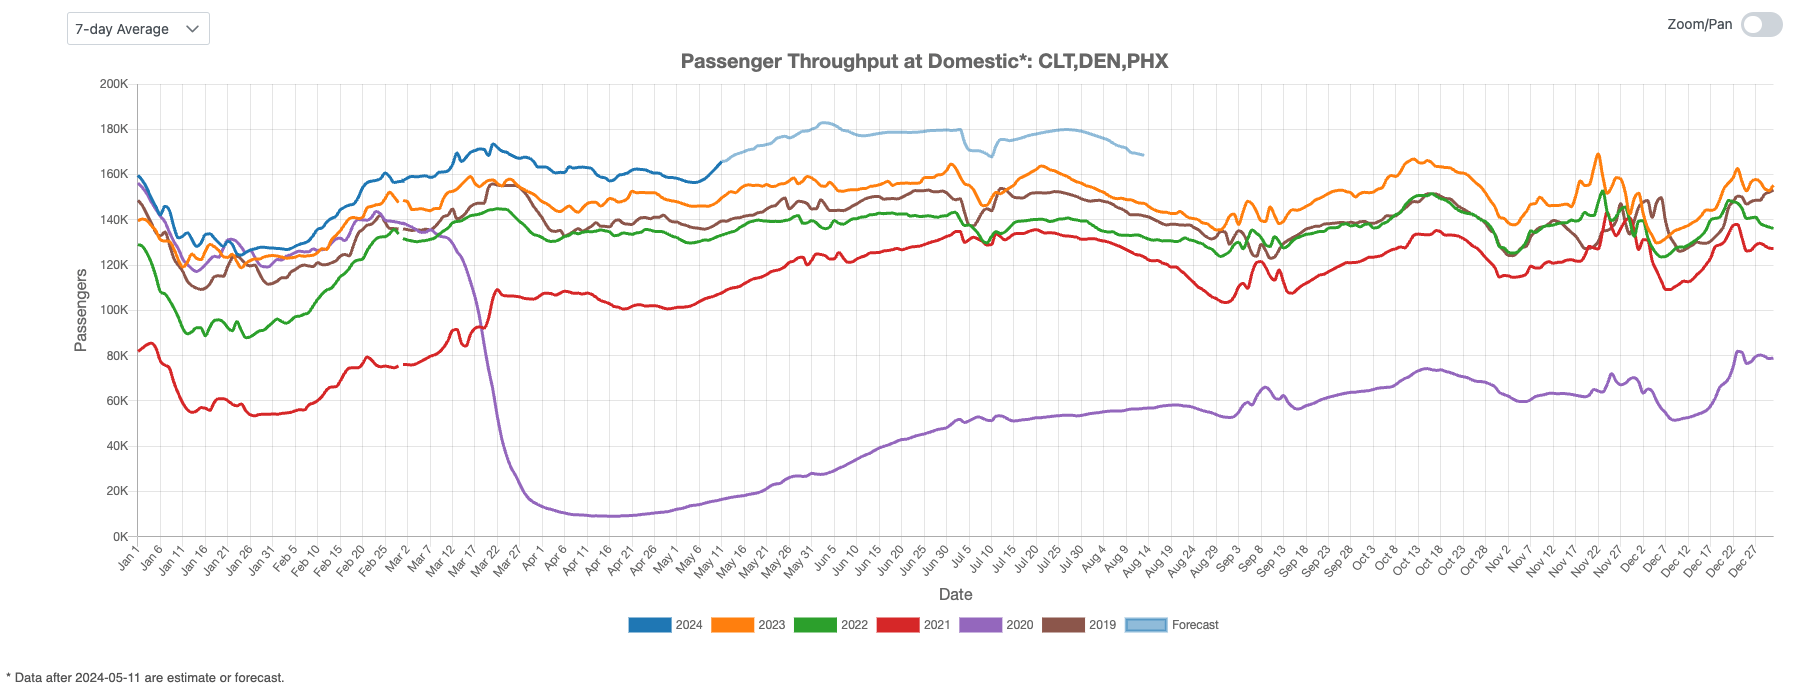
Figure 2: US Domestic Air Traffic Indicator
International Airport Traffic Indicator
Figure 3 displays the U.S. international air traffic index for April 2024, showing fluctuations throughout the month. International traffic levels remain below pre-COVID levels for April. However, it is anticipated that U.S. international air traffic may catch up to the 2019 levels over the next three months.
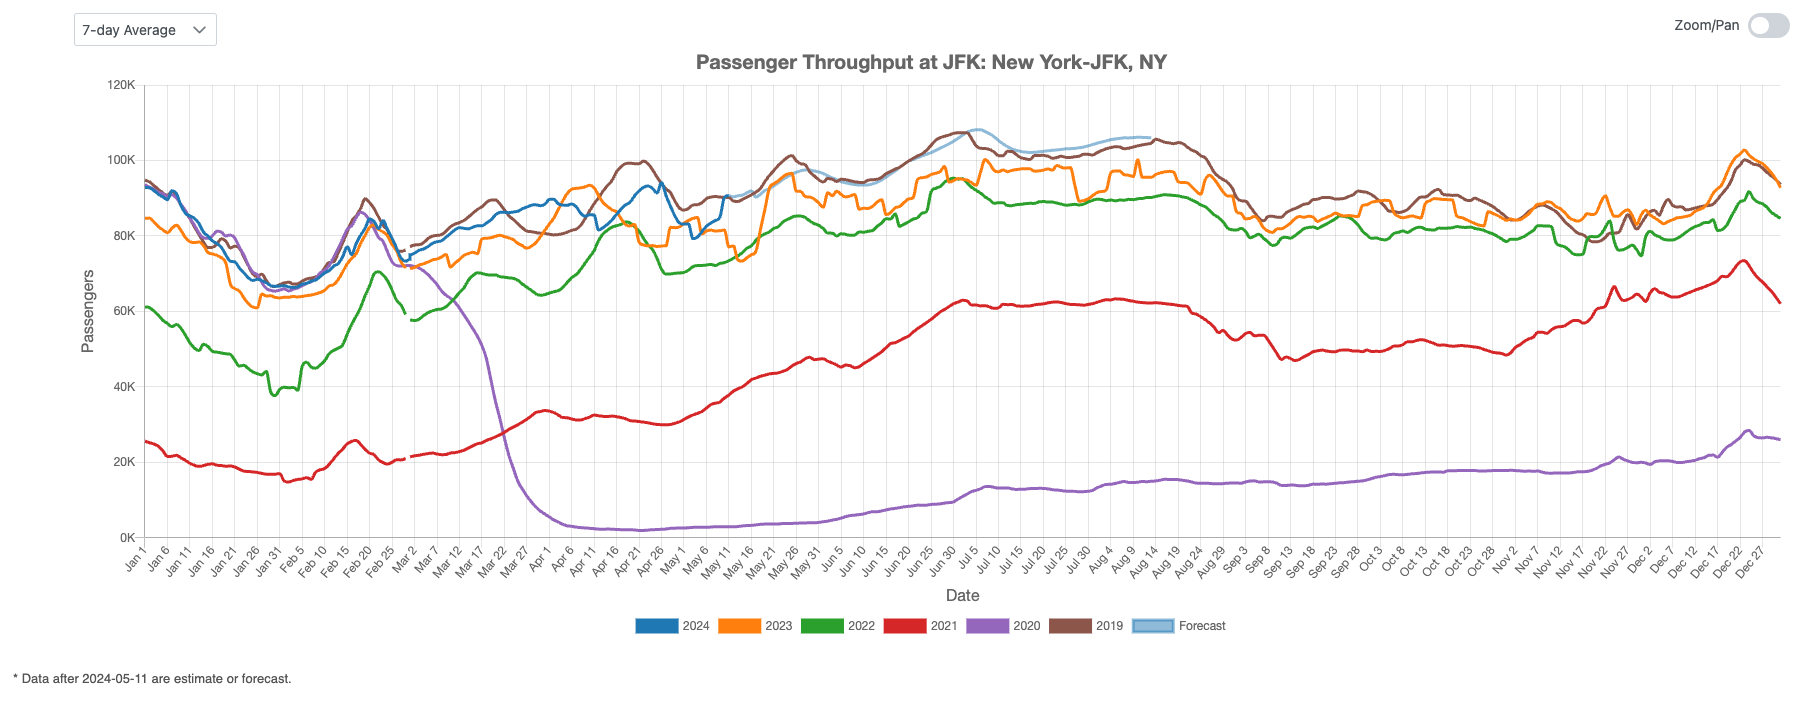
Figure 3: US International Air Traffic Indicator
Leisure Air Traffic Indicator
Figure 4 showcases the current state of the U.S. leisure air travel market. In April 2024, the traffic curve dipped below last year’s levels in the middle of the month but quickly recovered by the end of the month. Projections suggest that traffic levels will remain flat over the next quarter.
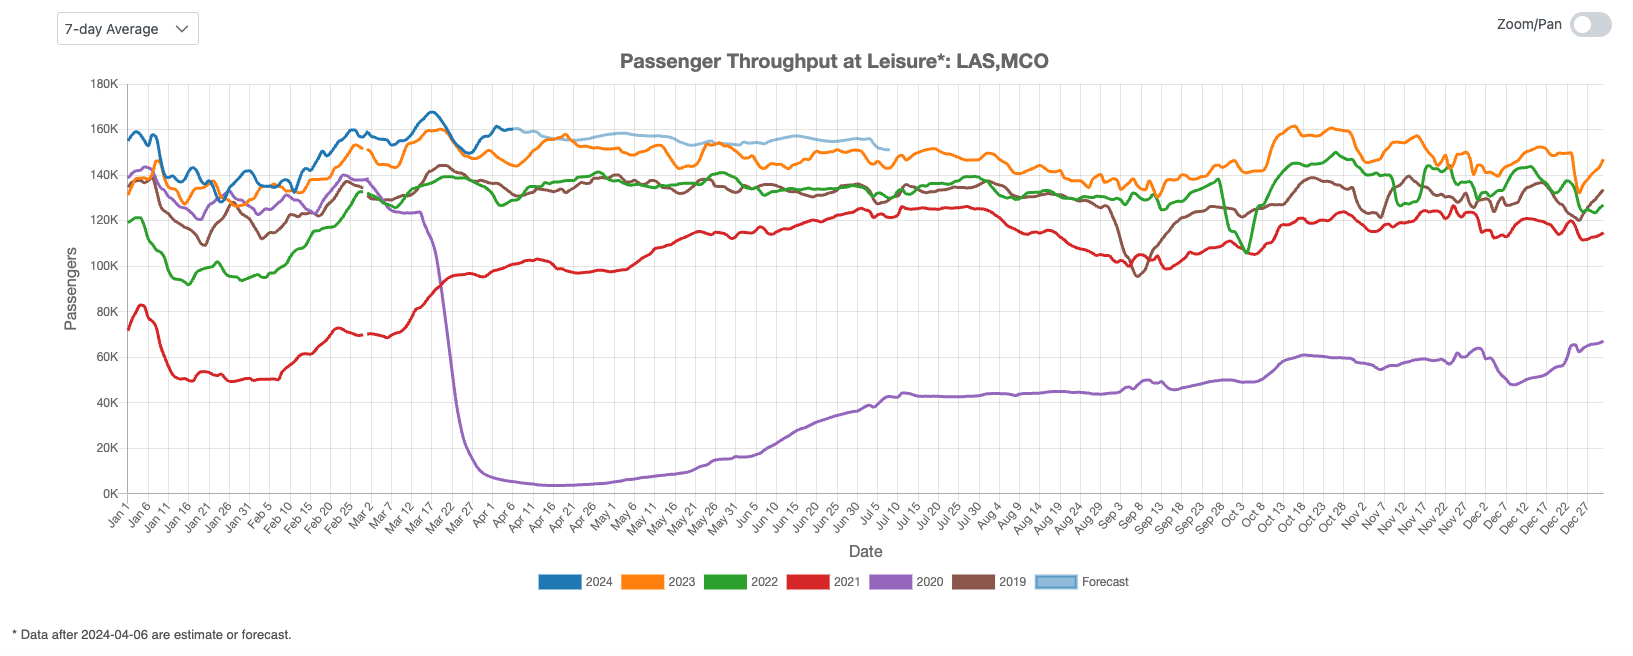
Figure 4: US Leisure Air Traffic Indicator
Business Air Traffic Indicator
Figure 5 depicts the strengthening of business travel in April 2024, signaling potential for continued growth. Projections indicate that within the next three months, business travel will reach levels not seen in recent years.
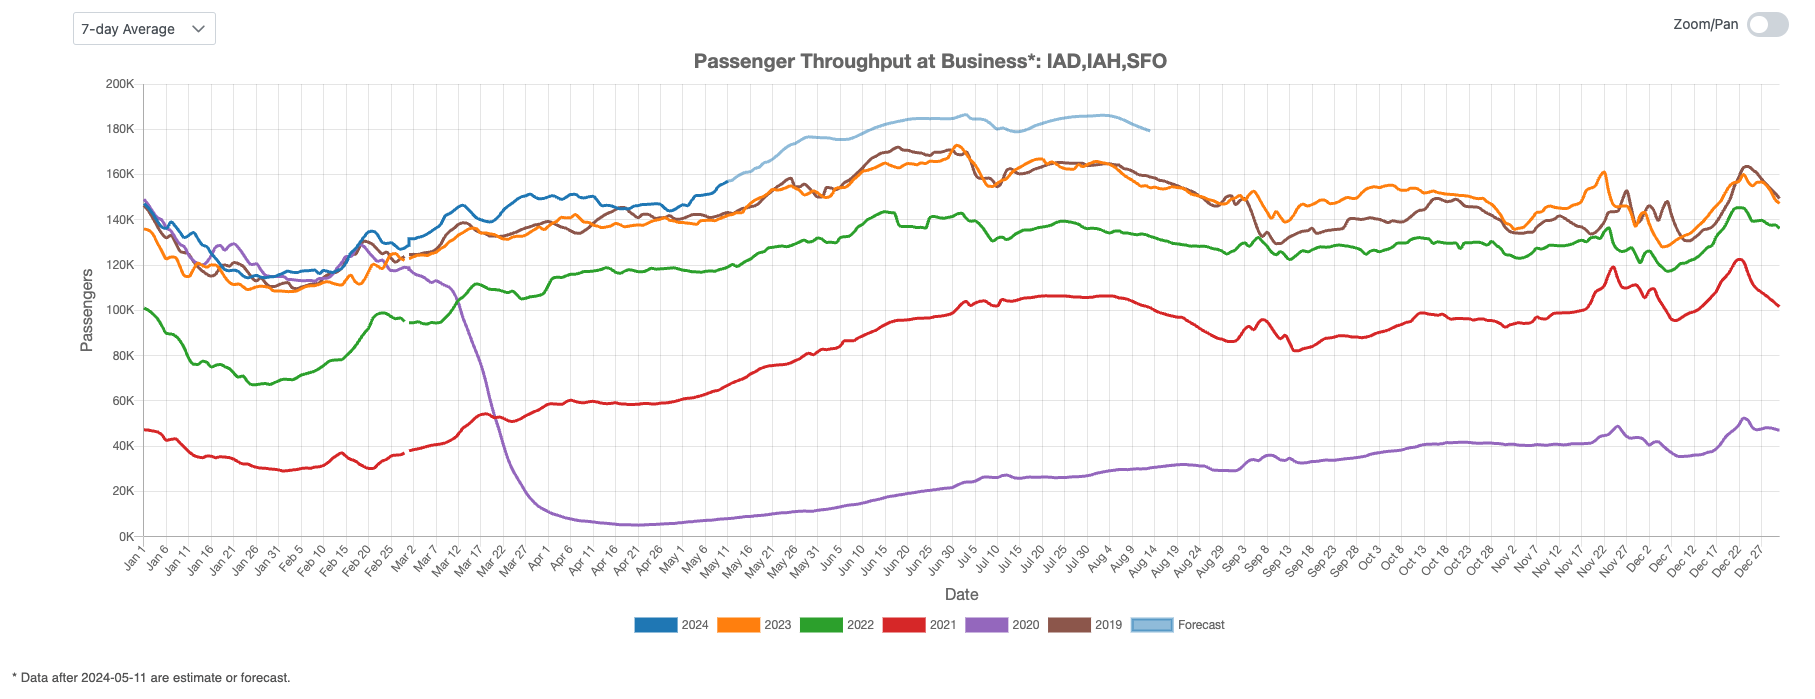
Figure 5: US Business Air Traffic Indicator
In April 2024, US air travel showed solid growth across various sectors. Domestic air traffic surged to its highest levels in five years, while international traffic, despite fluctuations, is expected to catch up to pre-COVID levels over the next three months. Leisure travel experienced a mid-month dip but quickly recovered, with projections suggesting flat growth. Business travel strengthened and is anticipated to reach unprecedented levels in the coming quarter. Overall, the US air travel market is robust and poised for continued expansion.