Daily and hourly airport traffic is crucial for businesses related to airports, including airport authorities, airlines, retailers, ground handlers, rental car companies, and hotels. If you belong to any of these industries, utilizing daily airport traffic data can help you plan your operations, schedule your resources, forecast revenue, and plan budgets more accurately. Additionally, this data can help you target your marketing and promotional efforts more specifically, leading to more effective business strategies.
FlightBI collects and normalizes the airport passenger throughput data from US Transportation Security Administration (TSA). In addition, it has developed a product called Fligence TSA, which features a wide variety of data visualizations. FlightBI is currently offering a two-week, no-obligation trial of Fligence TSA for you to explore valuable insights from the airport traffic data.
This article summarizes US air traffic using the aforementioned tool, utilizing actual airport-level data as of July 12, 2025. Our analysis will examine trends in different segments of air travel, such as domestic versus international flights and leisure versus business travel. To learn more about the specific airports chosen to represent these markets, please refer to this article.
U.S. Airport Traffic Overview
U.S. airport traffic in 2024 followed similar seasonal patterns. Passenger volumes remained below 2024 levels in mid-May and early June but rebounded in the latter half of June leading up to the July 4th holiday, as shown in Figure 1. Forecasts project a summer peak comparable to 2024, with daily passenger volumes expected to exceed 2.8 million both before the July 4th holiday and again in late July.
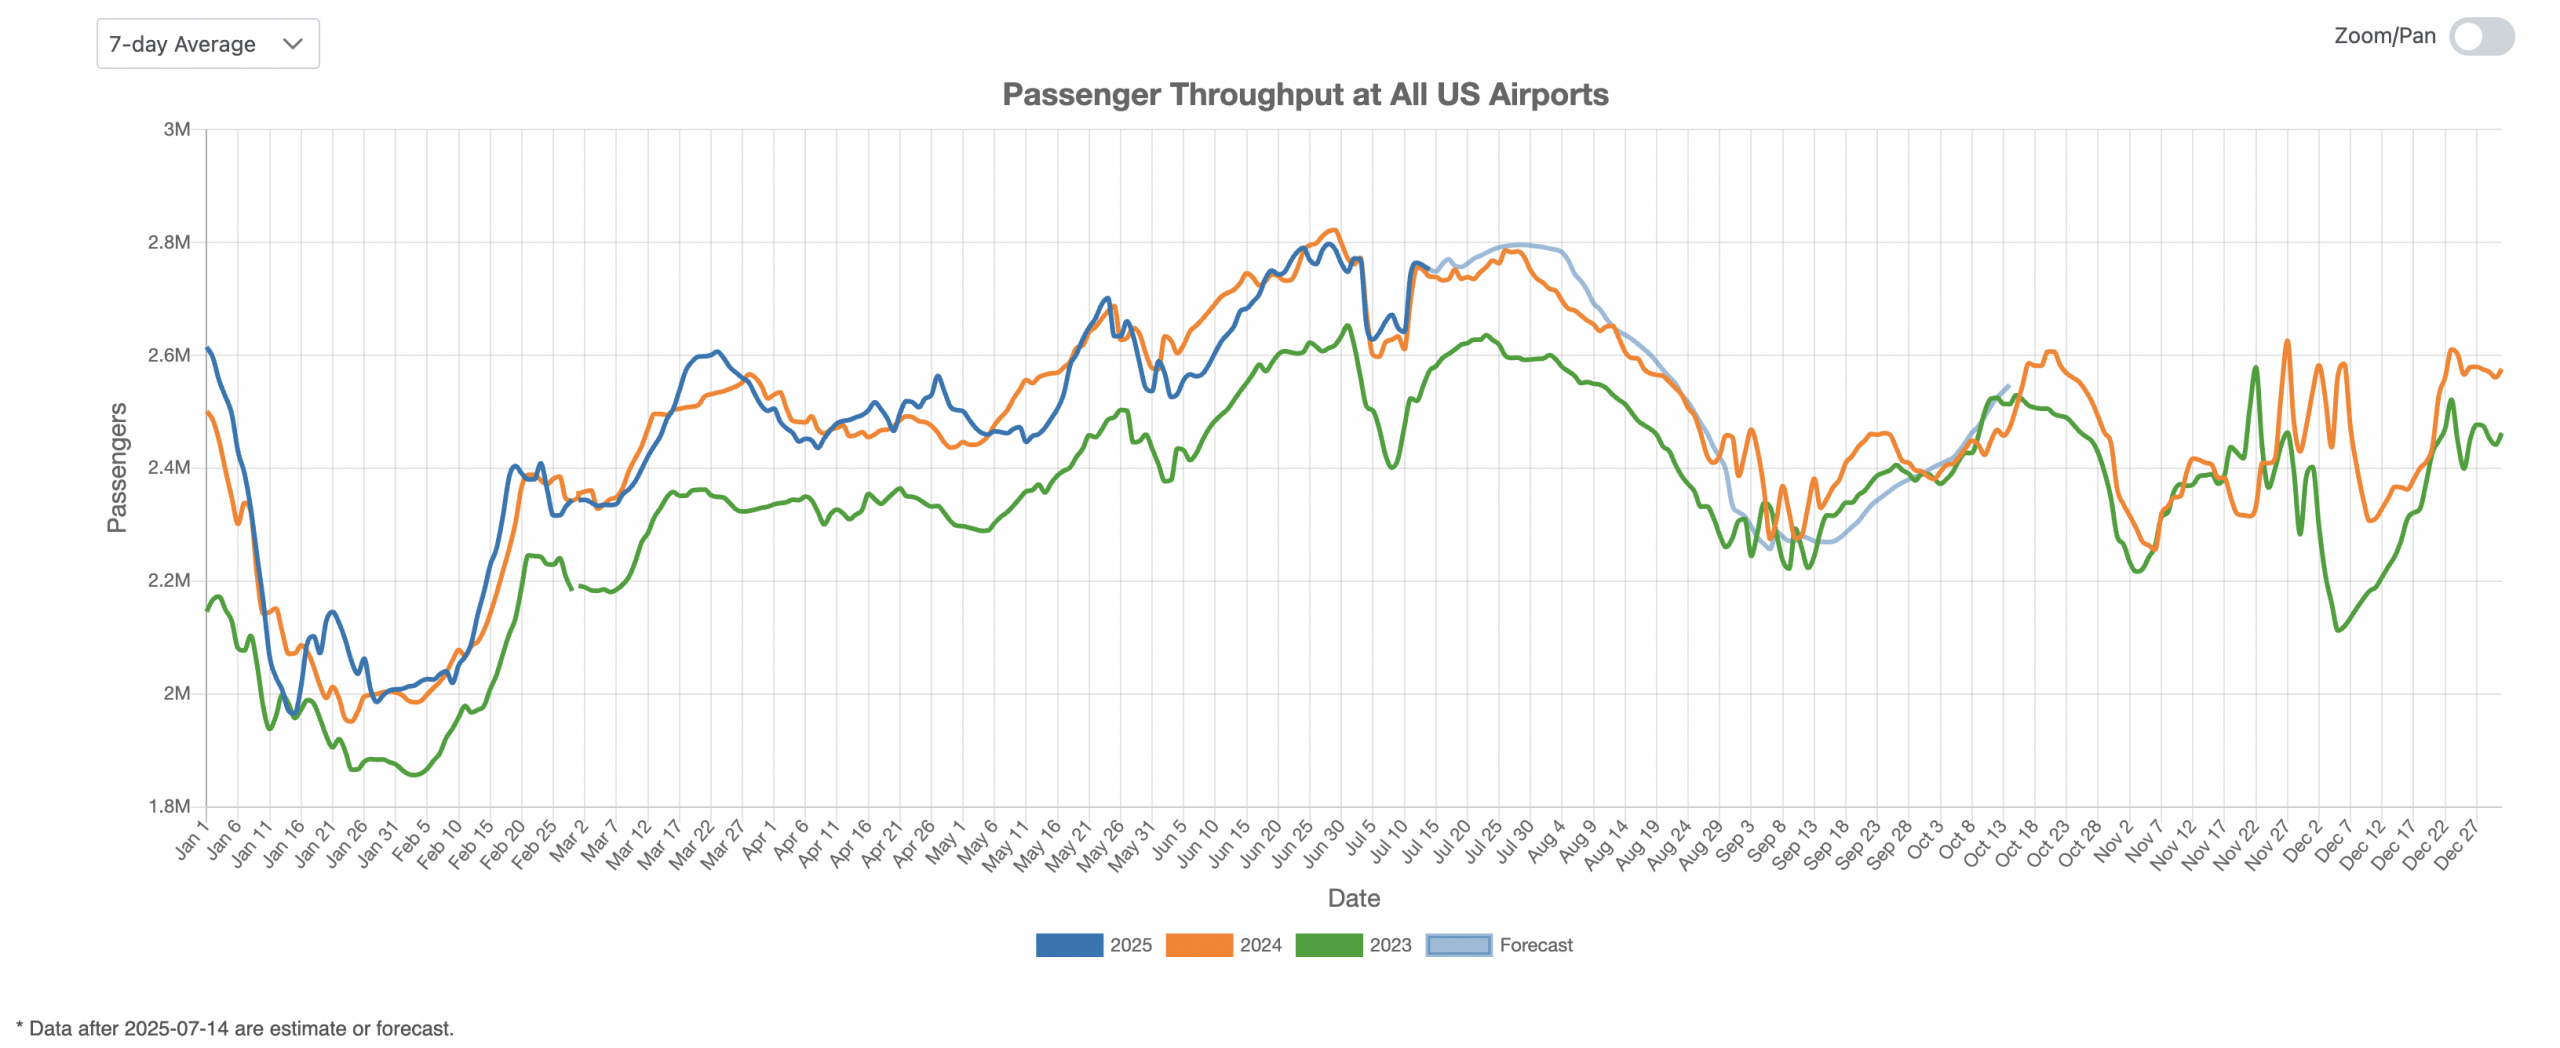
Figure 1: US Overall Air Traffic Trend
Domestic Airport Traffic Indicator
Figure 2 highlights domestic travel trends at major airports such as Charlotte (CLT), Denver (DEN), and Phoenix (PHX). Following a post–spring break slowdown, U.S. domestic air traffic rebounded by late May. Although there was another dip in early June, traffic began approaching 2024 levels again in late June and early July. Continued growth is expected to further narrow the gap—or even surpass—2024 levels in the coming months.
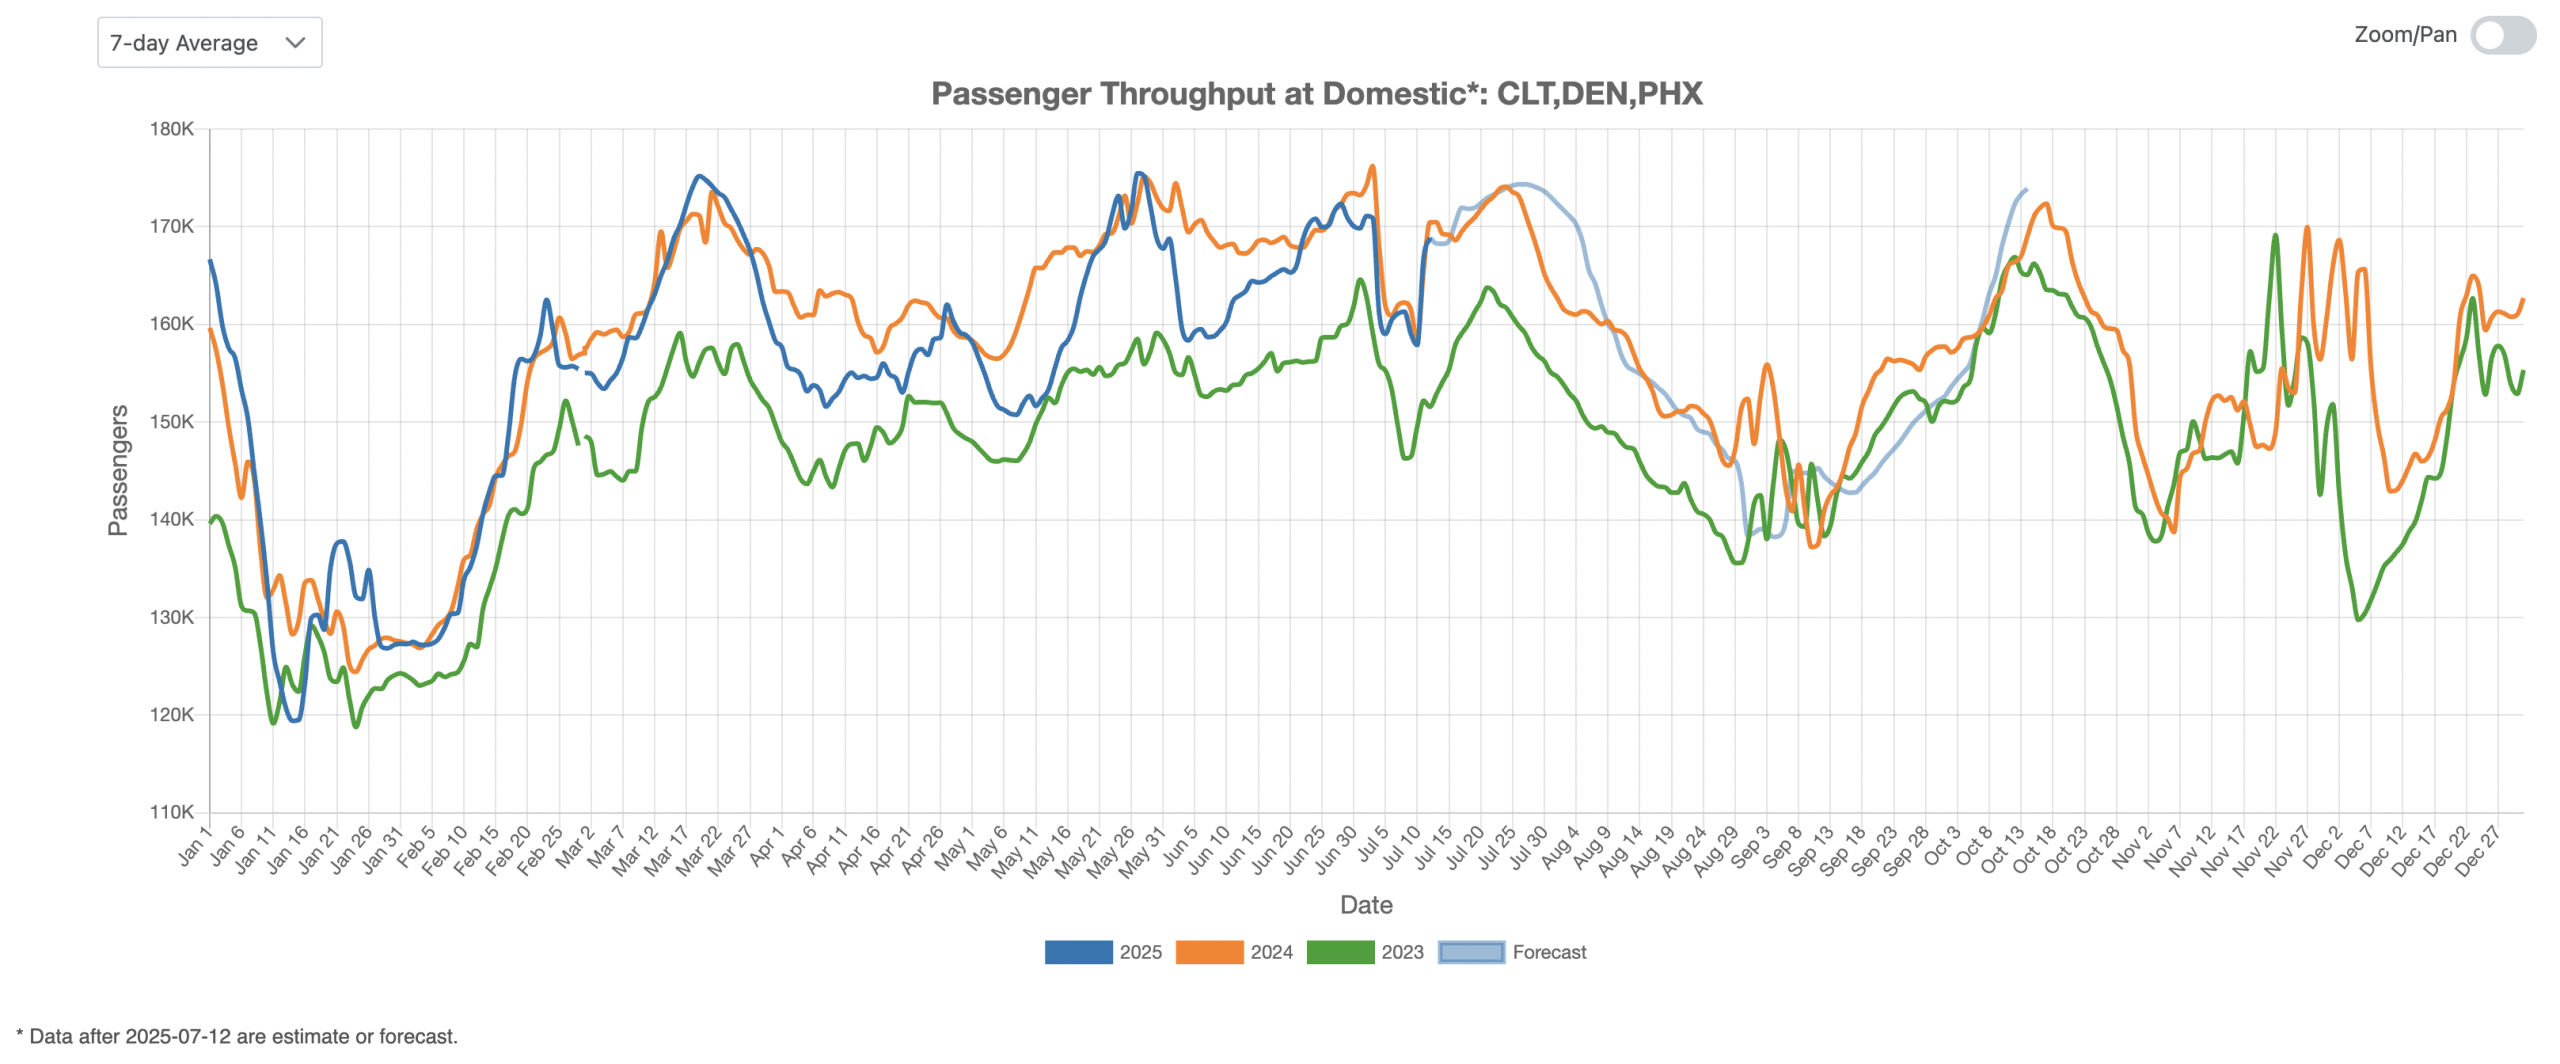
Figure 2: US Domestic Air Traffic Indicator
International Airport Traffic Indicator
Figure 3 illustrates fluctuations in passenger volumes at New York’s JFK Airport, a key international hub. International traffic rebounded in June, with 2025 volumes surpassing 2024 levels in early July. The outlook remains positive, with projections indicating steady growth throughout the summer.
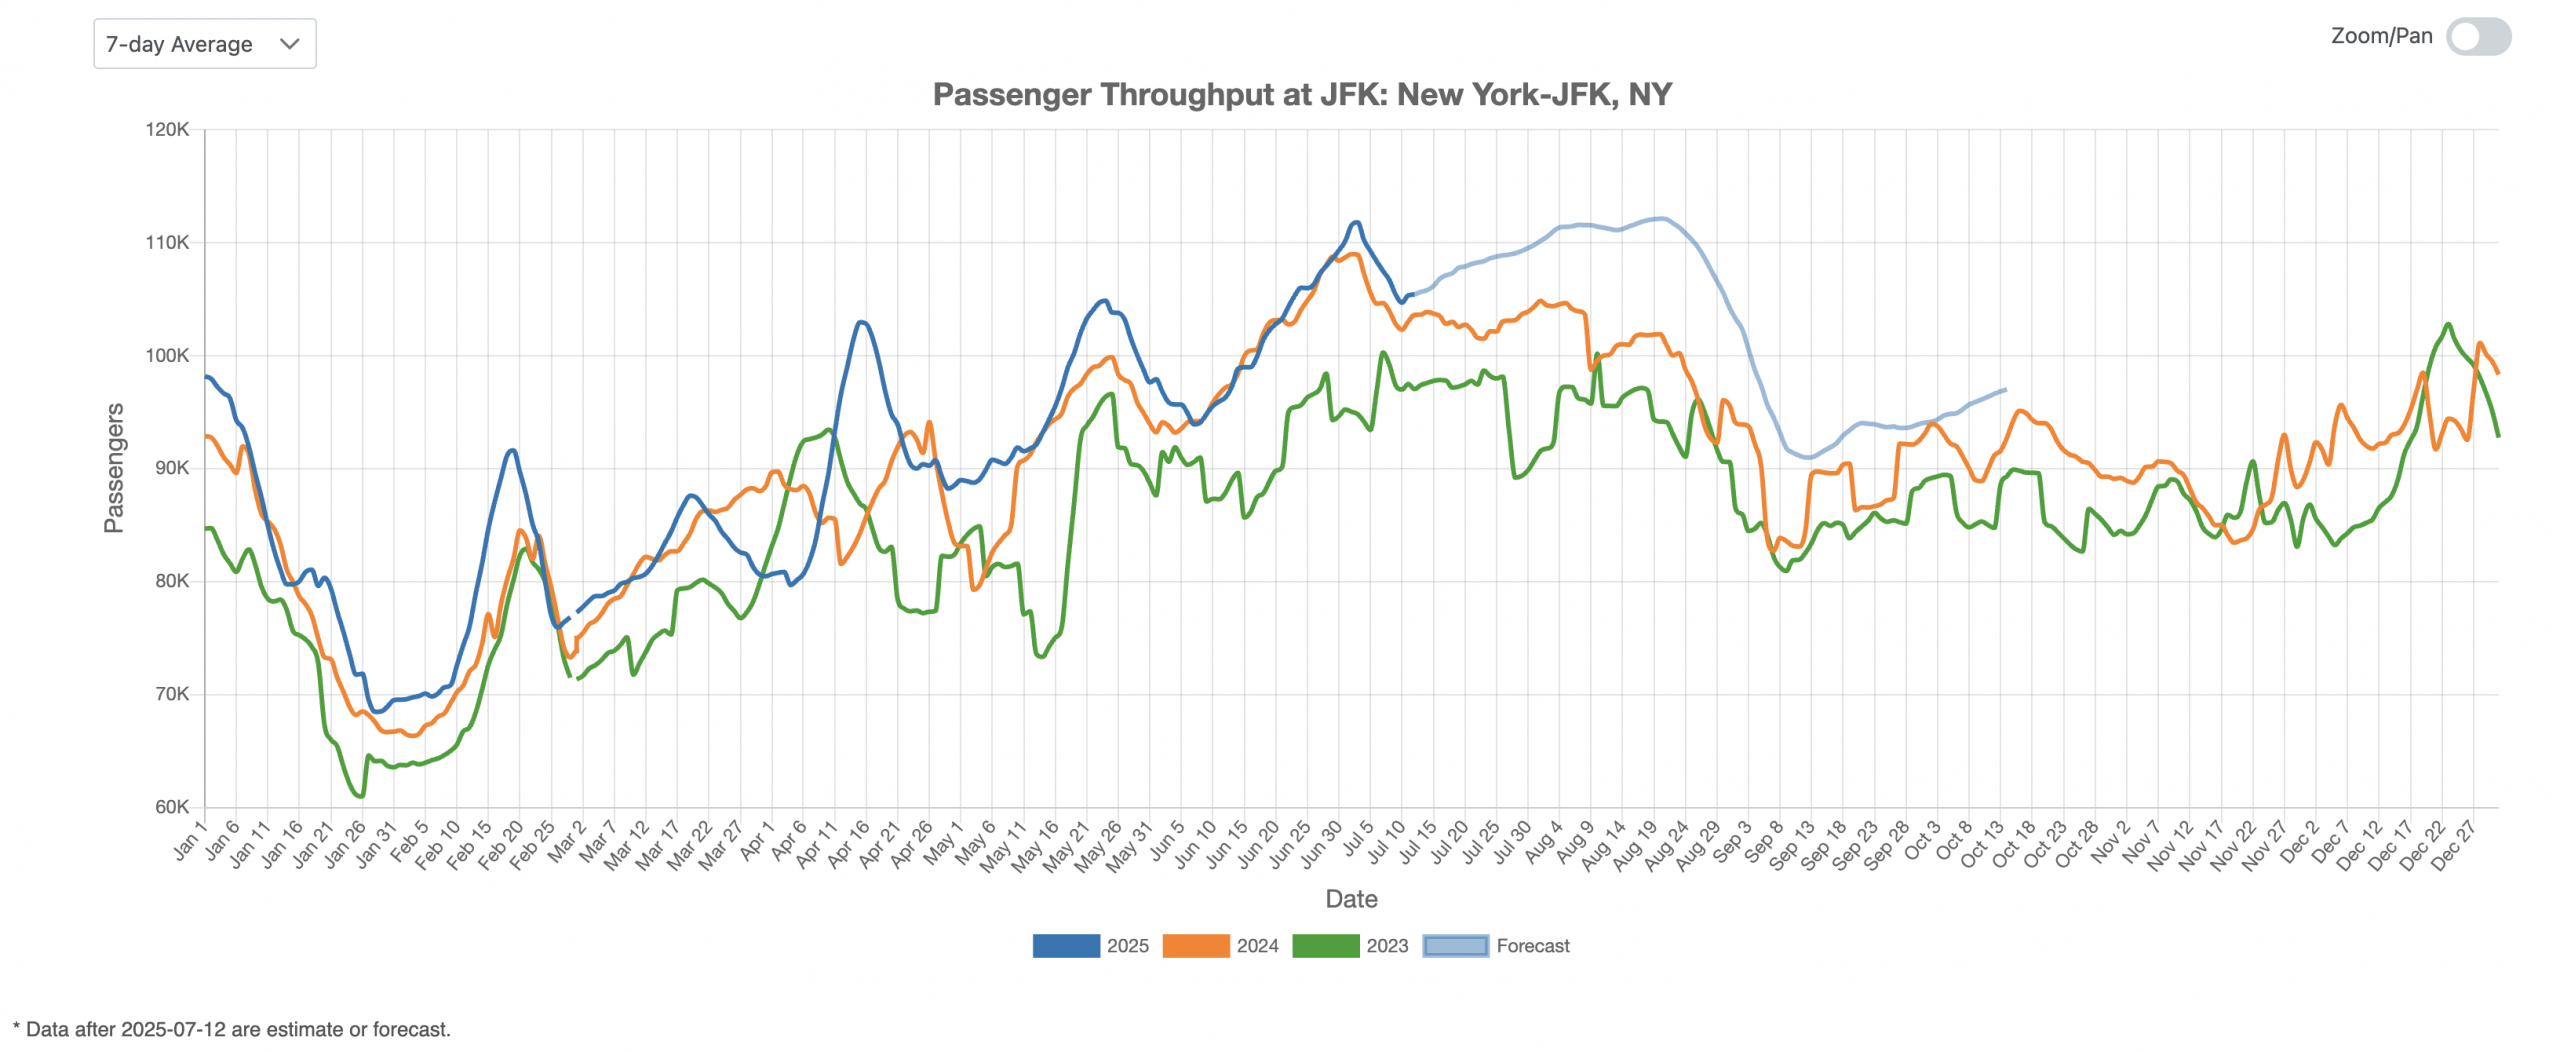
Figure 3: US International Air Traffic Indicator
Leisure Air Traffic Indicator
Figure 4 provides an overview of the U.S. leisure air travel market. As of June 2025, passenger volumes at primarily leisure-focused airports—such as Las Vegas (LAS) and Orlando (MCO)—remain below 2024 levels. However, forecasts indicate growth in July 2025, with traffic expected to rebound.
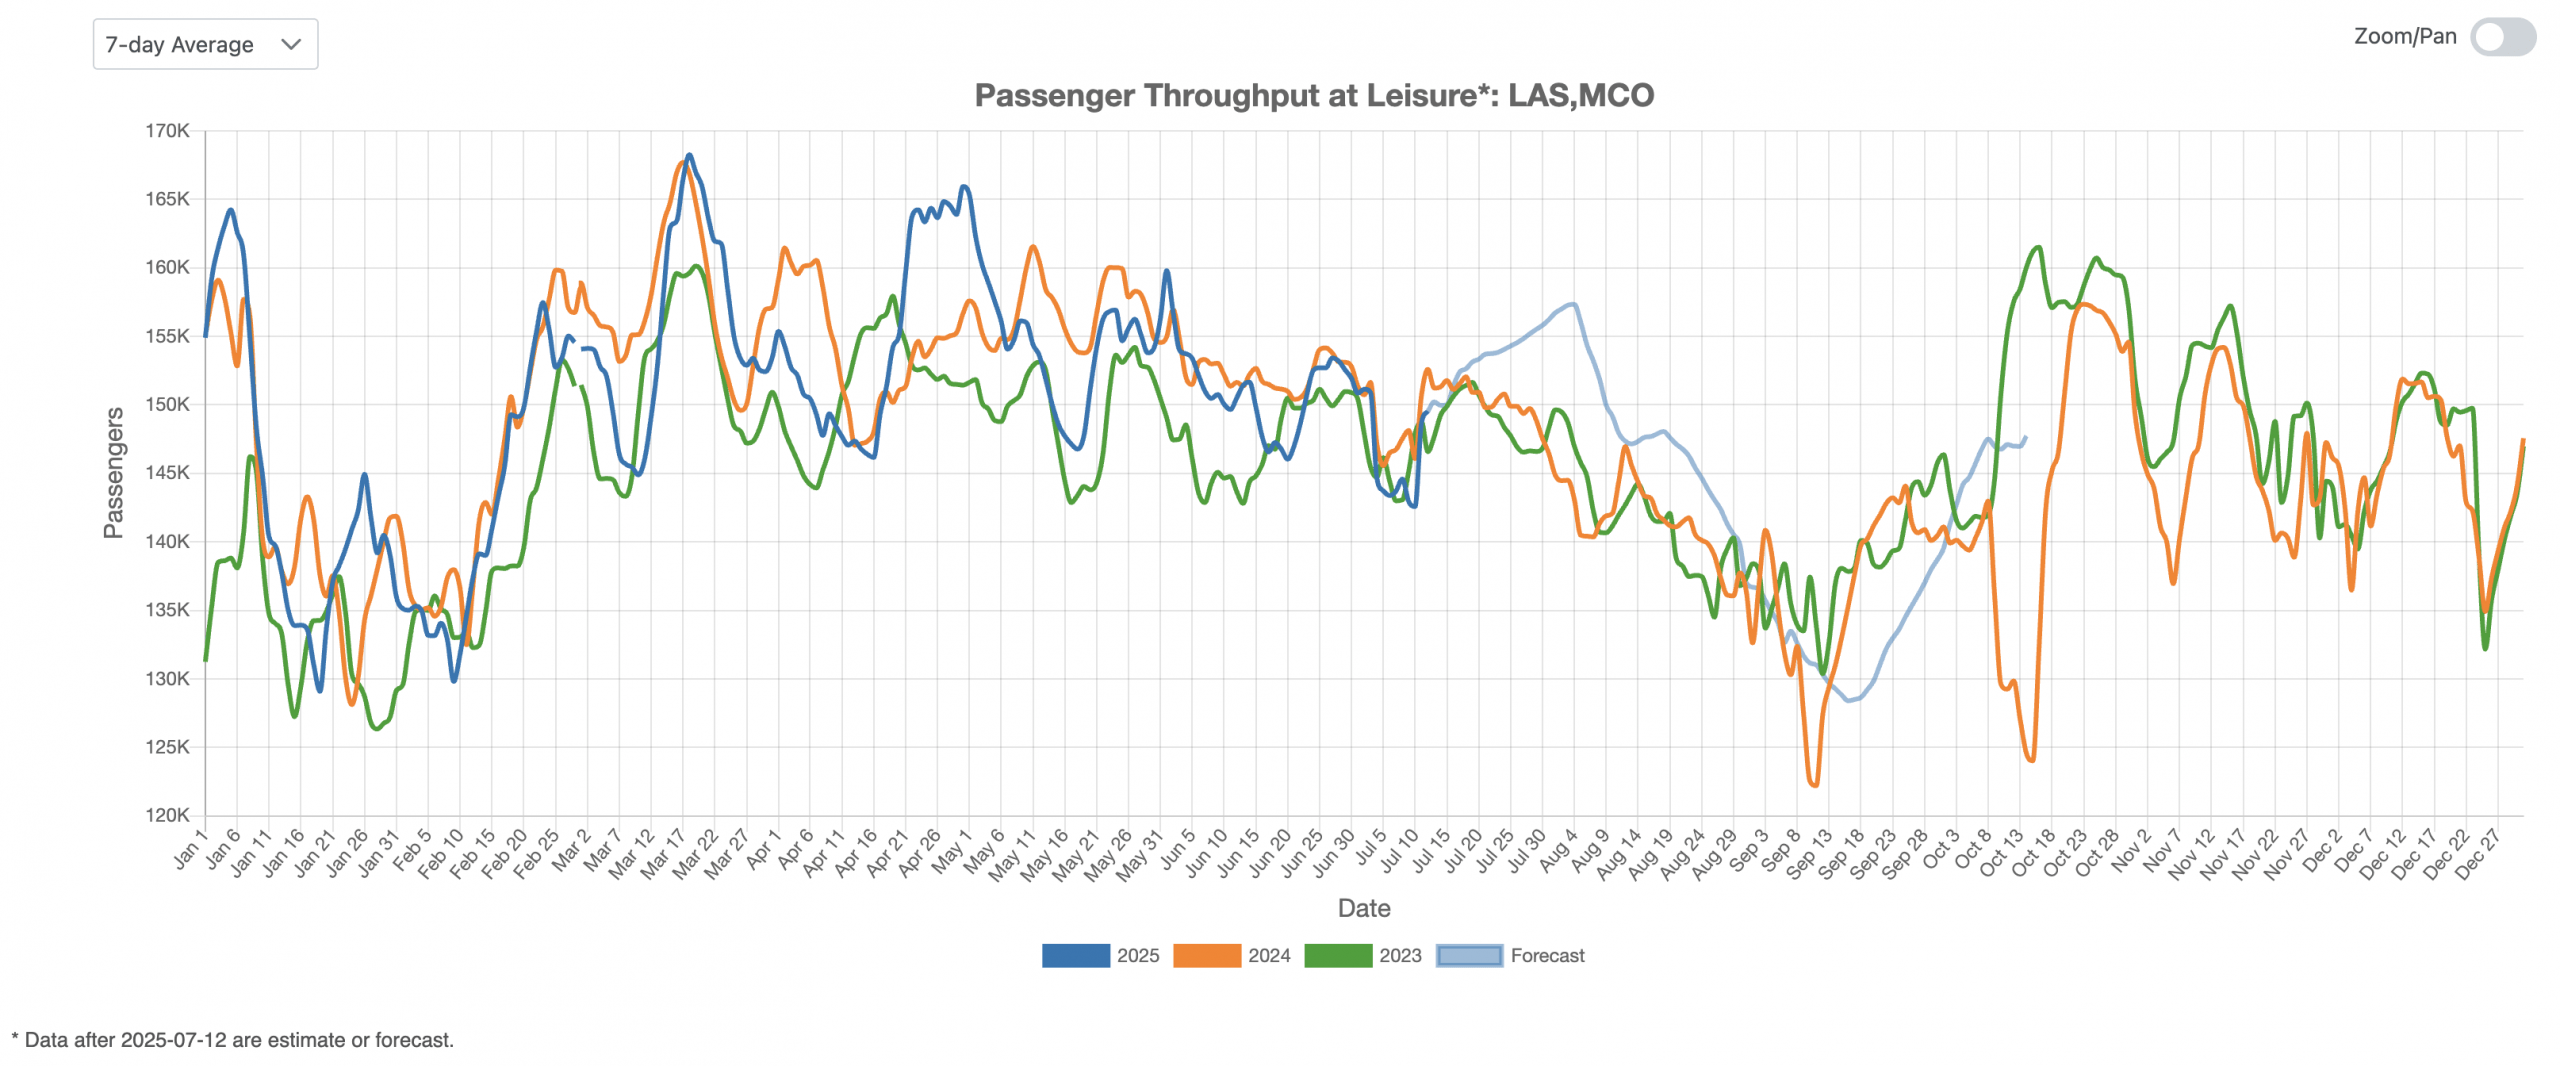
Figure 4: US Leisure Air Traffic Indicator
Business Air Traffic Indicator
Figure 5 highlights the upward trend in business travel, with June 2025 passenger volumes surpassing those of the same period in 2024. Following a brief slowdown after the July 4th holiday, projections indicate continued growth in the months ahead.
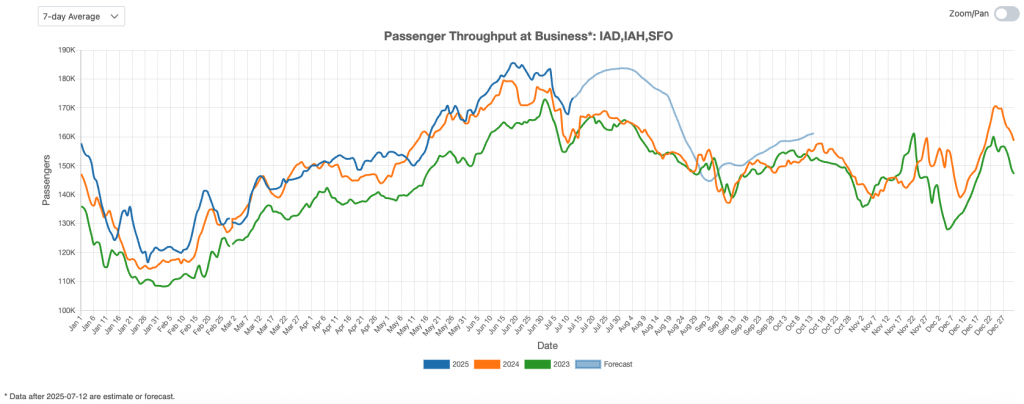
Figure 5: US Business Air Traffic Indicator
U.S. air travel in 2025 shows strong seasonal patterns, with domestic and international traffic rebounding in June and early July. Leisure travel lags slightly behind 2024, while business travel exceeds prior-year levels. Forecasts point to continued growth across segments through the rest of the summer.