Traffic and fare data by airline and route can provide valuable insights into market trends, demand, and competition. By analyzing this data, airlines can optimize their pricing strategies, plan their capacity, and make informed decisions about their route network. The data can also be used for market and competitive analysis, helping airlines identify profitable routes and gain a competitive advantage.
According to initial true O&D level data from FlightBI released this week, total U.S. domestic air travel declined in September 2025. International travel volumes also saw an slow-down. Additional, average airfares increased during the same period.
Volume Trend
In September 2025, U.S. domestic passenger traffic decreased to 50.9 million, down from 54.7 million in August and 3.5% higher than September 2024’s 49.2 million. International passenger volumes also dropped, decreasing from 24.5 million in August to 20.0 million in September.
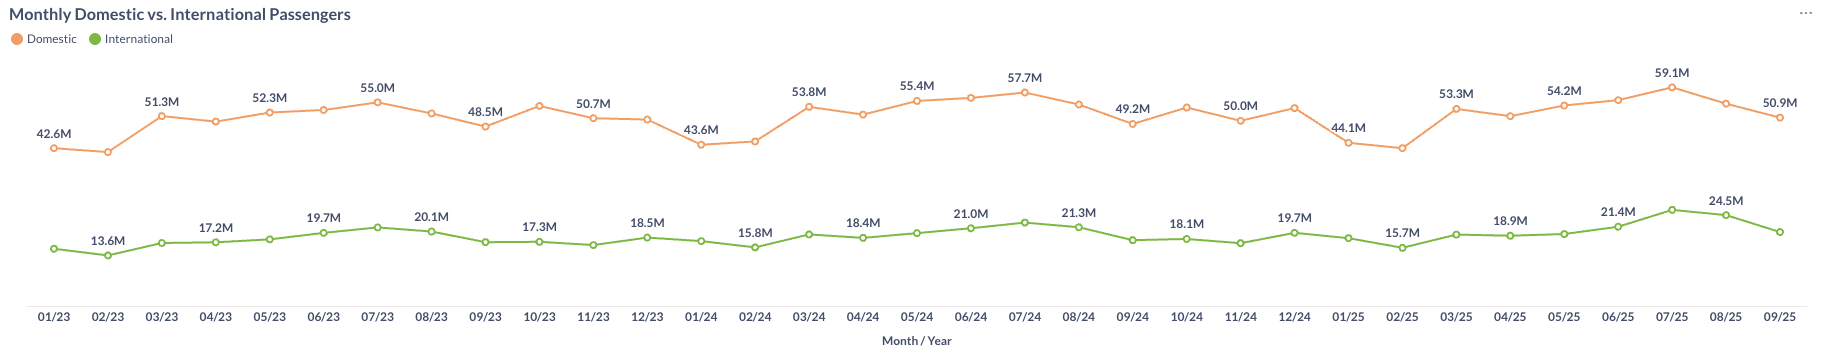
Figure 1: US Domestic and International Air Traffic by Month
Airfare Trend
Domestic airfares rose in September 2025, with the average gross fare increasing from $215 in August to $217, and the average net fare increasing from $184 to $186.
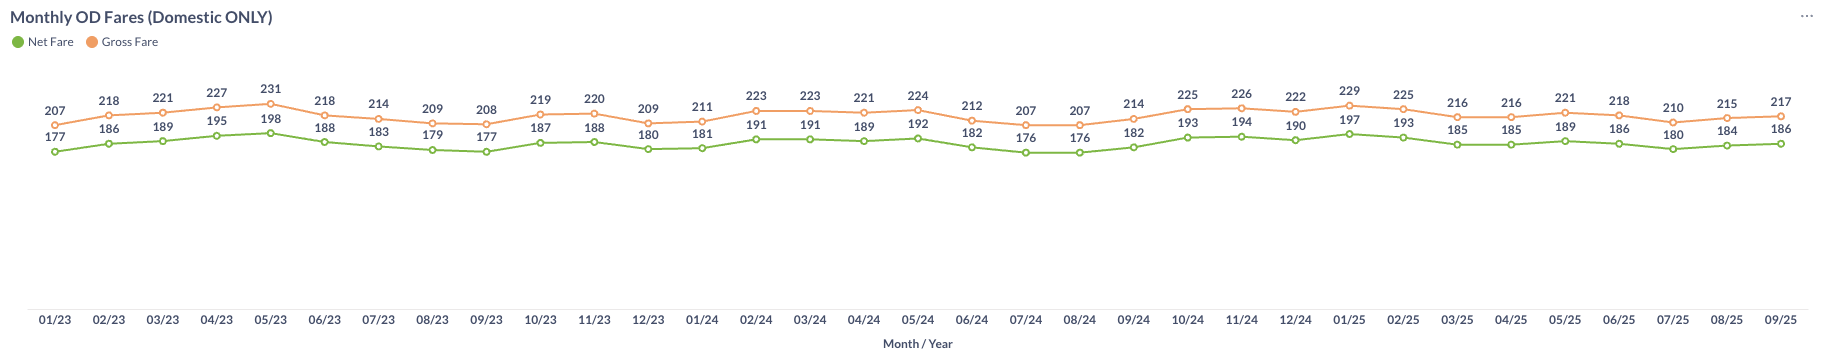
Figure 2: US Domestic Average Airfare by Month
Load Factor Trend
In September 2025, both Available Seat Miles (ASM) and Revenue Passenger Miles (RPM) declined month over month. The average load factor for major U.S. airlines decreased at 81.3%, which is below the 82.1% recorded in September 2024 (see Figure 3).
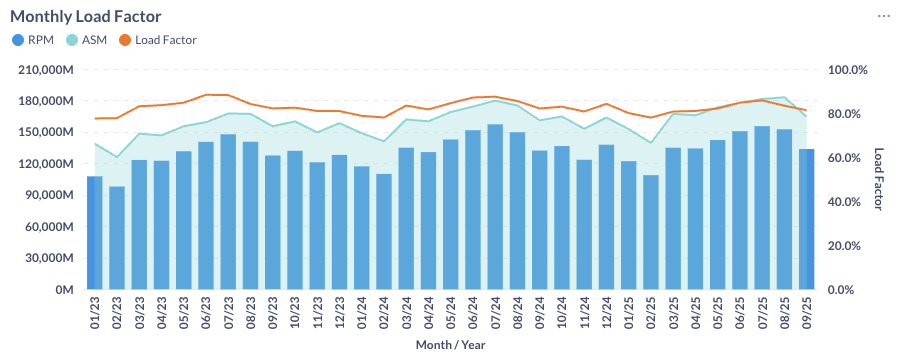
Figure 3: US Airlines’ Average Load Factor by Month
Month Over Month Comparison
In September 2025, most U.S. airlines recorded lower daily domestic traffic compared to August. Allegiant (G4) led the decline with a 32.2% decrease, followed by JetBlue (B6) and Spirit (NK) at 18.6% and 12.8%, respectively.
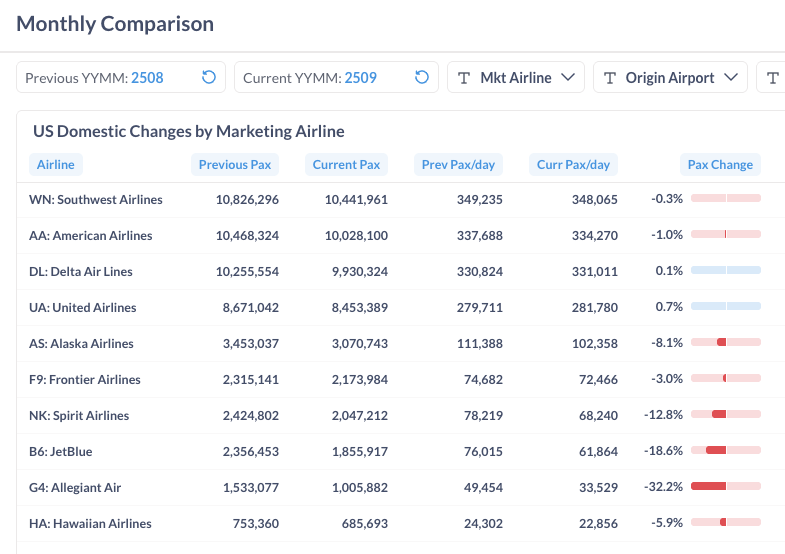
Figure 4: Domestic Air Traffic by Marketing Airlines in August 2025 (Previous) vs. September 2025 (Current)
Many airports reported passenger decline in September 2025. Orlando (MCO), Seattle (SEA) and Los Angeles (LAX) led a decline of 13.1%, 9.4%, and 8.6%, respectively. However, Las Vegas (LAS), Phoenix (PHX) and Houston (IAH) saw a growth of 14.9%, 9.5% and 6.8%.
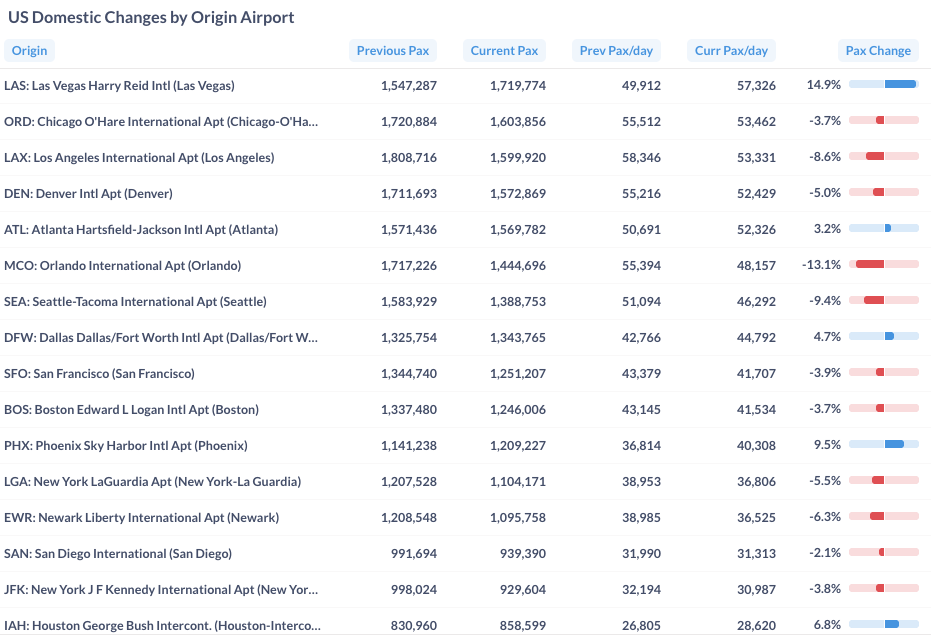
Figure 5: Domestic Air Traffic by Top Airports in August 2025 (Previous) vs. September 2025 (Current)
Year Over Year Comparison
From September 2024 to September 2025, most airlines posted year-over-year growth, led by three big legacy carriers – United (UA), American (AA) and Delta (DL) at 12.5%, 5.4% and 5.1%. In contrast, Spirit Airlines (NK) continued its decline with traffic down 21.0%. JetBlue (B6) and Frontier (F9) also experienced a decline at 6.4% and 3.4%.
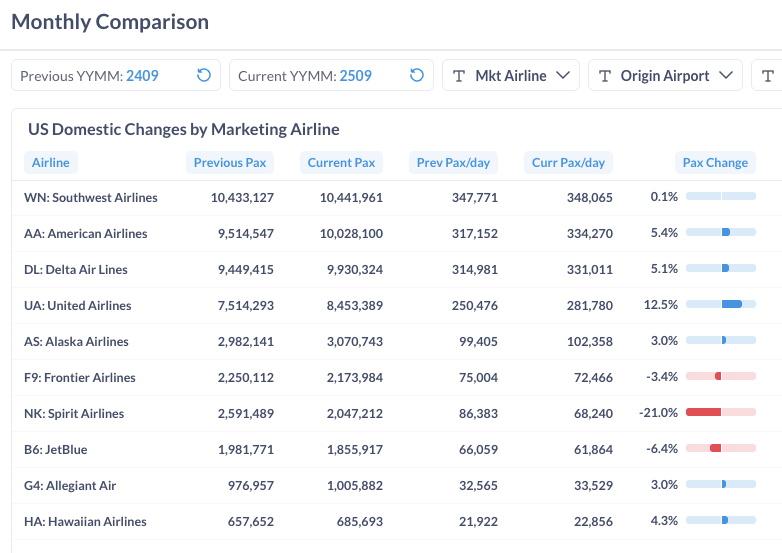
Figure 6: Domestic Air Traffic by Marketing Airlines in September 2025 (Current) vs. September 2024 (Previous)
From September 2024 to September 2025, more major U.S. airports experienced an increase in domestic traffic than a decline. John F. Kennedy International Airport (JFK), San Francisco (SFO) and Dallas (DFW) led with a growth of 12.2%, 10.4% and 8.7%, respectively, while Denver (DEN) and Los Angeles (LAX) posted a decline of 6.9% and 5.5%.
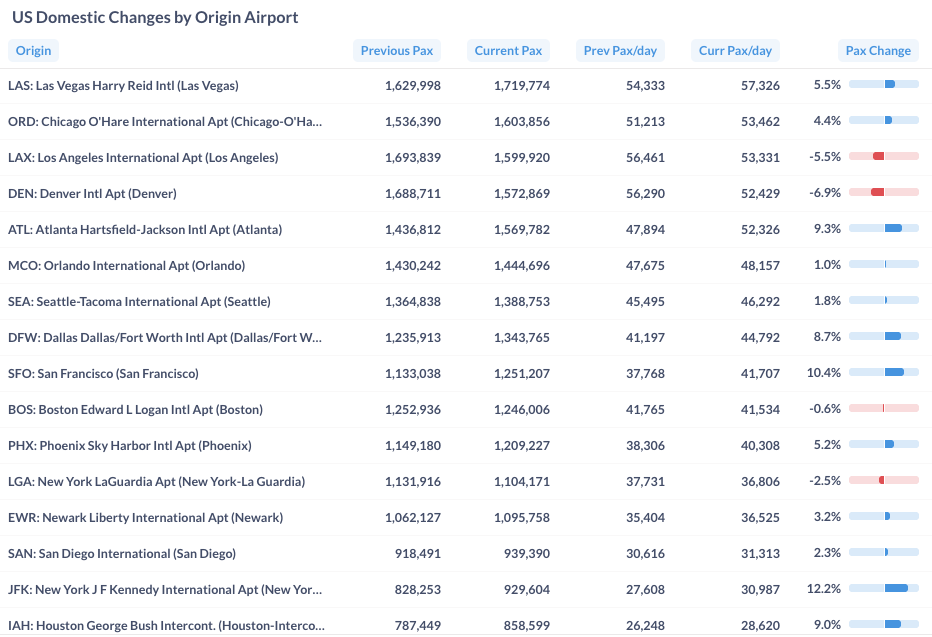
Figure 7: Domestic Air Traffic by Top Origin Airport in September 2025 (Current) vs. September 2024 (Previous)
For more detailed information on traffic and fares by route and airline, please contact service@flightbi.com or request a demo of Fligence USOD. They will be able to provide you with customized information to meet your specific needs and requirements.