Traffic and fare data by airline and route can provide valuable insights into market trends, demand, and competition. By analyzing this data, airlines can optimize their pricing strategies, plan their capacity, and make informed decisions about their route network. The data can also be used for market and competitive analysis, helping airlines identify profitable routes and gain a competitive advantage.
Based on initial true O&D level data from FlightBI released this week, total US domestic air travel saw an increase in May 2024 compared to the previous month. Similarly, US international air travel also experienced growth. Additionally, average airfares showed no change during this period.
Volume Trend
In May 2024, domestic passenger numbers rose from 52.1 million in April to 56.5 million, marking a 9.6% increase compared to May 2023, which had 51.6 million passengers. Meanwhile, the international sector also grew, with passenger numbers increasing from 20.4 million in April to 22.0 million in May 2024.
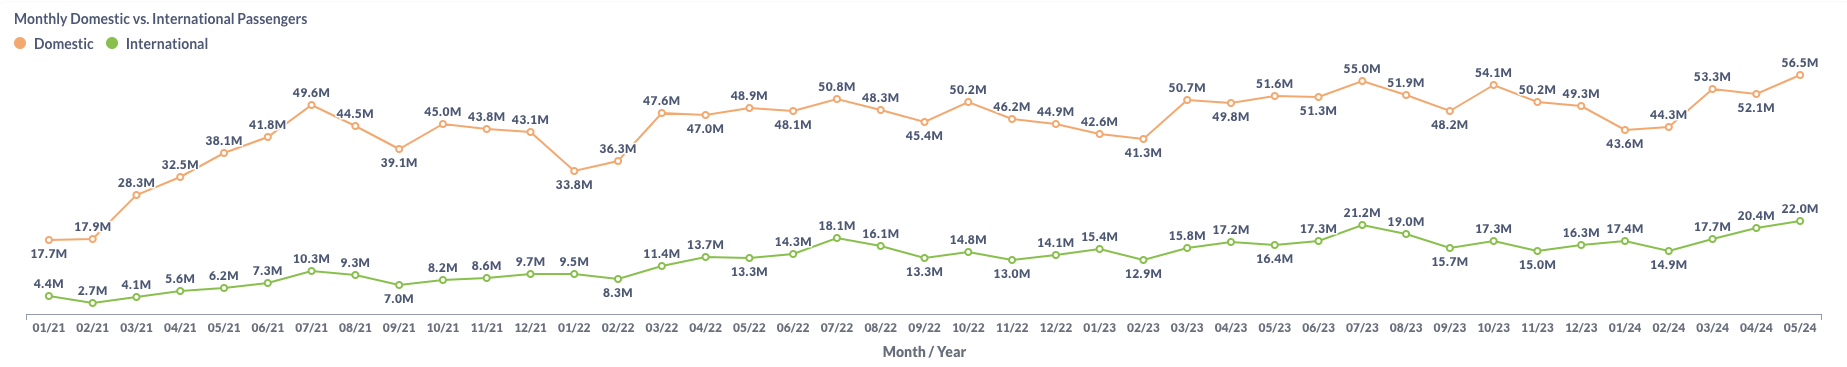
Figure 1: US Domestic and International Air Traffic by Month
Airfare Trend
The latest data indicates stable airfare trends, with the average gross fare for flights holding steady at $223 in May. Similarly, the average net fare remained unchanged at $191 during the same period.
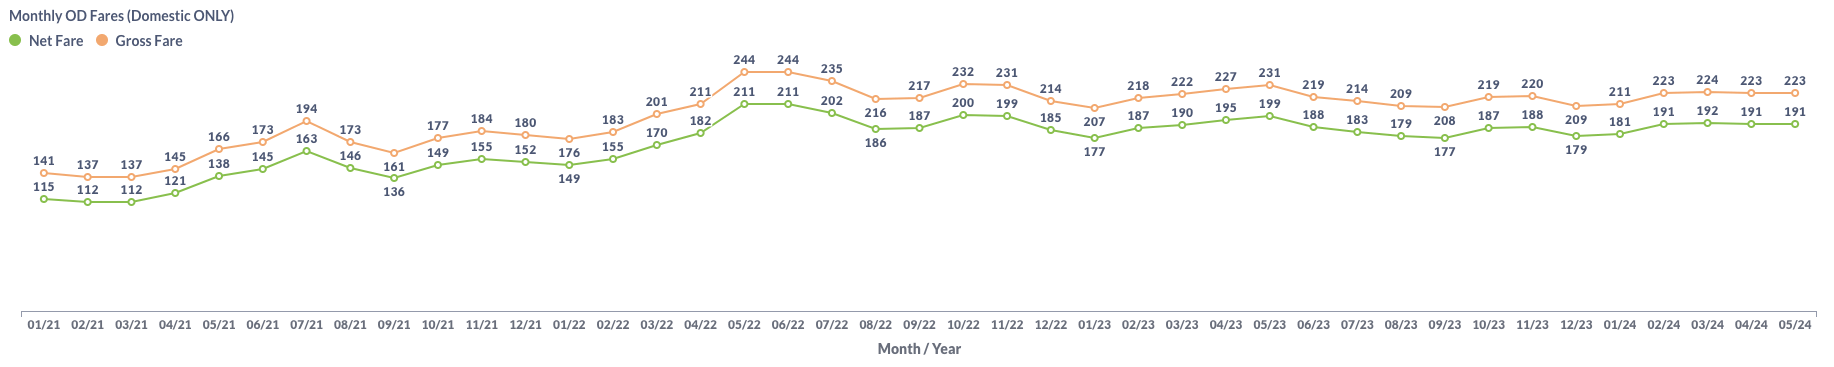
Figure 2: US Domestic Average Airfare by Month
Load Factor Trend
In May 2024, both Available Seat Miles (ASM) and Revenue Passenger Miles (RPM) increased compared to the previous month. This resulted in a rebound in the average load factor for major US airlines, rising from 80.6% in April to 83.7% in May, as shown in Figure 3. However, the average load factor remains below the 84.7% recorded in May 2023.
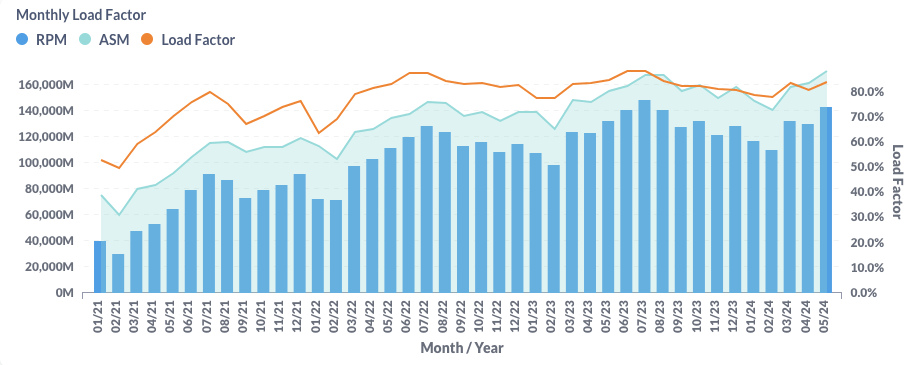
Figure 3: US Airlines’ Average Load Factor by Month
Month Over Month Comparison
In May 2024, all major US airlines except JetBlue (B6) saw an increase in daily traffic compared to April 2024. Notably, two Ultra Low Cost Carriers – Frontier (F9) and Spirit (NK) – led the increase with 15.4% and 9.7%, respectively.
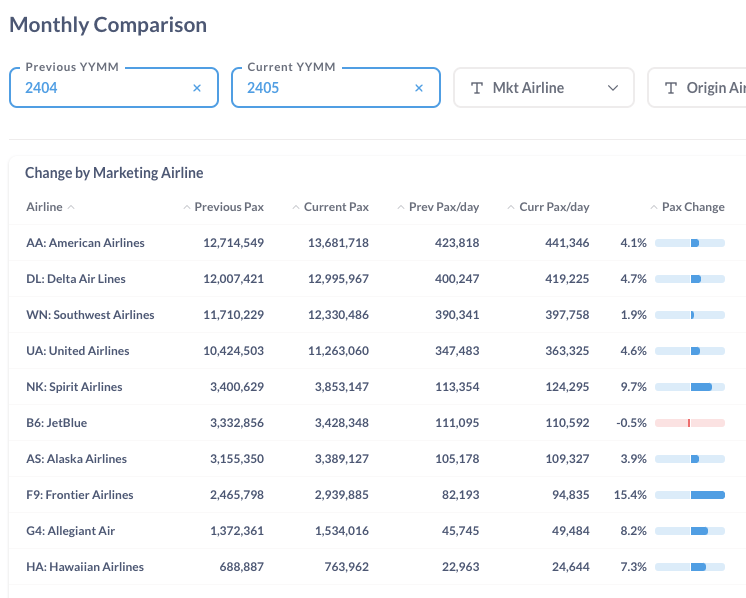
Figure 4: Air Traffic by Dominant Marketing Airlines in April 2024 (Previous) vs. May 2024 (Current)
During that period, traffic increased at most major airports. Chicago (ORD), Atlanta (ATL), and Dallas (DFW) led with month-to-month growth rates of 15.7%, 13.8%, and 13.6%, respectively. However, Ft. Lauderdale (FLL), Phoenix (PHX), and Orlando (MCO) experienced some slowdown compared to the previous month.
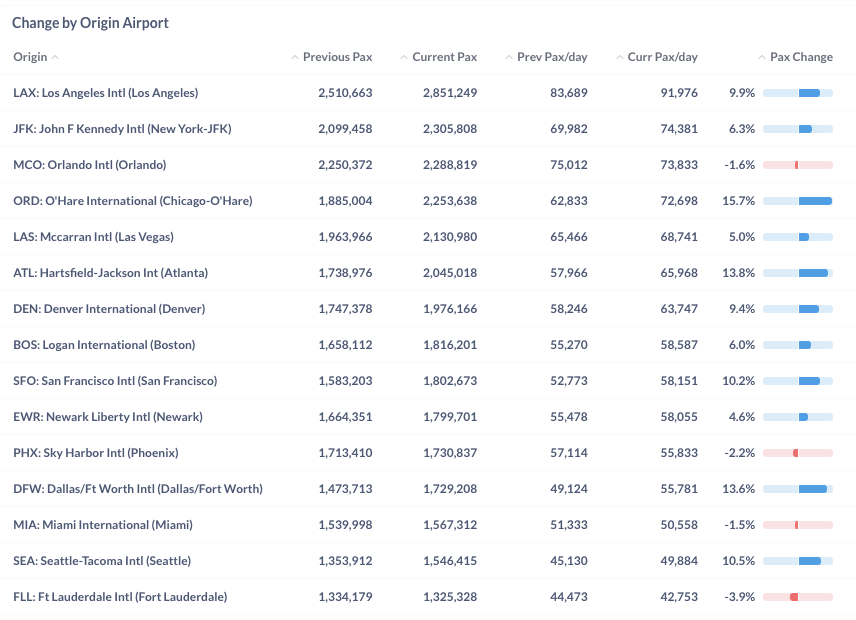
Figure 5: Air Traffic by Top Origin Airports in April 2024 (Previous) vs. May 2024 (Current)
Year Over Year Comparison
Comparing May 2023 to May 2024, all major US airlines showed growth. Frontier (F9), Spirit (NK), and American (AA) led this upward trend with growth rates of 39.8%, 17.6%, and 13.0%, respectively, underscoring their significant contributions to the industry’s positive momentum.
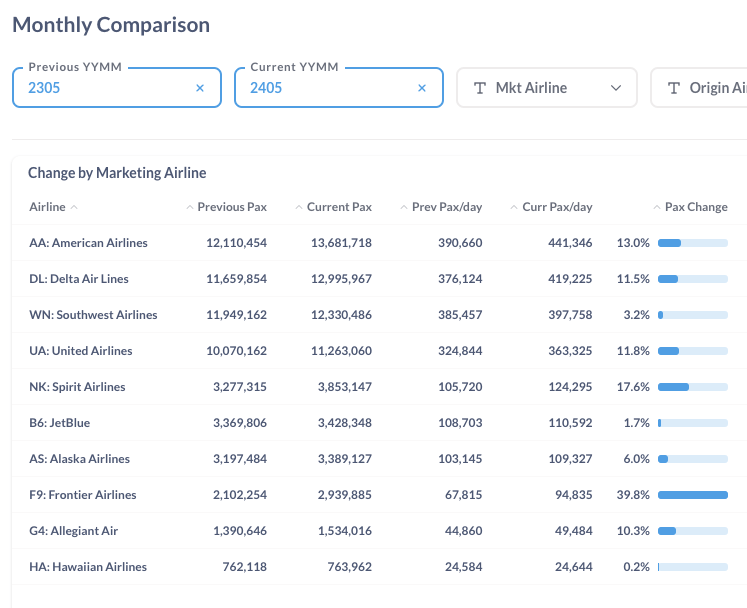
Figure 6: Air Traffic by Dominant Marketing Airlines in May 2024 (Current) vs. May 2023 (Previous)
From May 2023 to May 2024, all major airports saw increased traffic. Miami (MIA), Chicago (ORD), and Boston (BOS) led this year-over-year growth with substantial expansions, showing traffic increases of 22.8%, 21.1%, and 18.3%, respectively.
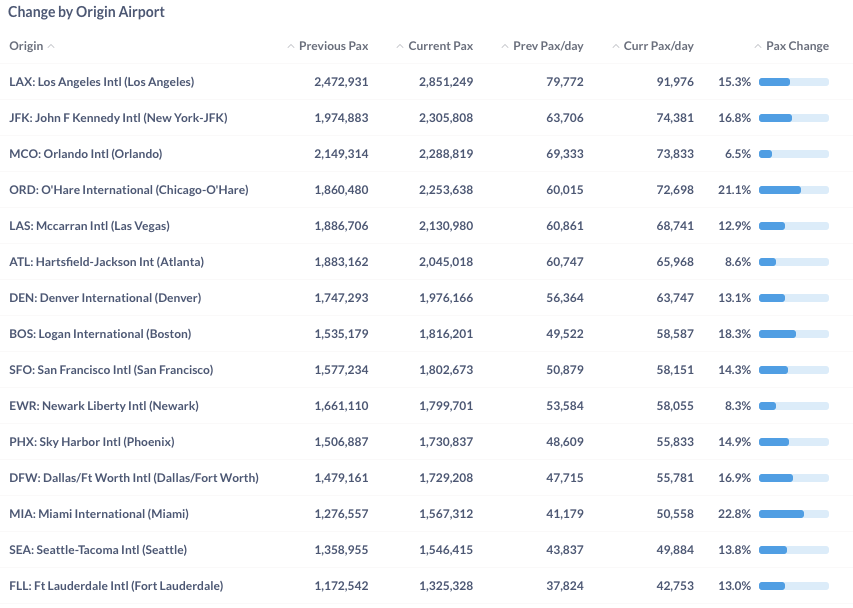
Figure 7: Air Traffic by Top Origin Airport in May 2024 (Current) vs. May 2023 (Previous)
For more detailed information on traffic and fares by route and airline, please contact service@flightbi.com or request a demo of Fligence USOD. They will be able to provide you with customized information to meet your specific needs and requirements.