Traffic and fare data by airline and route can provide valuable insights into market trends, demand, and competition. By analyzing this data, airlines can optimize their pricing strategies, plan their capacity, and make informed decisions about their route network. The data can also be used for market and competitive analysis, helping airlines identify profitable routes and gain a competitive advantage.
According to initial true O&D level data from FlightBI released this week, total U.S. domestic air travel rose again in July 2025. International travel volumes also saw an uptick. Additional, average airfares declined during the same period.
Volume Trend
In July 2025, U.S. domestic passenger traffic reached 60.0 million, up from 57.8 million in June and 4.0% higher than July 2024’s 57.7 million. International passenger volumes also rose, increasing from 24.1 million in June to 25.9 million in July.
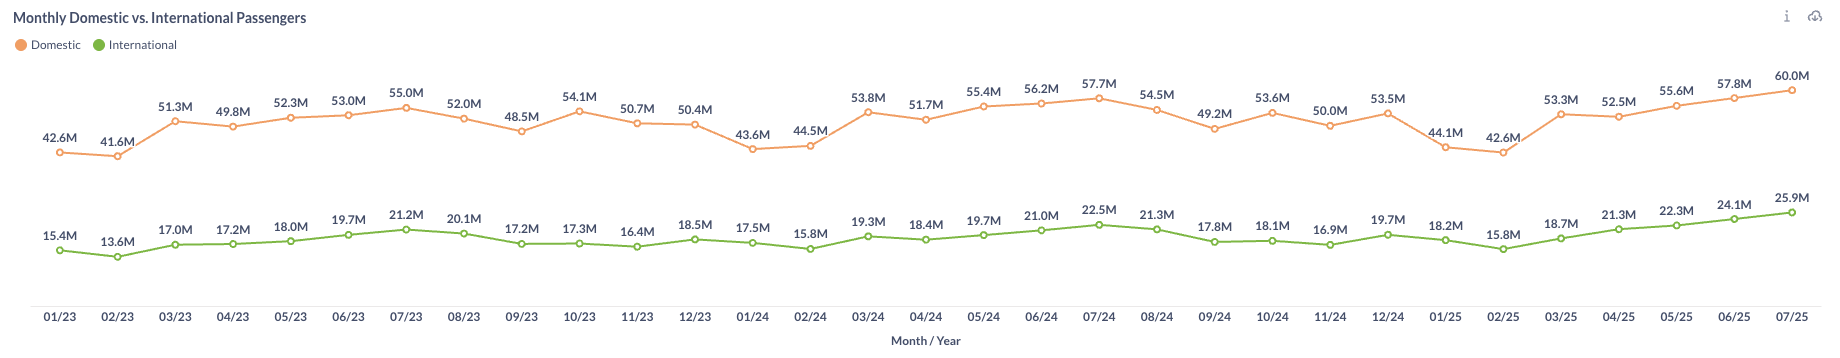
Figure 1: US Domestic and International Air Traffic by Month
Airfare Trend
Airfares declined in July 2025, with the average gross fare dropping from $221 in June to $214, and the average net fare falling from $190 to $184.
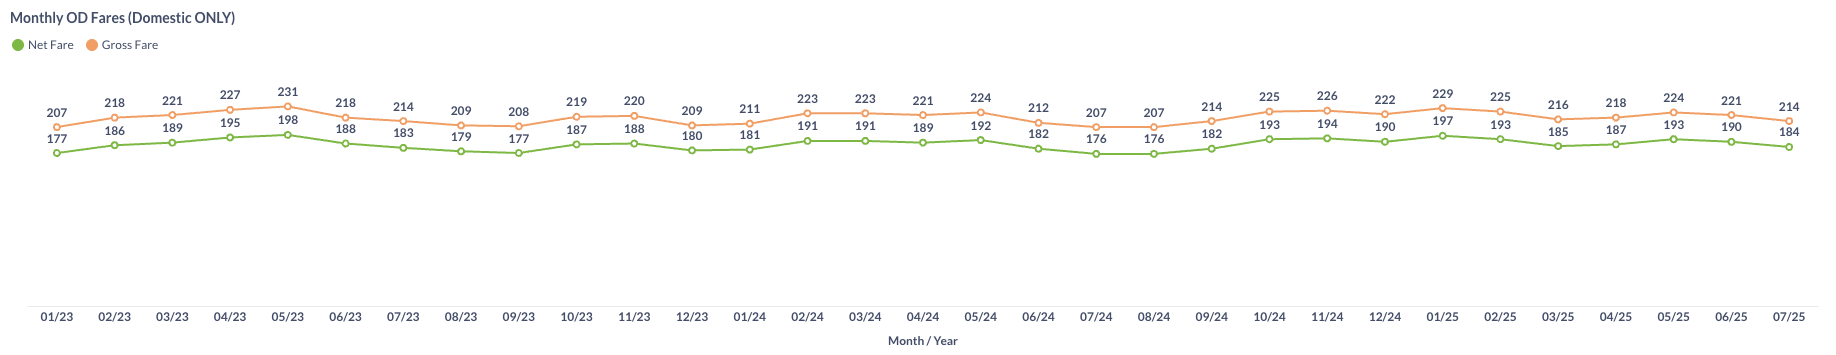
Figure 2: US Domestic Average Airfare by Month
Load Factor Trend
In July 2025, both Available Seat Miles (ASM) and Revenue Passenger Miles (RPM) rose month over month. The average load factor for major U.S. airlines inched up from 84.1% to 84.4%, though it remained below the 87.4% recorded in July 2024 (see Figure 3).
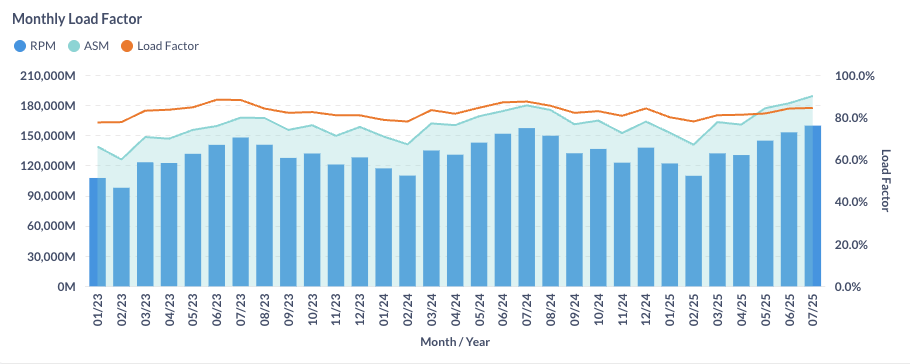
Figure 3: US Airlines’ Average Load Factor by Month
Month Over Month Comparison
In July 2025, many U.S. airlines recorded higher daily domestic traffic compared to June. JetBlue (B6) led the growth with a 6.7% increase, followed by Hawaiian Airlines (HA) at 4.7%. In contrast, Spirit Airlines (NK) saw a 3.8% decline, driven by flight and pilot reductions as well as underperforming routes.
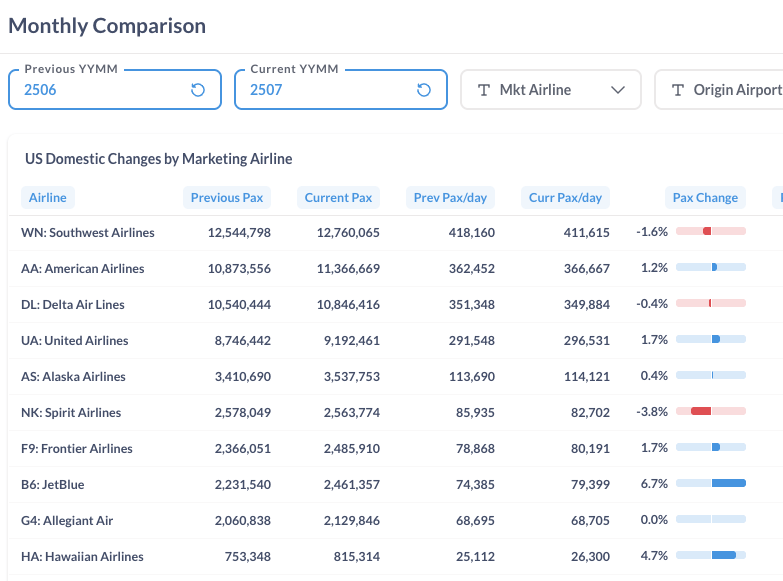
Figure 4: Domestic Air Traffic by Marketing Airlines in June 2025 (Previous) vs. July 2025 (Current)
Many major airports reported passenger growth in July 2025. Newark (EWR) led with a 12.8% increase, driven by the mid-June adjustment to its restrictive cap, which was raised from 56 to 68 movements per hour. Minneapolis–St. Paul (MSP) also posted a strong 9.2% gain. In contrast, Phoenix (PHX), Atlanta (ATL), and San Francisco (SFO) saw declines of 8.2%, 7.9%, and 7.3%, respectively.
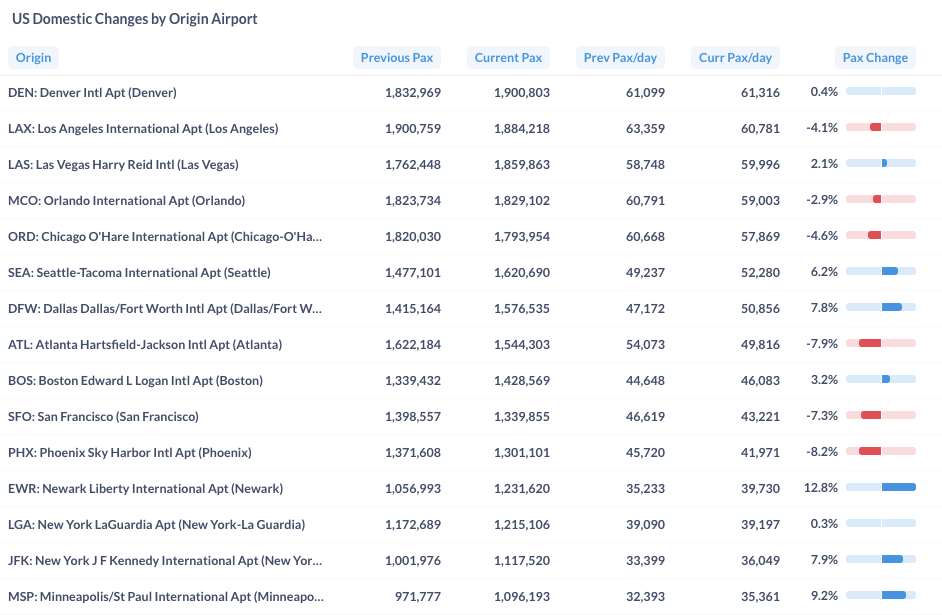
Figure 5: Domestic Air Traffic by Top Airports in June 2025 (Previous) vs. July 2025 (Current)
Year Over Year Comparison
From July 2024 to July 2025, several airlines posted year-over-year growth, led by United Airlines (UA) at 12.6% and Allegiant Air (G4) at 11.8%. In contrast, Spirit Airlines (NK) continued its decline with traffic down 25.4%, while Frontier Airlines (F9) also recorded a year-over-year drop in daily traffic.
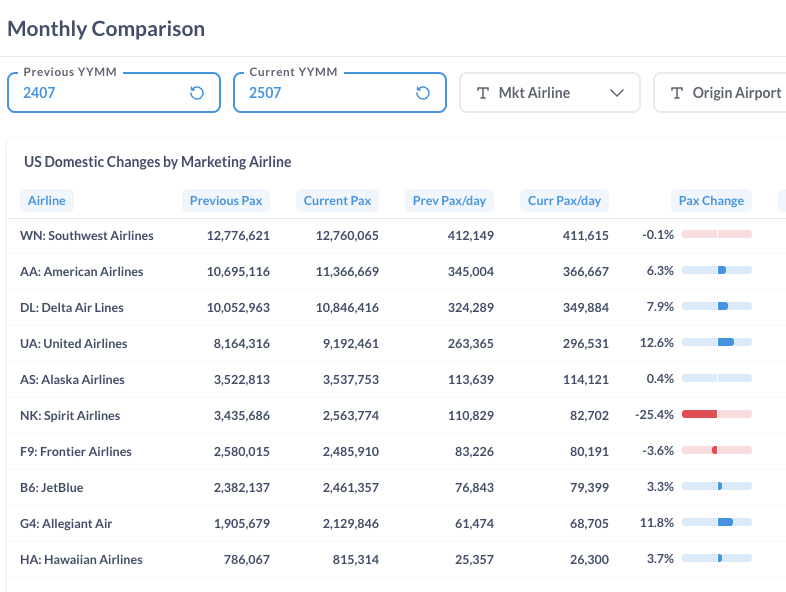
Figure 6: Domestic Air Traffic by Marketing Airlines in July 2025 (Current) vs. July 2024 (Previous)
From July 2024 to July 2025, more major U.S. airports experienced increases in domestic traffic than declines. John F. Kennedy International Airport (JFK) and Dallas/Fort Worth International Airport (DFW) led with growth of 16.1% and 10.4%, respectively, while LaGuardia Airport (LGA) and Los Angeles International Airport (LAX) posted declines of 6.9% and 4.8%.
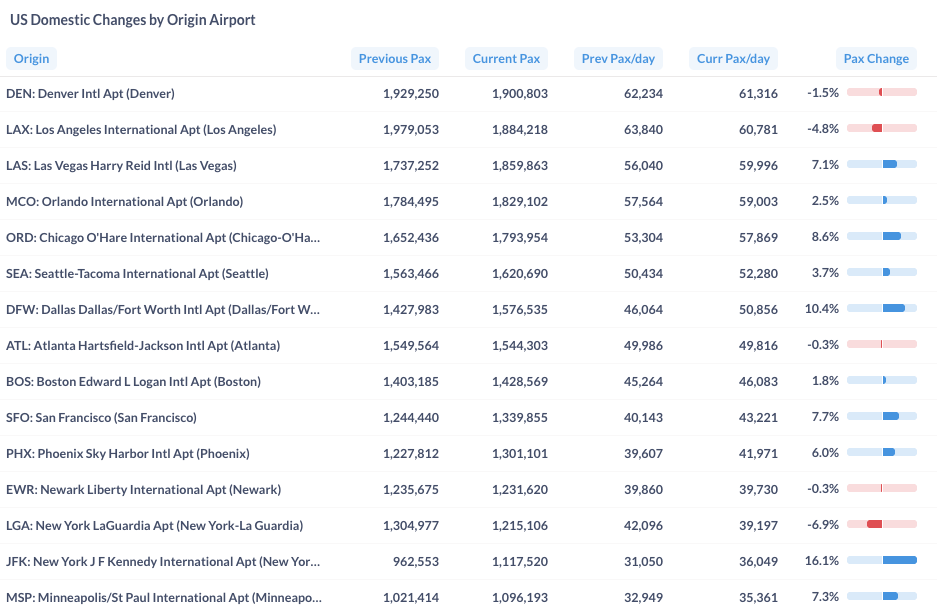
Figure 7: Domestic Air Traffic by Top Origin Airport in July 2025 (Current) vs. July 2024 (Previous)
For more detailed information on traffic and fares by route and airline, please contact service@flightbi.com or request a demo of Fligence USOD. They will be able to provide you with customized information to meet your specific needs and requirements.