Traffic and fare data by airline and route can provide valuable insights into market trends, demand, and competition. By analyzing this data, airlines can optimize their pricing strategies, plan their capacity, and make informed decisions about their route network. The data can also be used for market and competitive analysis, helping airlines identify profitable routes and gain a competitive advantage.
According to initial true O&D level data released this week by FlightBI, total U.S. domestic air travel increased in December 2025. International travel volumes also showed an uptick during the same period, accompanied by higher average airfares.
Volume Trend
U.S. domestic passenger traffic reached 54.2 million in December 2025, rebounding from 50.1 million in November and edging 1.2% above December 2024’s 53.5 million. International volumes showed a stronger seasonal pickup, rising from 19.1 million to 22.6 million over the same period.
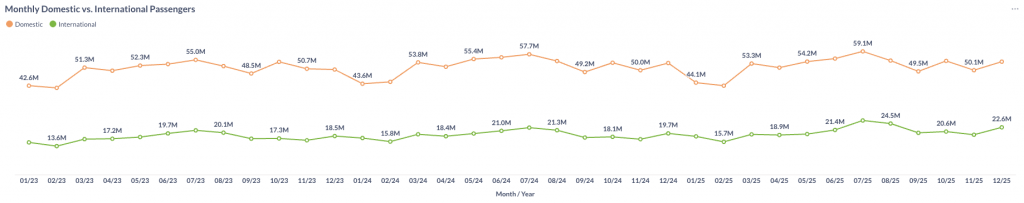
Figure 1: US Domestic and International Air Traffic by Month
Airfare Trend
Domestic airfares rose modestly in December 2025, with the average gross fare increasing from $216 in November to $218, while the average net fare edged up from $185 to $187.
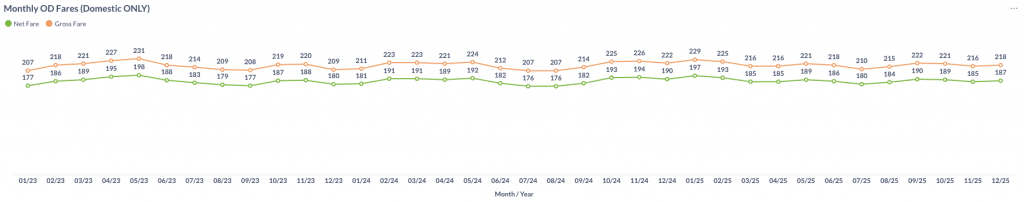
Figure 2: US Domestic Average Airfare by Month
Load Factor Trend
In December 2025, both Available Seat Miles (ASM) and Revenue Passenger Miles (RPM) increased month over month. The average load factor for major U.S. airlines improved to 82.8%, though it remained below the 84.2% recorded in December 2024 (see Figure 3).
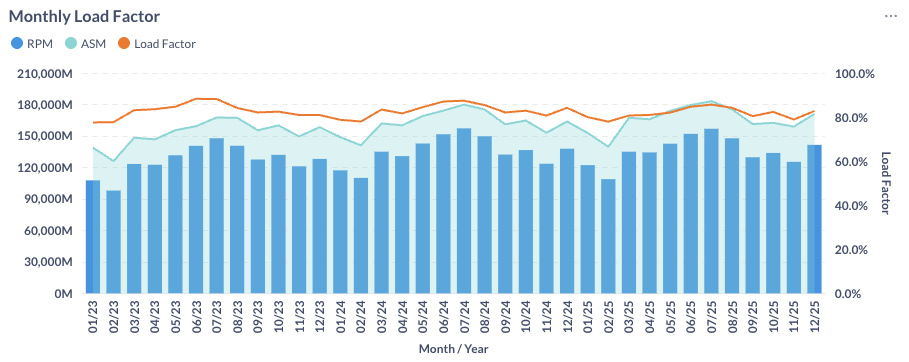
Figure 3: US Airlines’ Average Load Factor by Month
Month Over Month Comparison
Most U.S. airlines saw month-over-month gains in average daily domestic traffic in December 2025, supported by seasonal travel demand and the resumption of normal U.S. government operations. Allegiant (G4) and Alaska (AS) outperformed the industry, with traffic rising 17.2% and 12.1%, respectively, while Spirit (NK) returned to modest growth at 0.5%.
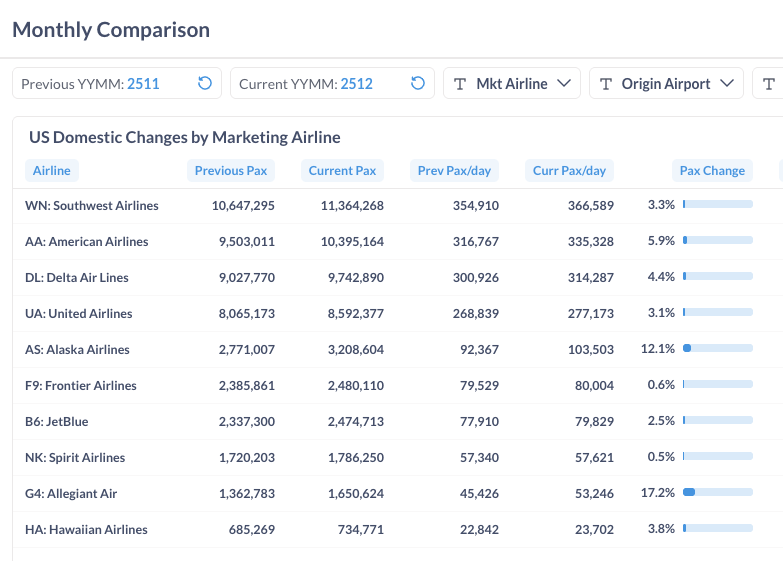
Figure 4: Domestic Air Traffic by Marketing Airlines in November 2025(Previous) vs. December 2025 (Current)
Most U.S. airports also reported passenger gains in December 2025. Seattle (SEA) and two New York airports—EWR and JFK—each posted growth of more than 10%. By contrast, New York–LaGuardia (LGA) saw a slight decline, while San Diego (SAN) was the only major airport to experience a meaningful decrease, down 3%.
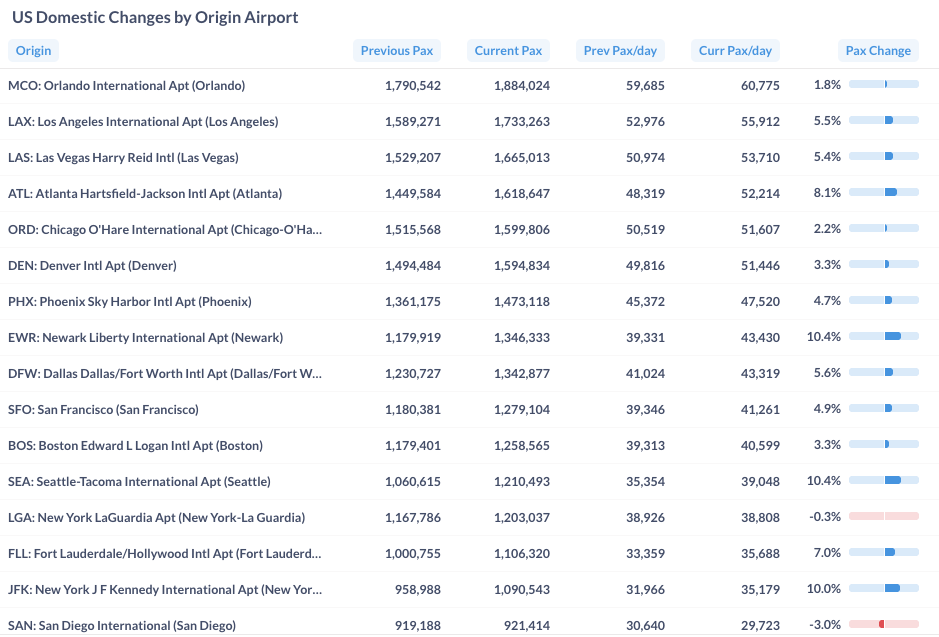
Figure 5: Domestic Air Trafficby Top Airports in November 2025 (Previous) vs. December 2025 (Current)
Year Over Year Comparison
From December 2024 to December 2025, most U.S. airlines recorded year-over-year growth. Allegiant (G4) led with a 6.5% increase, followed by Alaska (AS) and American (AA) at 5.1% and 4.5%, respectively. In contrast, Spirit (NK) remained the most notable decliner, with traffic down 34.4% compared with the same month last year.
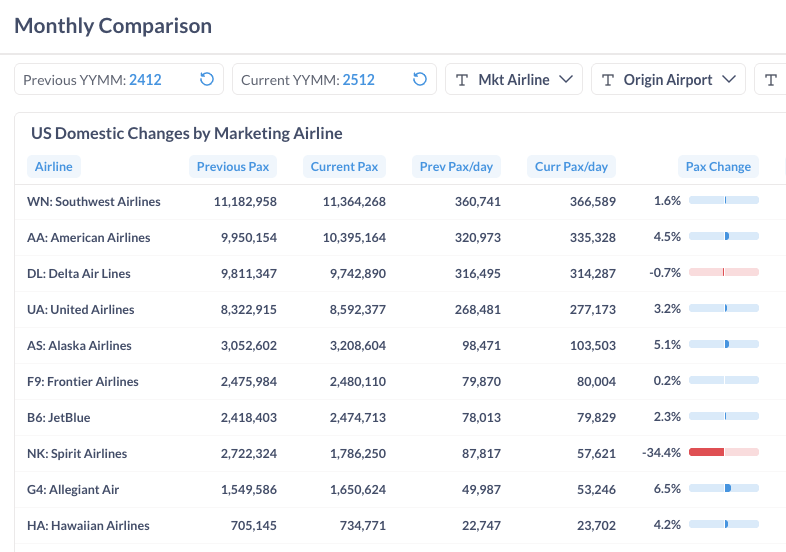
Figure 6: Domestic Air Traffic by Marketing Airlines in December 2025 (Current) vs. December 2024 (Previous)
From December 2024 to December 2025, a greater number of major U.S. airports recorded year-over-year increases in domestic traffic than declines. JFK led growth with a 9.2% increase, partly offset by a 5.6% decline at LaGuardia (LGA). Other airports posting solid gains included San Francisco (SFO) at 4.9%, Chicago O’Hare (ORD) at 4.7%, and Atlanta (ATL) at 4.6%.
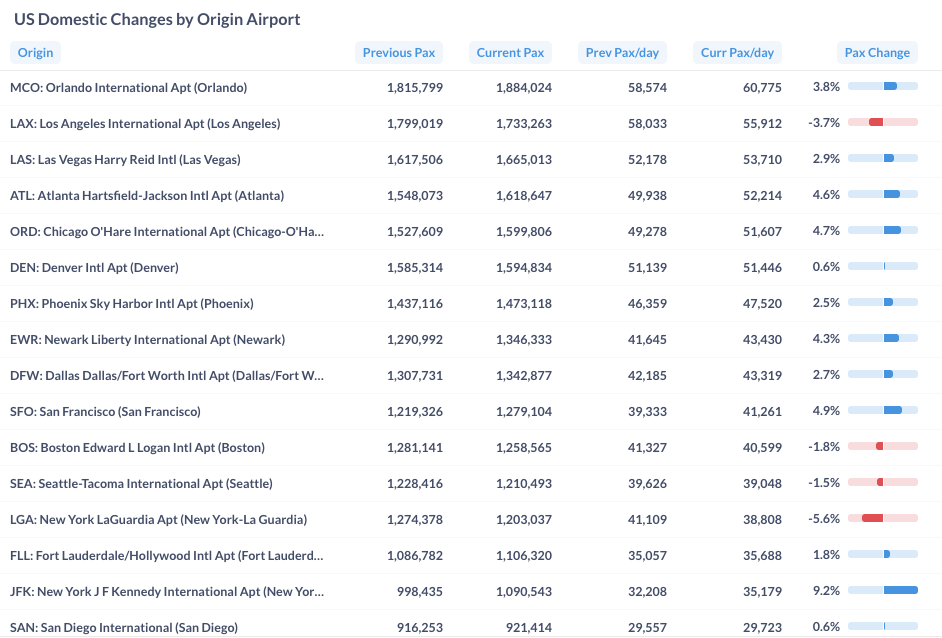
Figure 7: Domestic Air Traffic by Top Origin Airport in December 2025 (Current) vs. December 2024 (Previous)
For more detailed information on traffic and fares by route and airline, please contact service@flightbi.com or request a demo of Fligence USOD. They will be able to provide you with customized information to meet your specific needs and requirements.