Traffic and fare data by airline and route can provide valuable insights into market trends, demand, and competition. By analyzing this data, airlines can optimize their pricing strategies, plan their capacity, and make informed decisions about their route network. The data can also be used for market and competitive analysis, helping airlines identify profitable routes and gain a competitive advantage.
Based on initial true O&D level data from FlightBI released this week, total US domestic air travel saw an decrease in August 2024 compared to the previous month. On the other hand, US international air travel experienced a small growth. Additionally, average airfares showed almost no change during this period.
Volume Trend
In August 2024, domestic passenger numbers dropped from 58.6 million in July to 56.4 million, though this still represented an 8.8% increase compared to August 2023, when 51.9 million passengers were recorded. Meanwhile, the international sector experienced growth, with passenger numbers rising from 23.3 million in July to 24.5 million in August 2024.
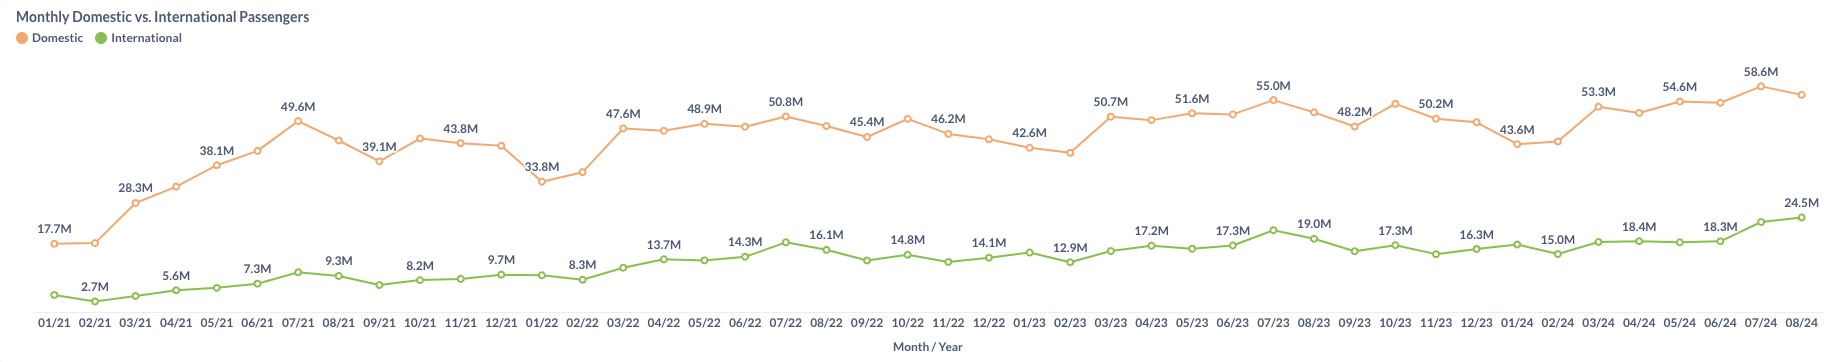
Figure 1: US Domestic and International Air Traffic by Month
Airfare Trend
After several months of decline, airfare has stabilized. The average gross fare remained unchanged at $198 from July to August, while the average net fare saw a slight decrease, moving from $170 to $169 during the same period.
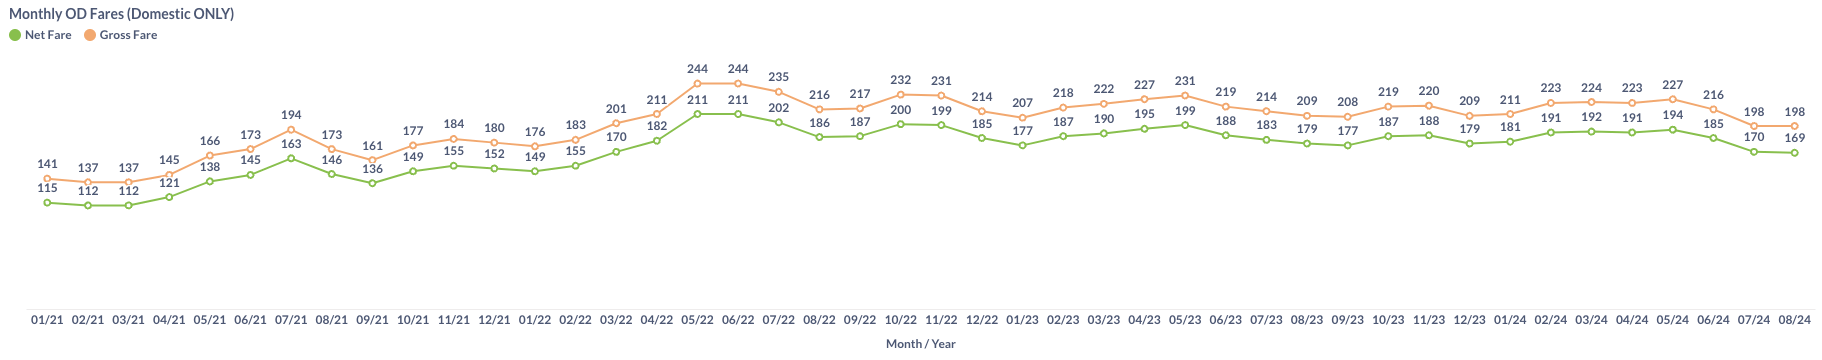
Figure 2: US Domestic Average Airfare by Month
Load Factor Trend
In August 2024, both Available Seat Miles (ASM) and Revenue Passenger Miles (RPM) increased compared to the previous month, while the average load factor for major U.S. airlines declined to 85.5%, as shown in Figure 3. Despite the drop, this remains higher than the 84.1% recorded in August 2023.
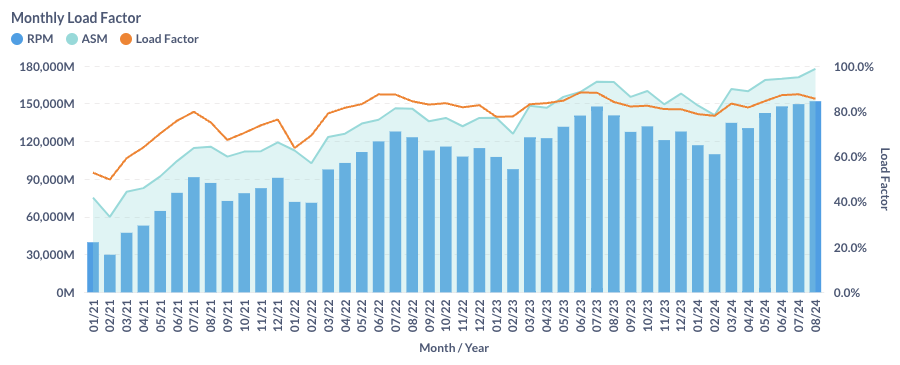
Figure 3: US Airlines’ Average Load Factor by Month
Month Over Month Comparison
In August 2024, most major U.S. airlines saw a decline in daily traffic compared to July 2024. Allegiant (G4) experienced the largest drop, with a 27.5% decrease following significant capacity cuts. In contrast, JetBlue (B6) reported an 8.6% increase in traffic.
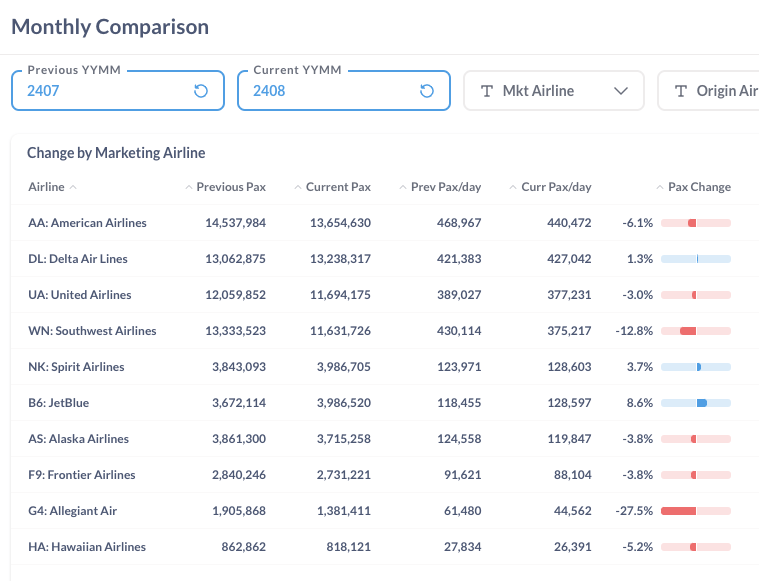
Figure 4: Air Traffic by Dominant Marketing Airlines in July 2024 (Previous) vs. August 2024 (Current)
During this period, traffic increased at some airports while declining at others. Boston (BOS) and New York (JFK) recorded the highest month-to-month growth rates, at 9.7% and 7.9%, respectively. In contrast, Dallas (DFW) and Denver (DEN) experienced declines of 6.9% and 6.7% compared to the previous month.
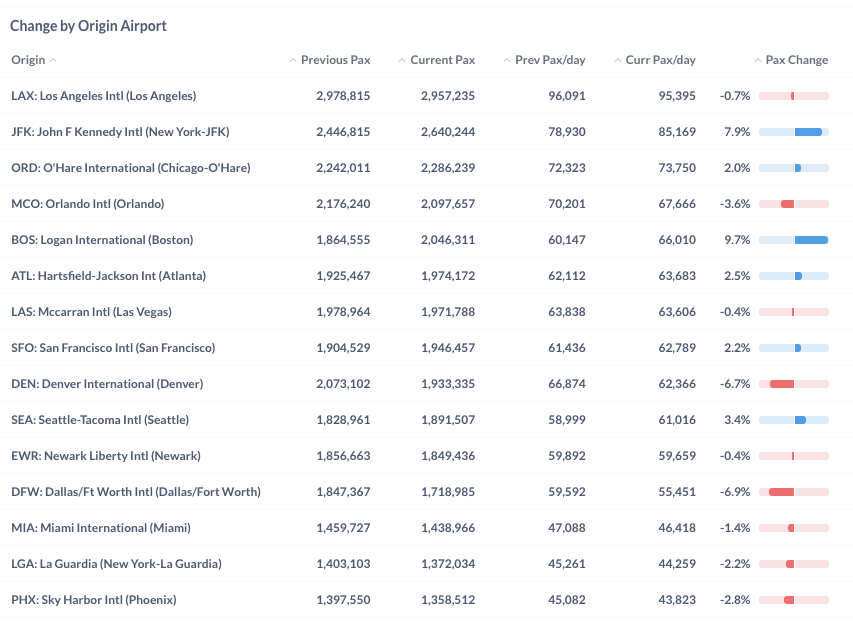
Figure 5: Air Traffic by Top Origin Airports in July 2024 (Previous) vs. August 2024 (Current)
Year Over Year Comparison
Between August 2023 and August 2024, all major U.S. airlines saw growth, with low-cost carriers Frontier (F9) and Spirit (NK) leading the way, posting growth rates of 23.8% and 19.1%, respectively. Among the legacy carriers, American (AA) and Delta (DL) outpaced United (UA) in terms of growth.
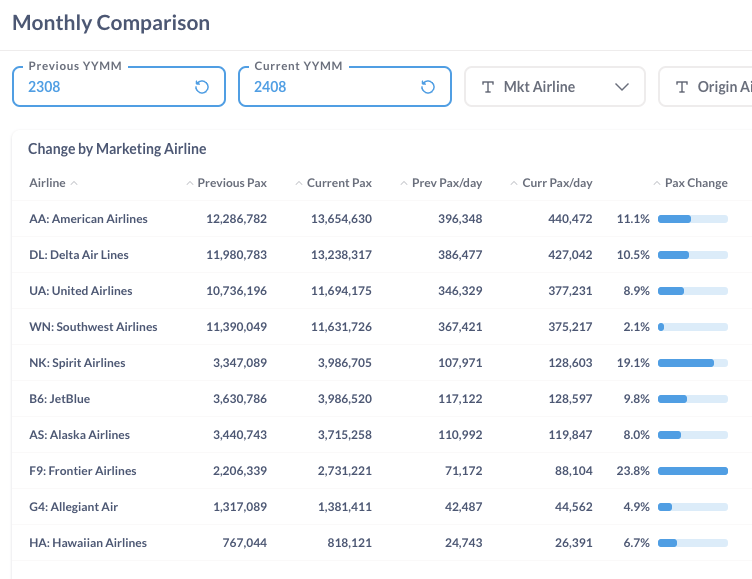
Figure 6: Air Traffic by Dominant Marketing Airlines in August 2024 (Current) vs. August 2023 (Previous)
From August 2023 to August 2024, all major airports experienced increased traffic. Boston (BOS), Dallas (DFW), and Chicago (ORD) led this year-over-year growth, with notable expansions of 23.5%, 21.6%, and 21.6%, respectively.
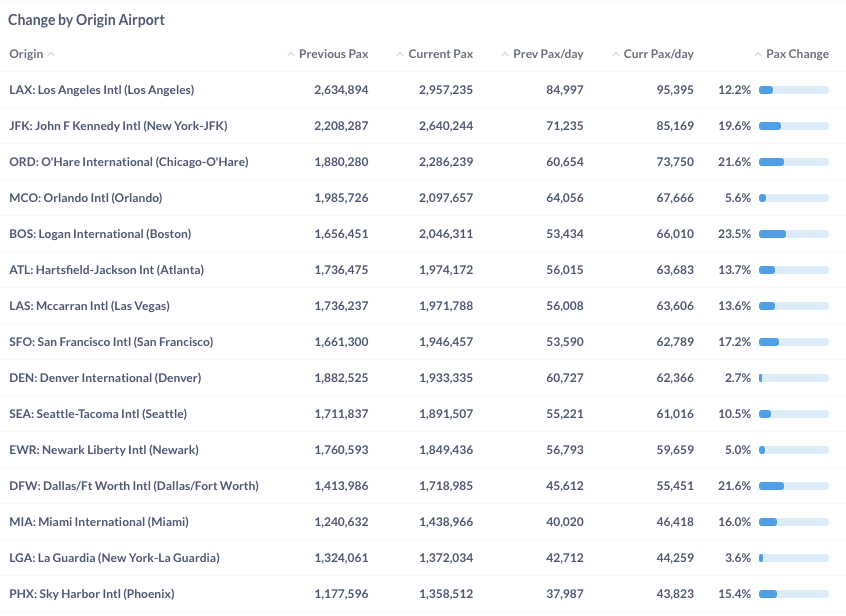
Figure 7: Air Traffic by Top Origin Airport in August 2024 (Current) vs. August 2023 (Previous)
For more detailed information on traffic and fares by route and airline, please contact service@flightbi.com or request a demo of Fligence USOD. They will be able to provide you with customized information to meet your specific needs and requirements.