Traffic and fare data by airline and route can provide valuable insights into market trends, demand, and competition. By analyzing this data, airlines can optimize their pricing strategies, plan their capacity, and make informed decisions about their route network. The data can also be used for market and competitive analysis, helping airlines identify profitable routes and gain a competitive advantage.
According to initial true O&D level data from FlightBI released this week, total U.S. domestic air travel declined in April 2025 compared to March. International travel volumes also saw a slight decrease. In contrast, average airfares rose during the same period.
Volume Trend
In April 2025, U.S. domestic passenger numbers declined from 55.4 million in March to 53.2 million, though this still represents a 2.9% increase compared to the 51.7 million recorded in April 2024. In the international sector, passenger volumes fell from 21.6 million in March to 20.9 million in April.
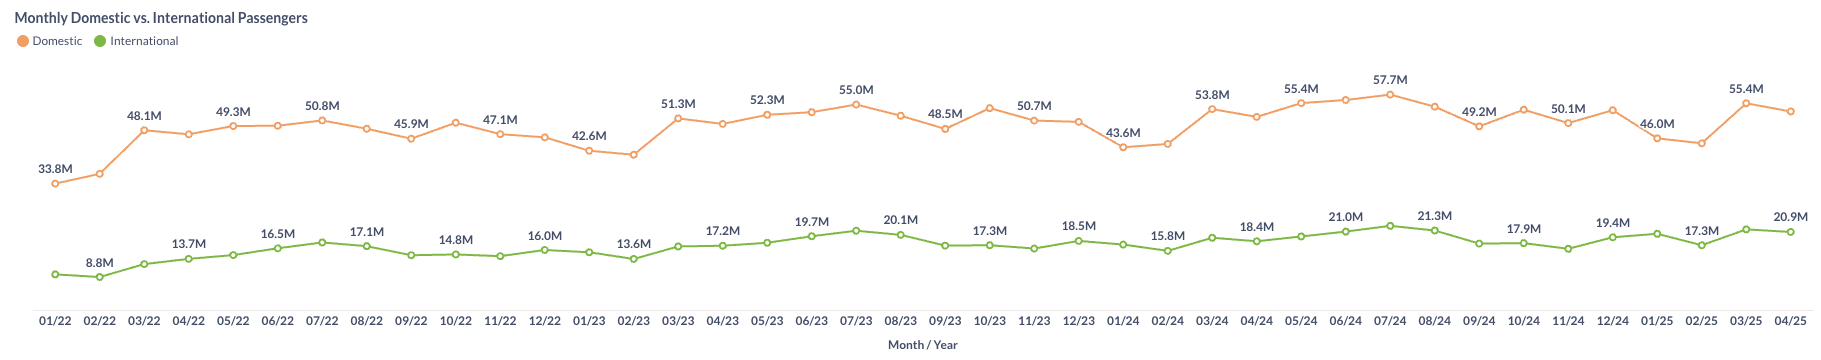
Figure 1: US Domestic and International Air Traffic by Month
Airfare Trend
Airfare trends shifted direction in April 2025, with the average gross fare rising from $212 in March to $216. Similarly, the average net fare increased from $182 to $186 during the same period.
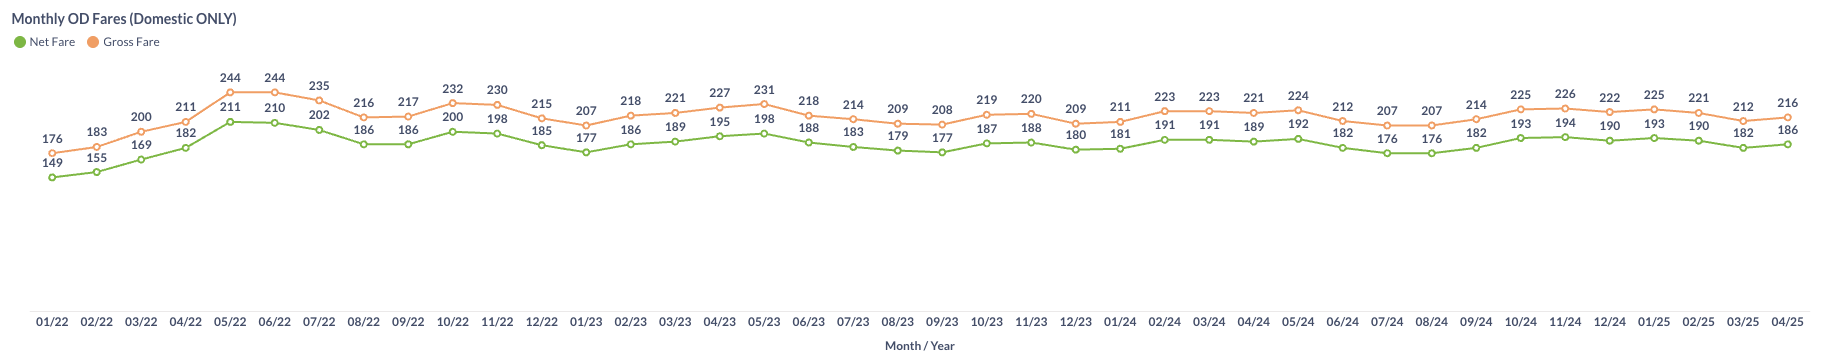
Figure 2: US Domestic Average Airfare by Month
Load Factor Trend
In April 2025, both Available Seat Miles (ASM) and Revenue Passenger Miles (RPM) declined compared to the previous month. The average load factor for major U.S. airlines reduced to 79.1%, remaining below the 81.7% recorded in April 2024, as shown in Figure 3.
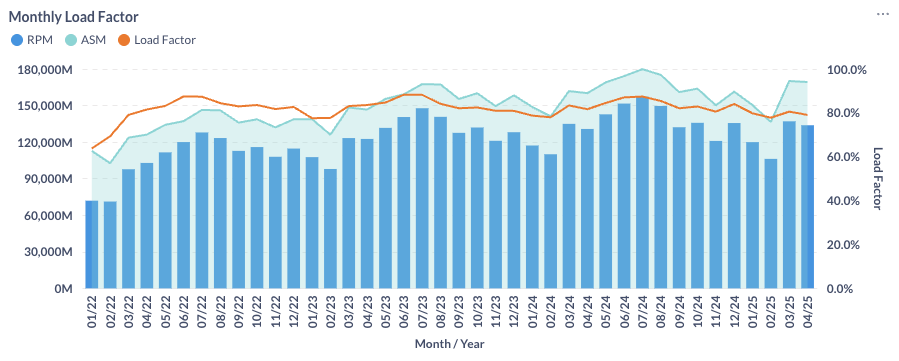
Figure 3: US Airlines’ Average Load Factor by Month
Month Over Month Comparison
In April 2025, many major U.S. airlines experienced a decline in daily traffic compared to March. Allegiant Air (G4) led the drop with a 21.0% decrease, followed by other low-cost carriers—Spirit (NK) at 10.7% and Frontier (F9) at 5.7%. In contrast, network carriers such as American Airlines (AA) and Delta Air Lines (DL) posted gains of 4.4% and 2.8%, respectively.
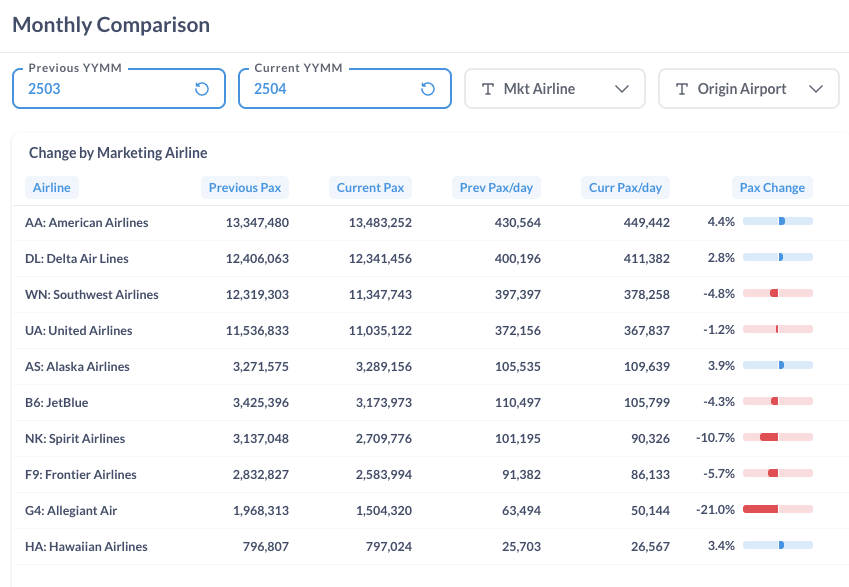
Figure 4: Air Traffic by Dominant Marketing Airlines in March 2025 (Previous) vs. April 2025 (Current)
Airport-level trends in April 2025 presented a mixed picture. New York (JFK) and Atlanta (ATL) recorded strong growth of 14.1% and 11.4%, respectively. In contrast, Fort Lauderdale (FLL), Miami (MIA), and Phoenix (PHX) saw declines of 8.8%, 7.6%, and 7.0%, respectively.
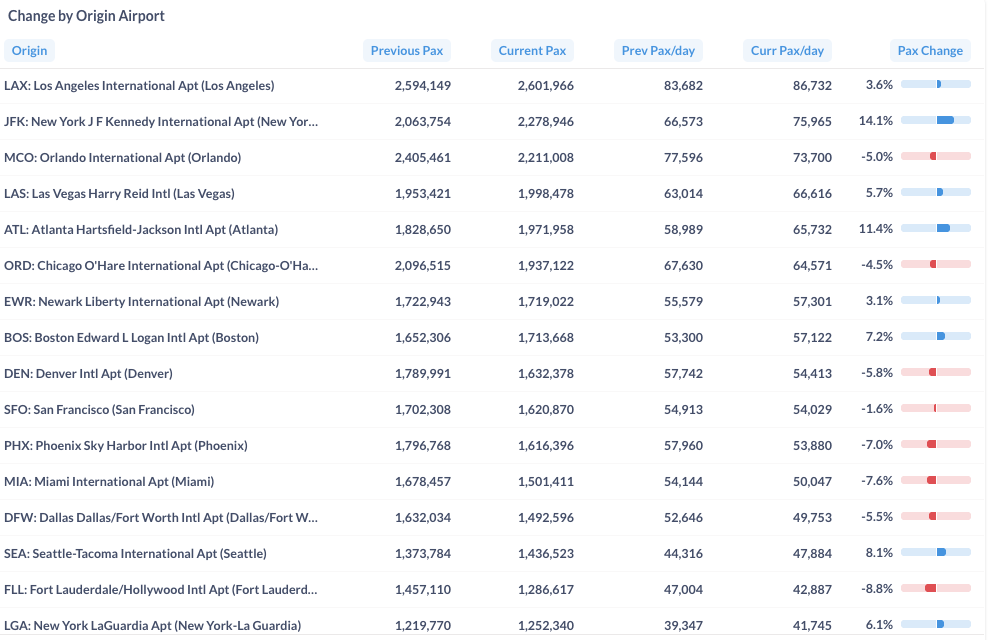
Figure 5: Air Traffic by Top Origin Airports in March 2025 (Previous) vs. April 2025 (Current)
Year Over Year Comparison
Between April 2024 and April 2025, most airlines reported year-over-year growth. Allegiant Air (G4) and Hawaiian Airlines (HA) led the gains, with increases of 12.5% and 9.8%, respectively. In contrast, Spirit Airlines (NK) posted the steepest decline, with traffic down 18.8%. Southwest Airlines (WN) also reported a year-over-year decrease in daily traffic.

Figure 6: Air Traffic by Dominant Marketing Airlines in April 2025 (Current) vs. April 2024 (Previous)
From April 2024 to April 2025, many major U.S. airports saw increased traffic, led by New York (JFK), Atlanta (ATL), and Los Angeles (LAX), which recorded year-over-year growth of 17.6%, 12.2%, and 10.8%, respectively. However, Denver (DEN) and Phoenix (PHX) experienced declines in traffic compared to the same period last year.
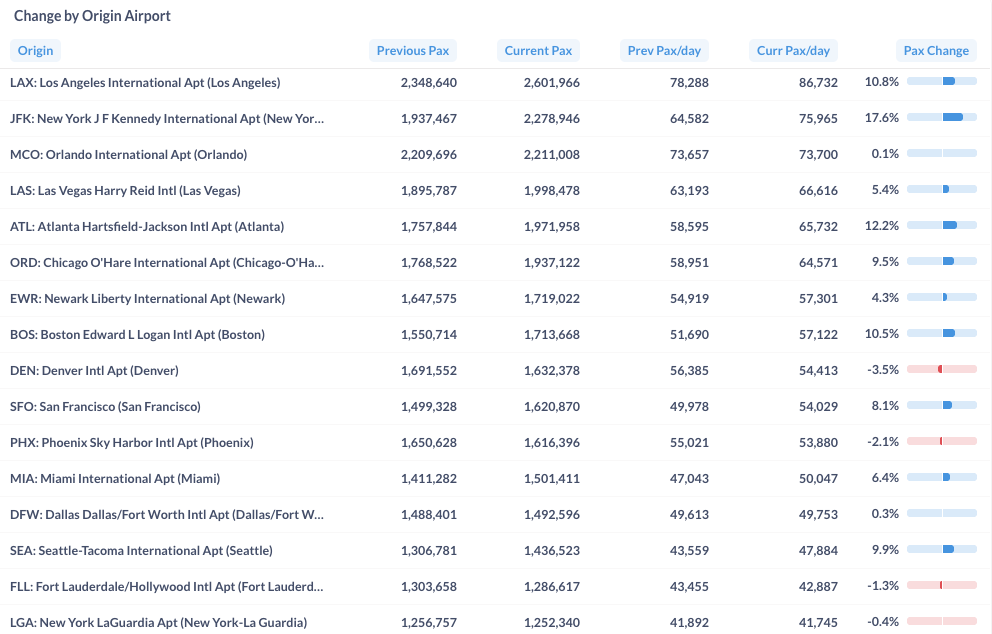
Figure 7: Air Traffic by Top Origin Airport in April 2025 (Current) vs. April 2024 (Previous)
For more detailed information on traffic and fares by route and airline, please contact service@flightbi.com or request a demo of Fligence USOD. They will be able to provide you with customized information to meet your specific needs and requirements.